. 2021 Aug;596(7871):291-295.
doi: 10.1038/s41586-021-03770-2. Epub 2021 Jul 28.

Regulated control of gene therapies by drug-induced splicing

Affiliations

Regulated control of gene therapies by drug-induced splicing

Alex Mas Monteys et al. Nature. 2021 Aug.

Erratum in

Abstract

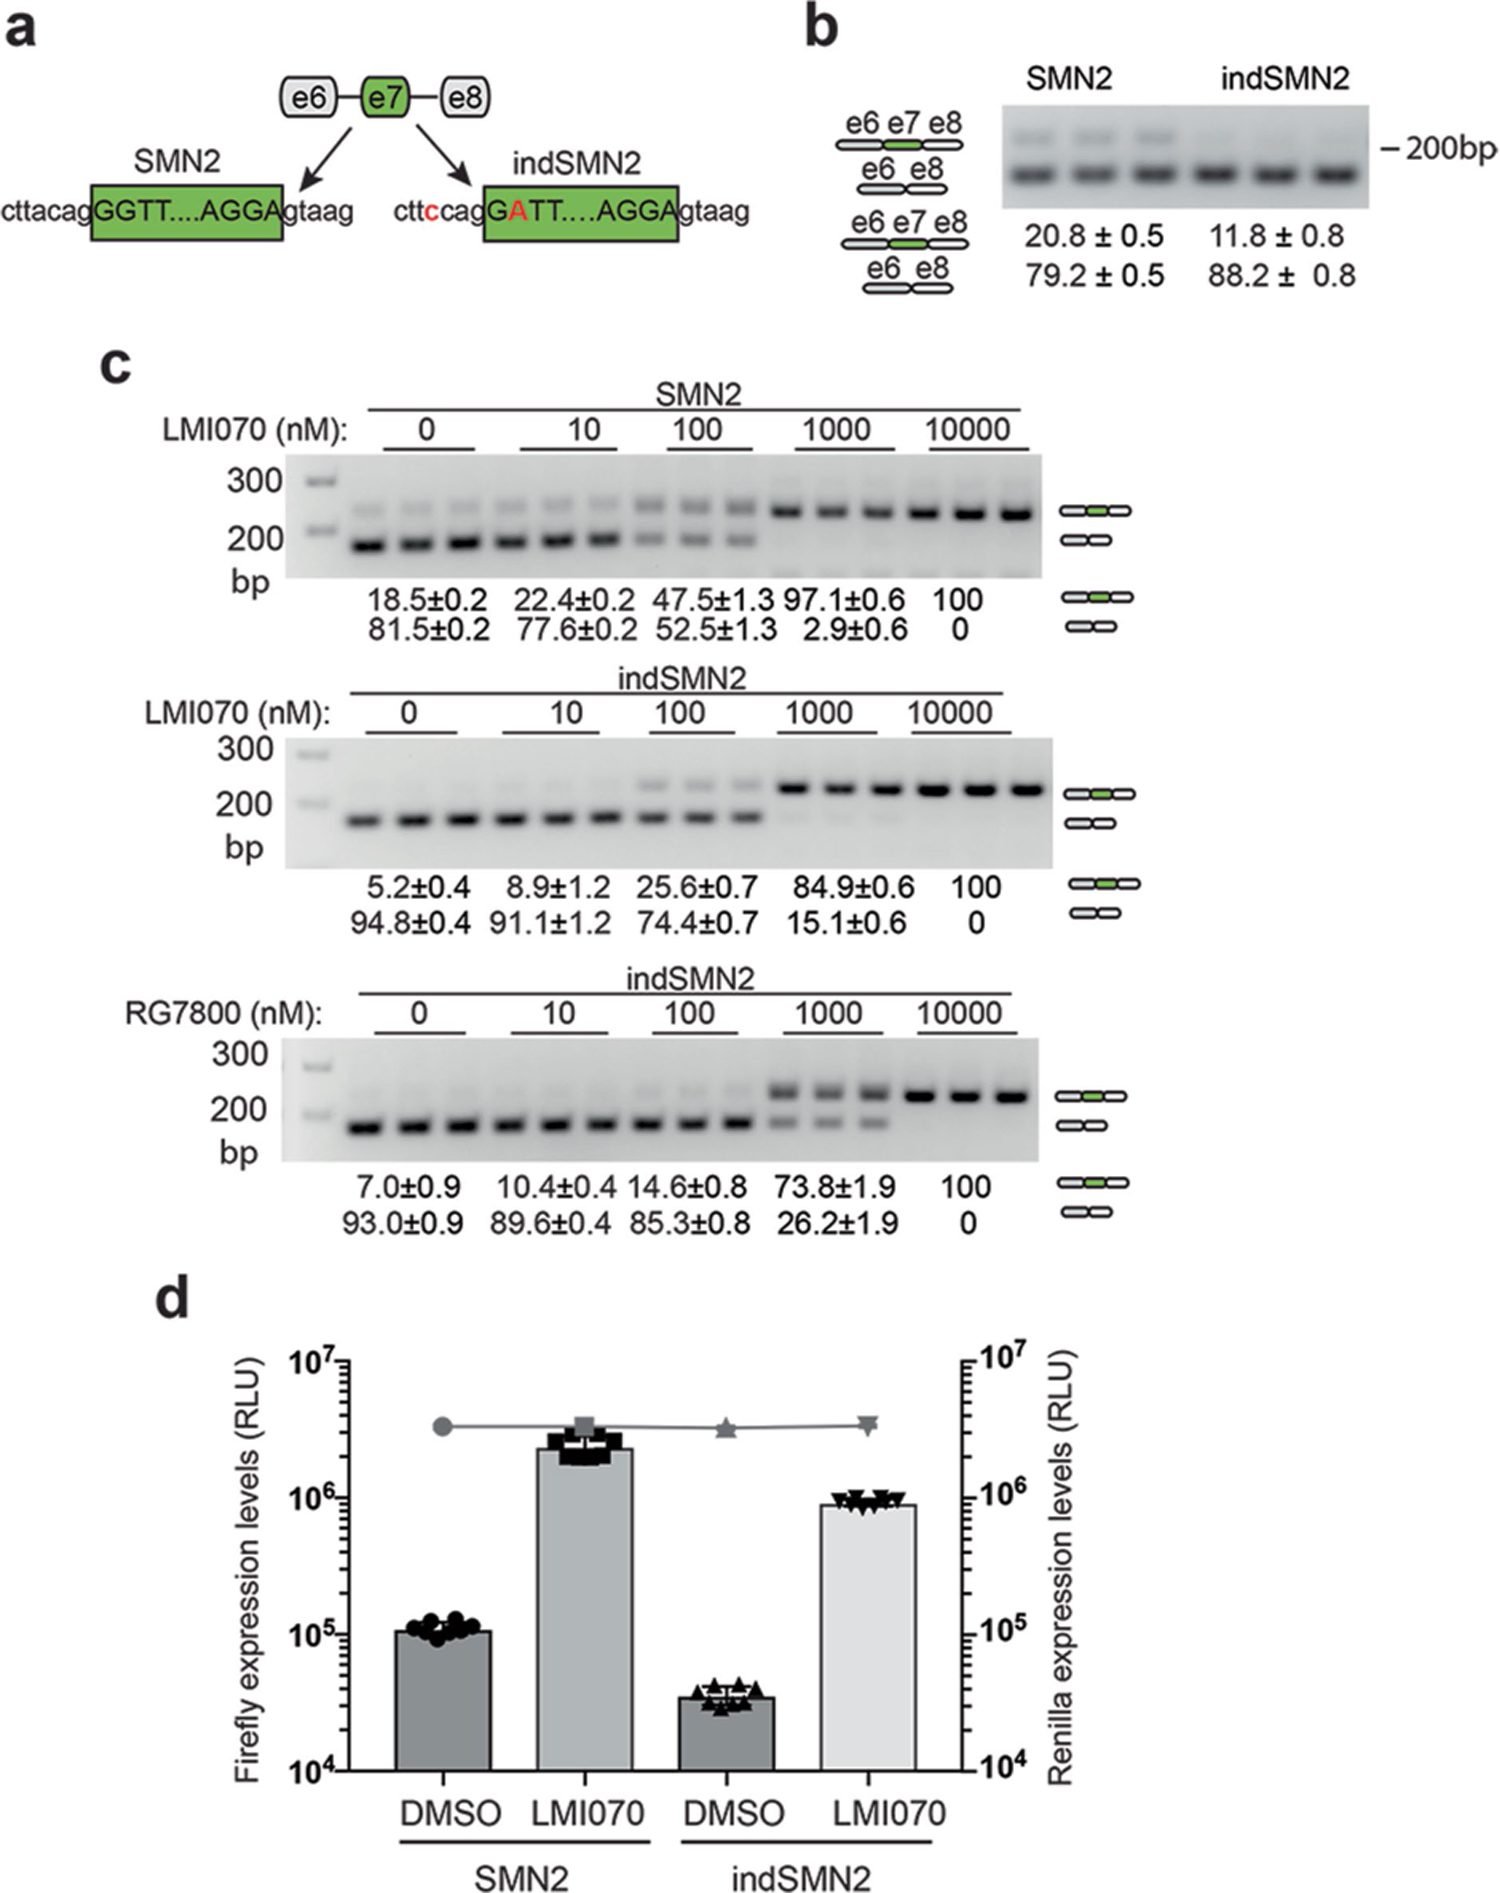
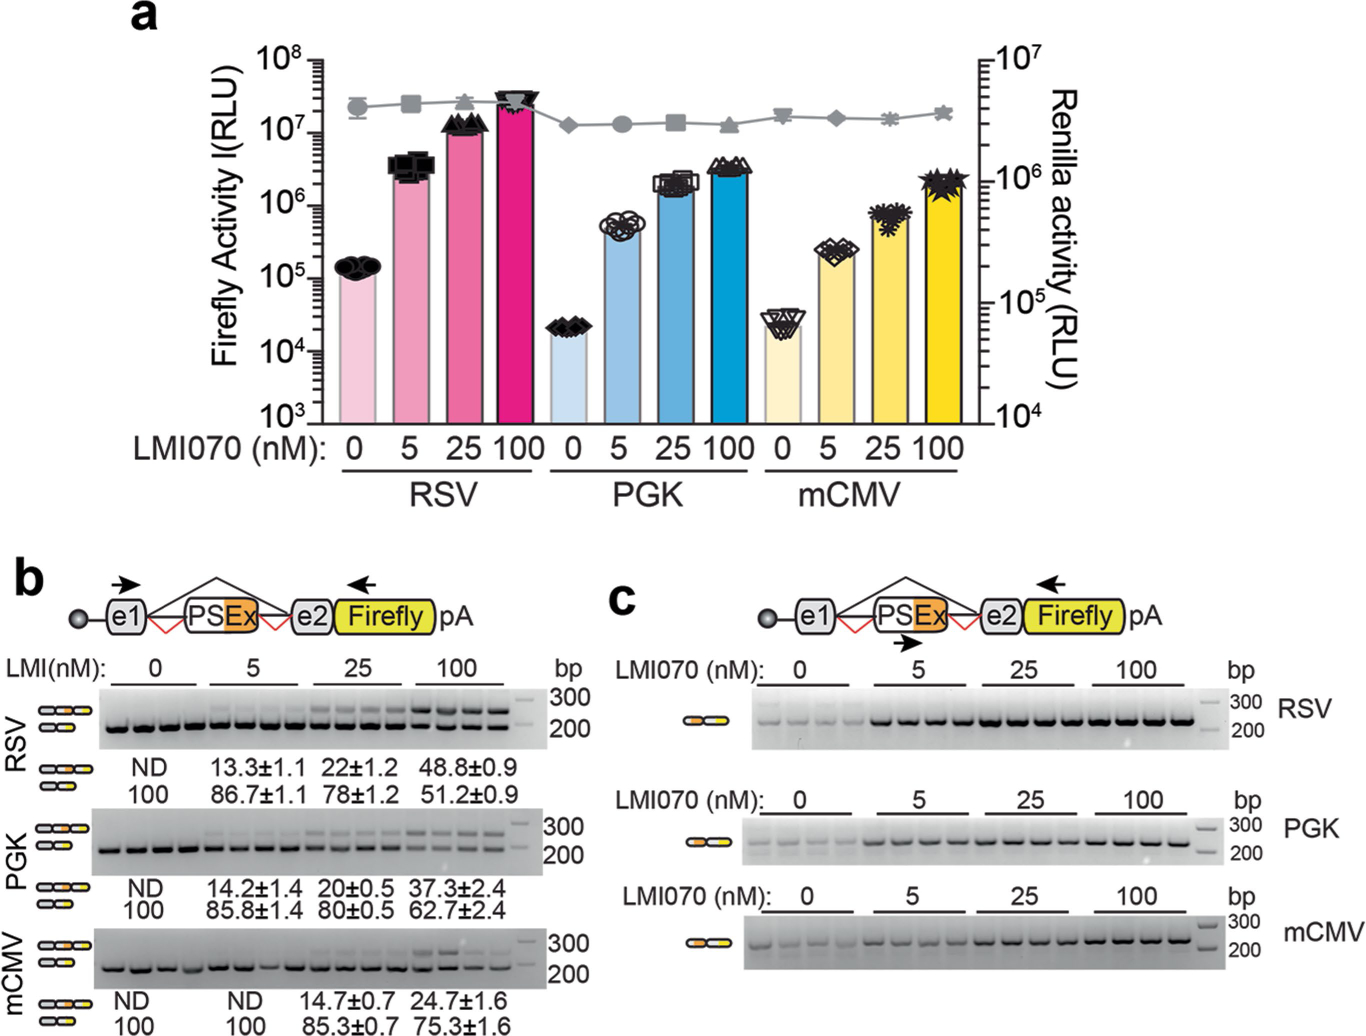
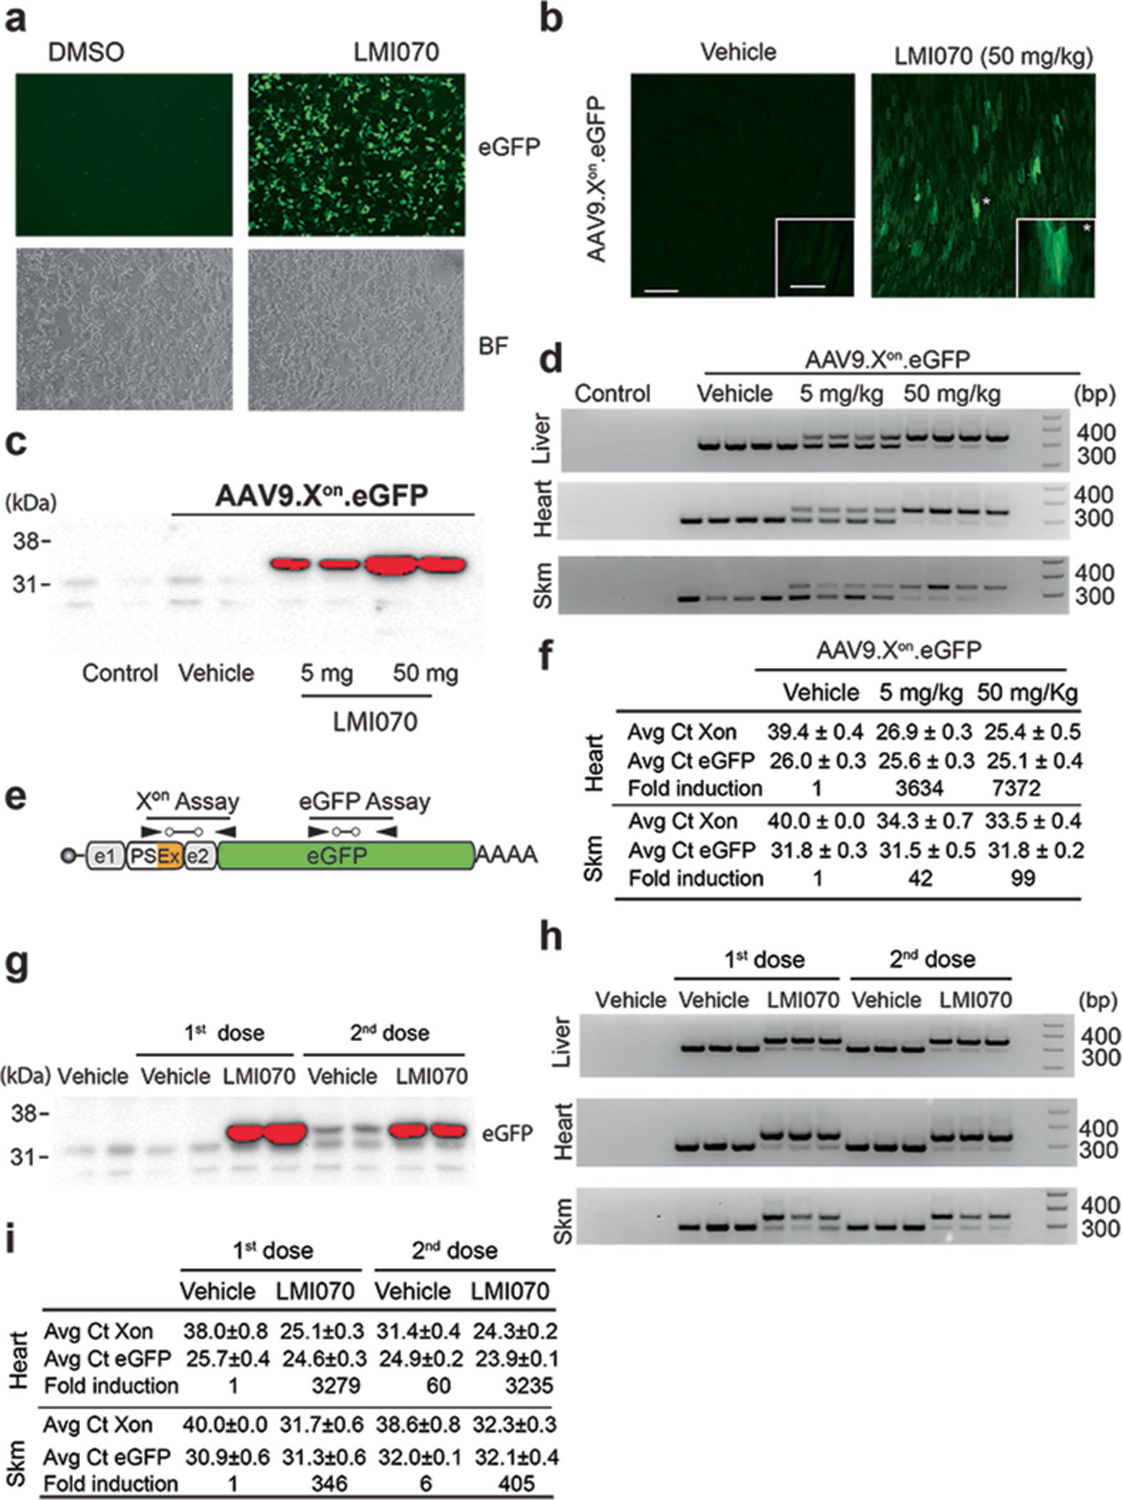
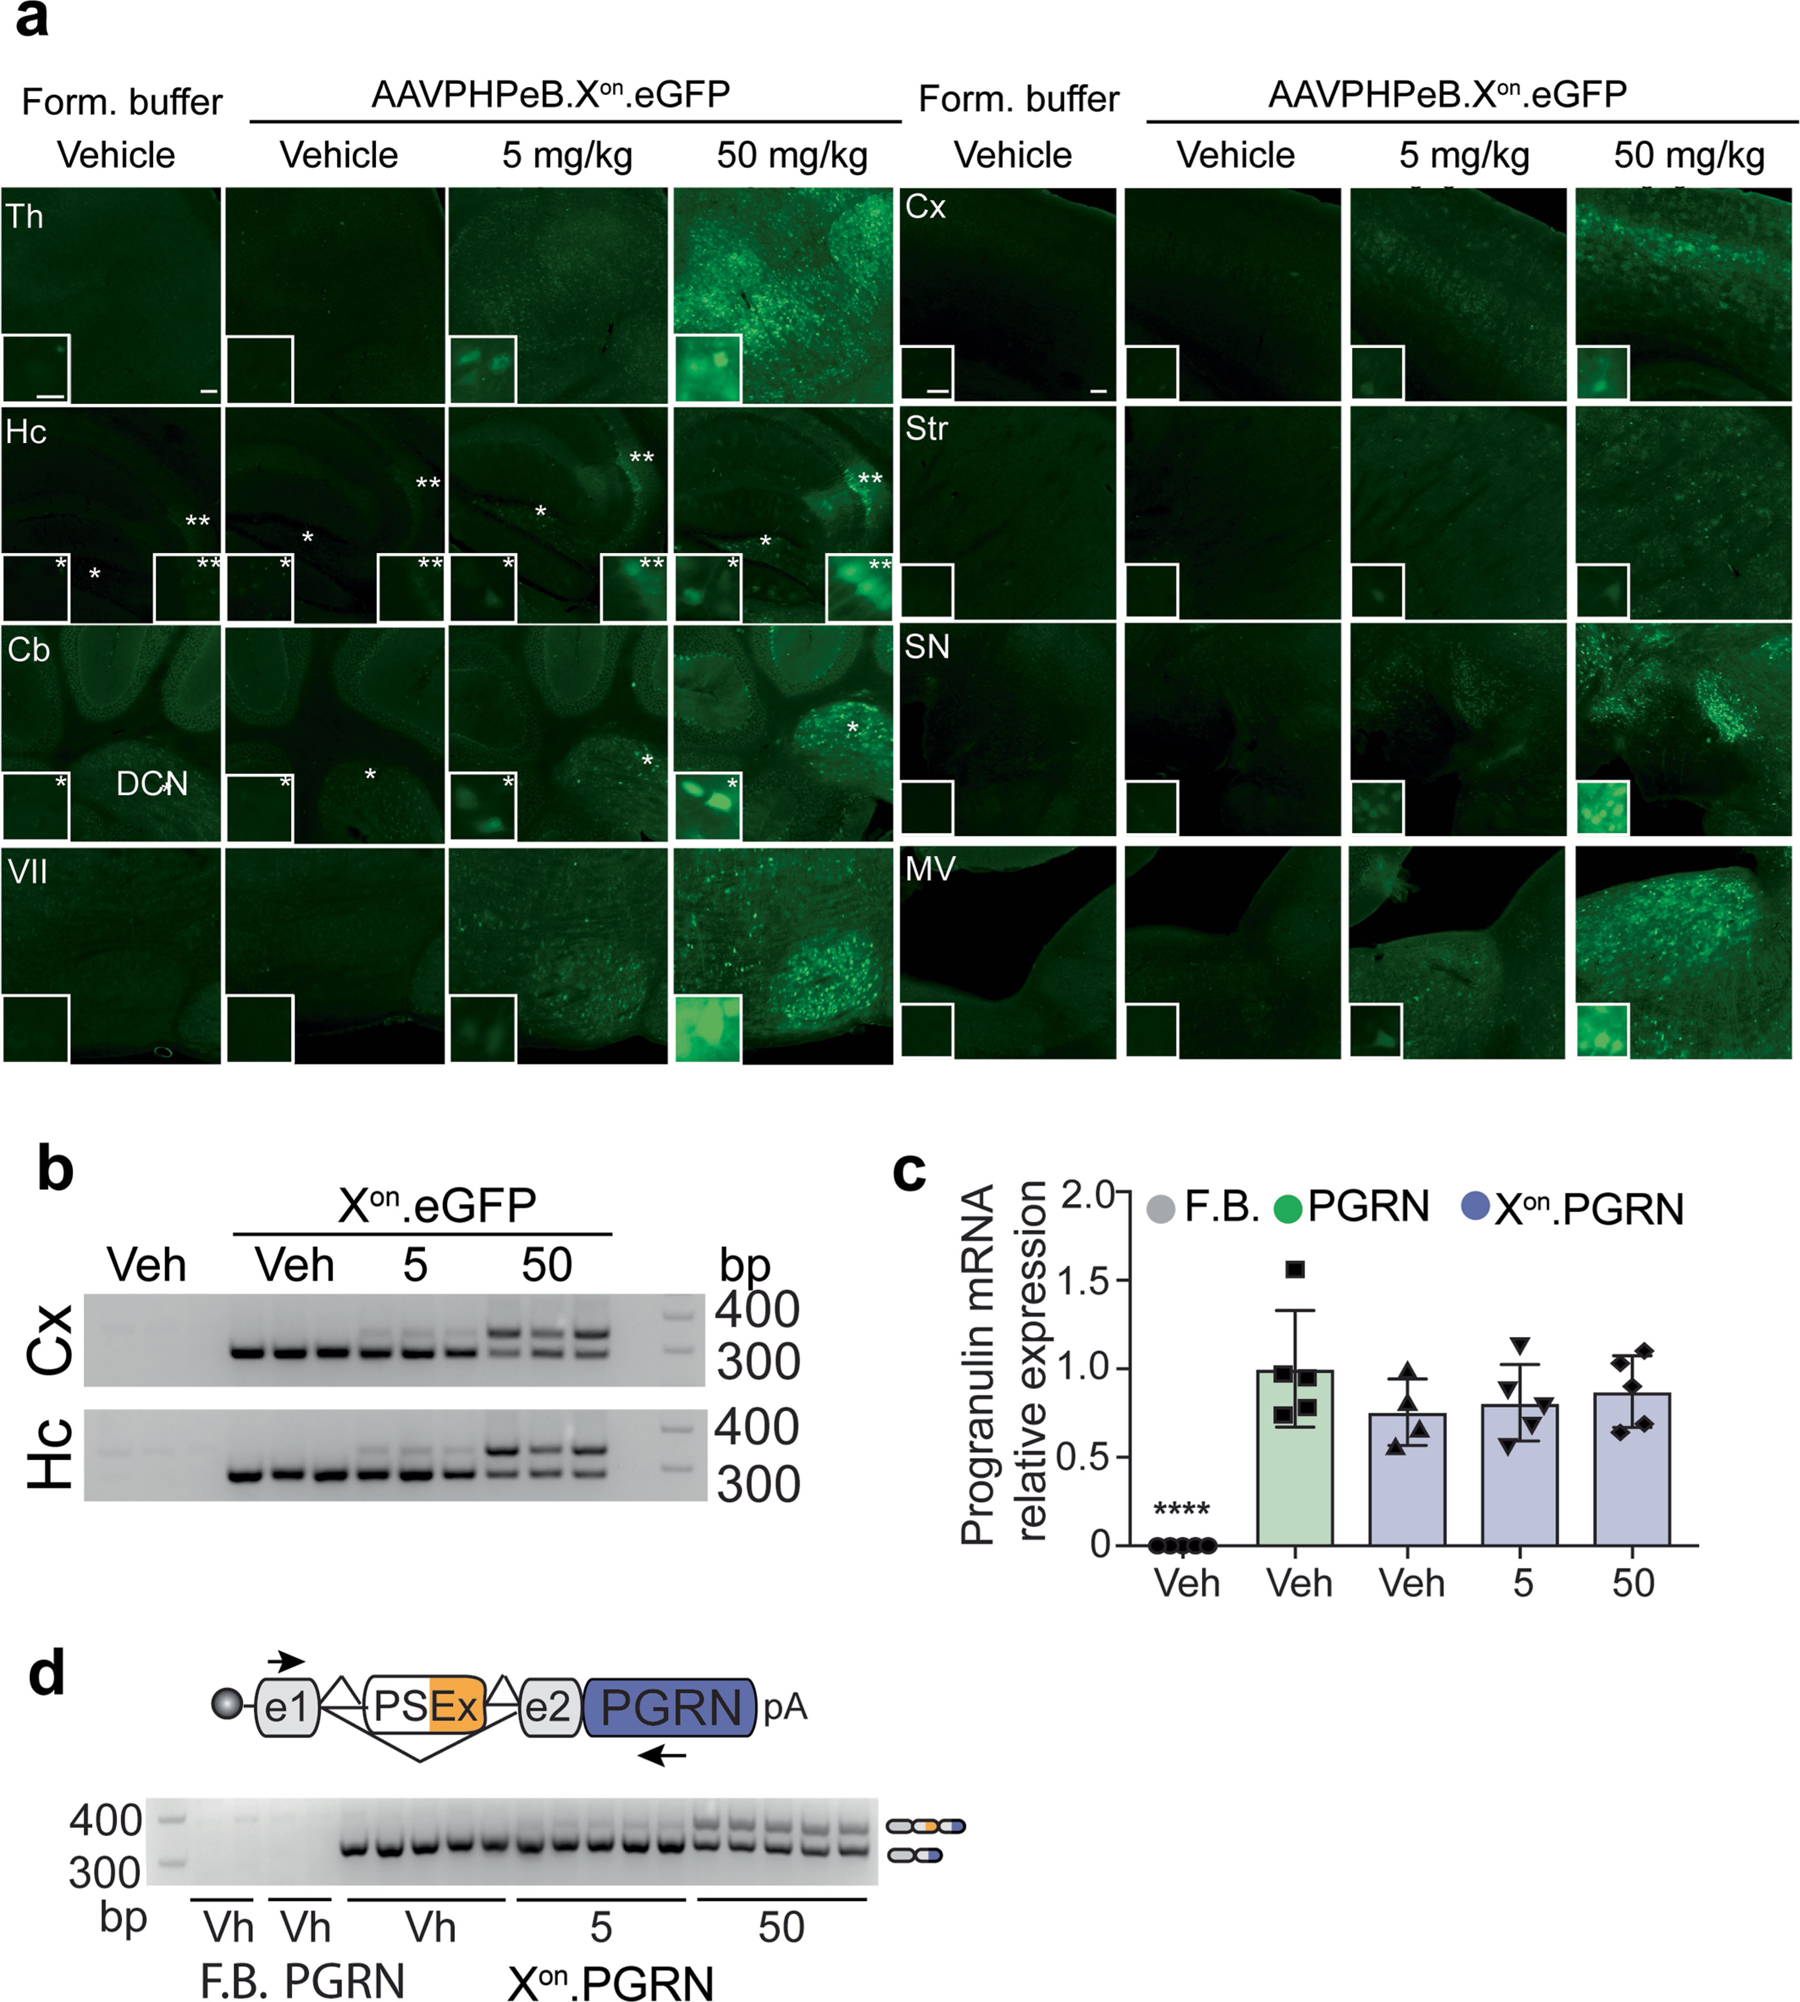
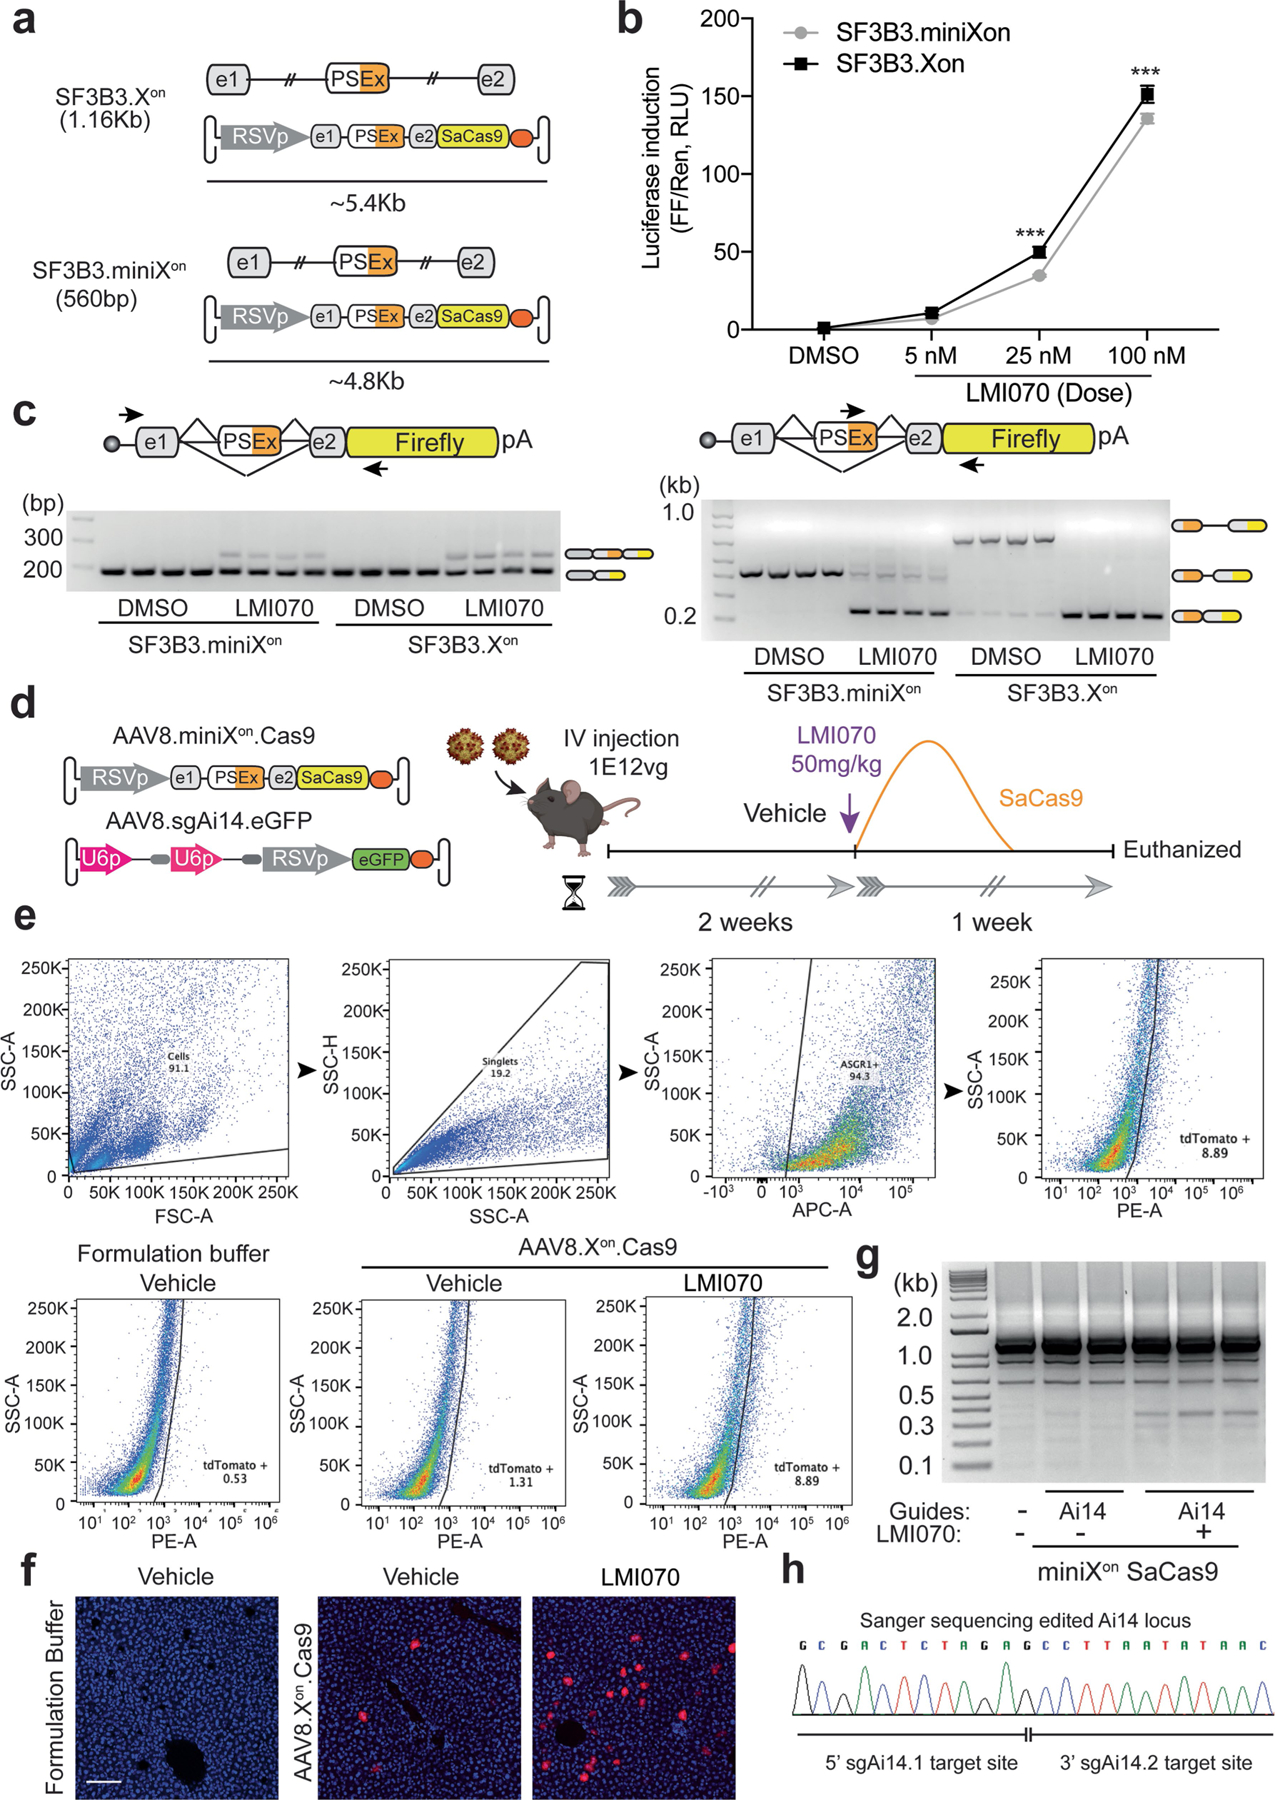
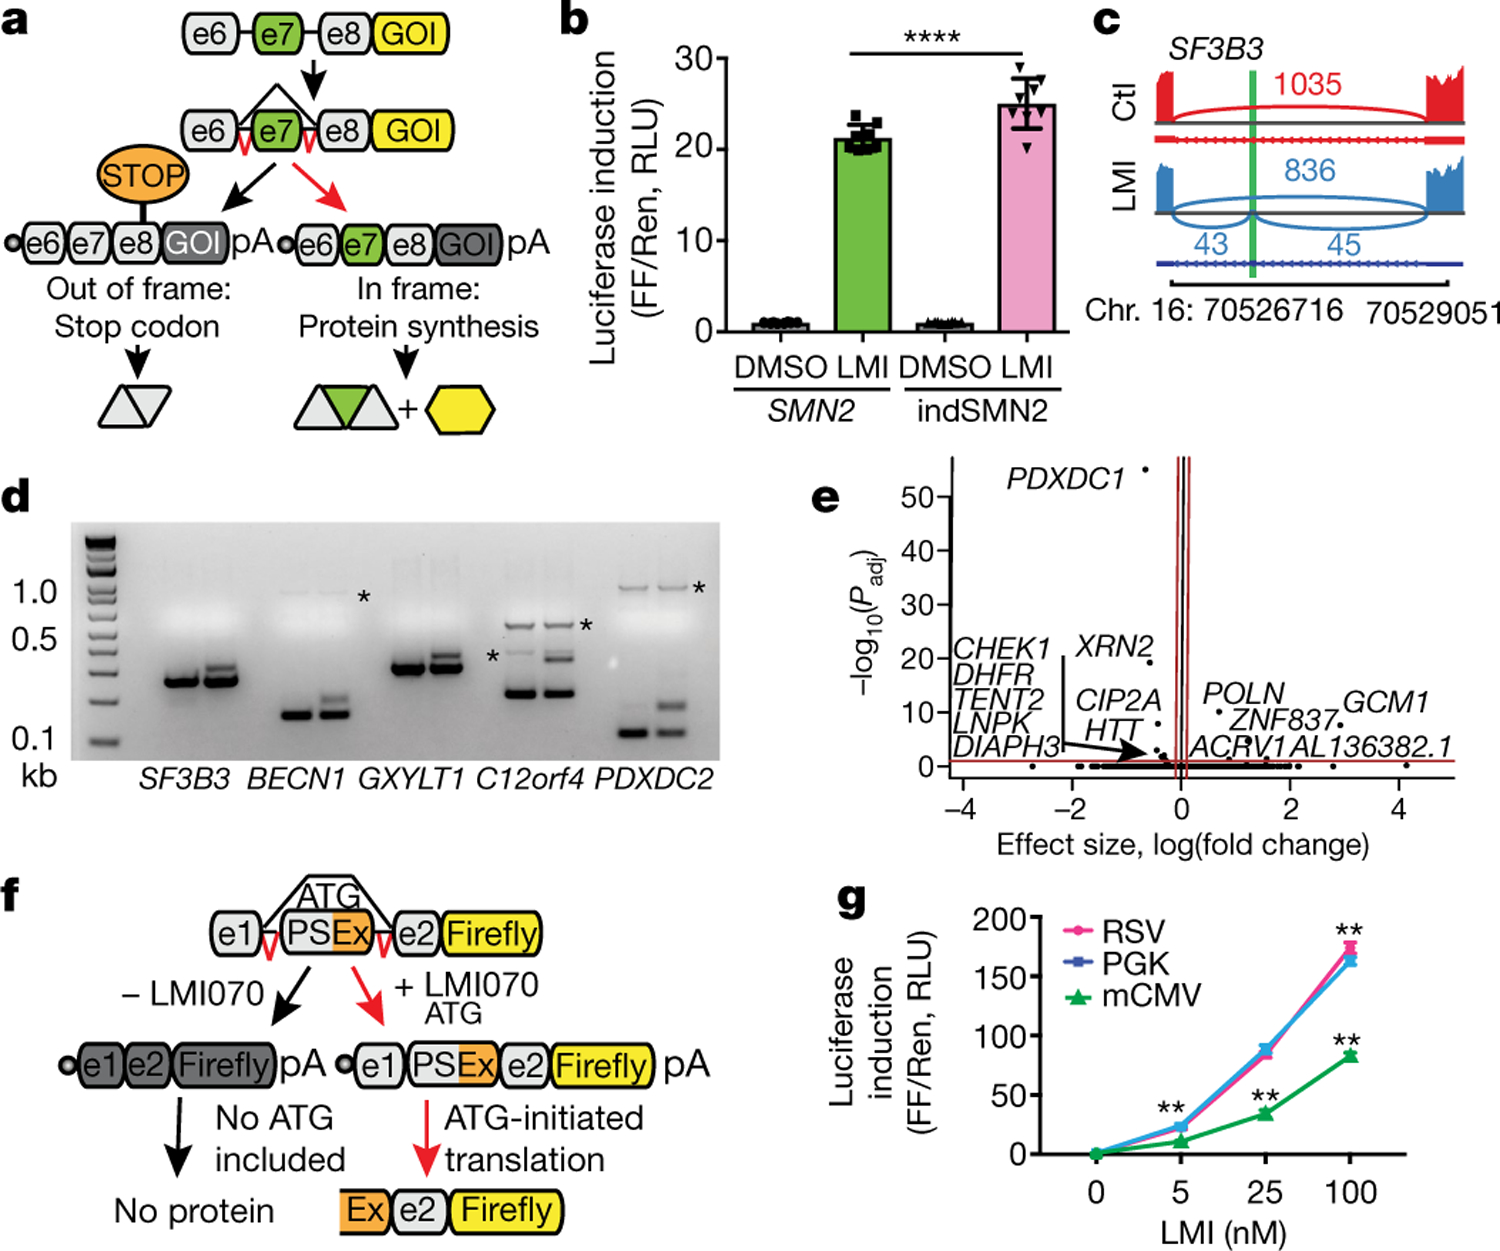
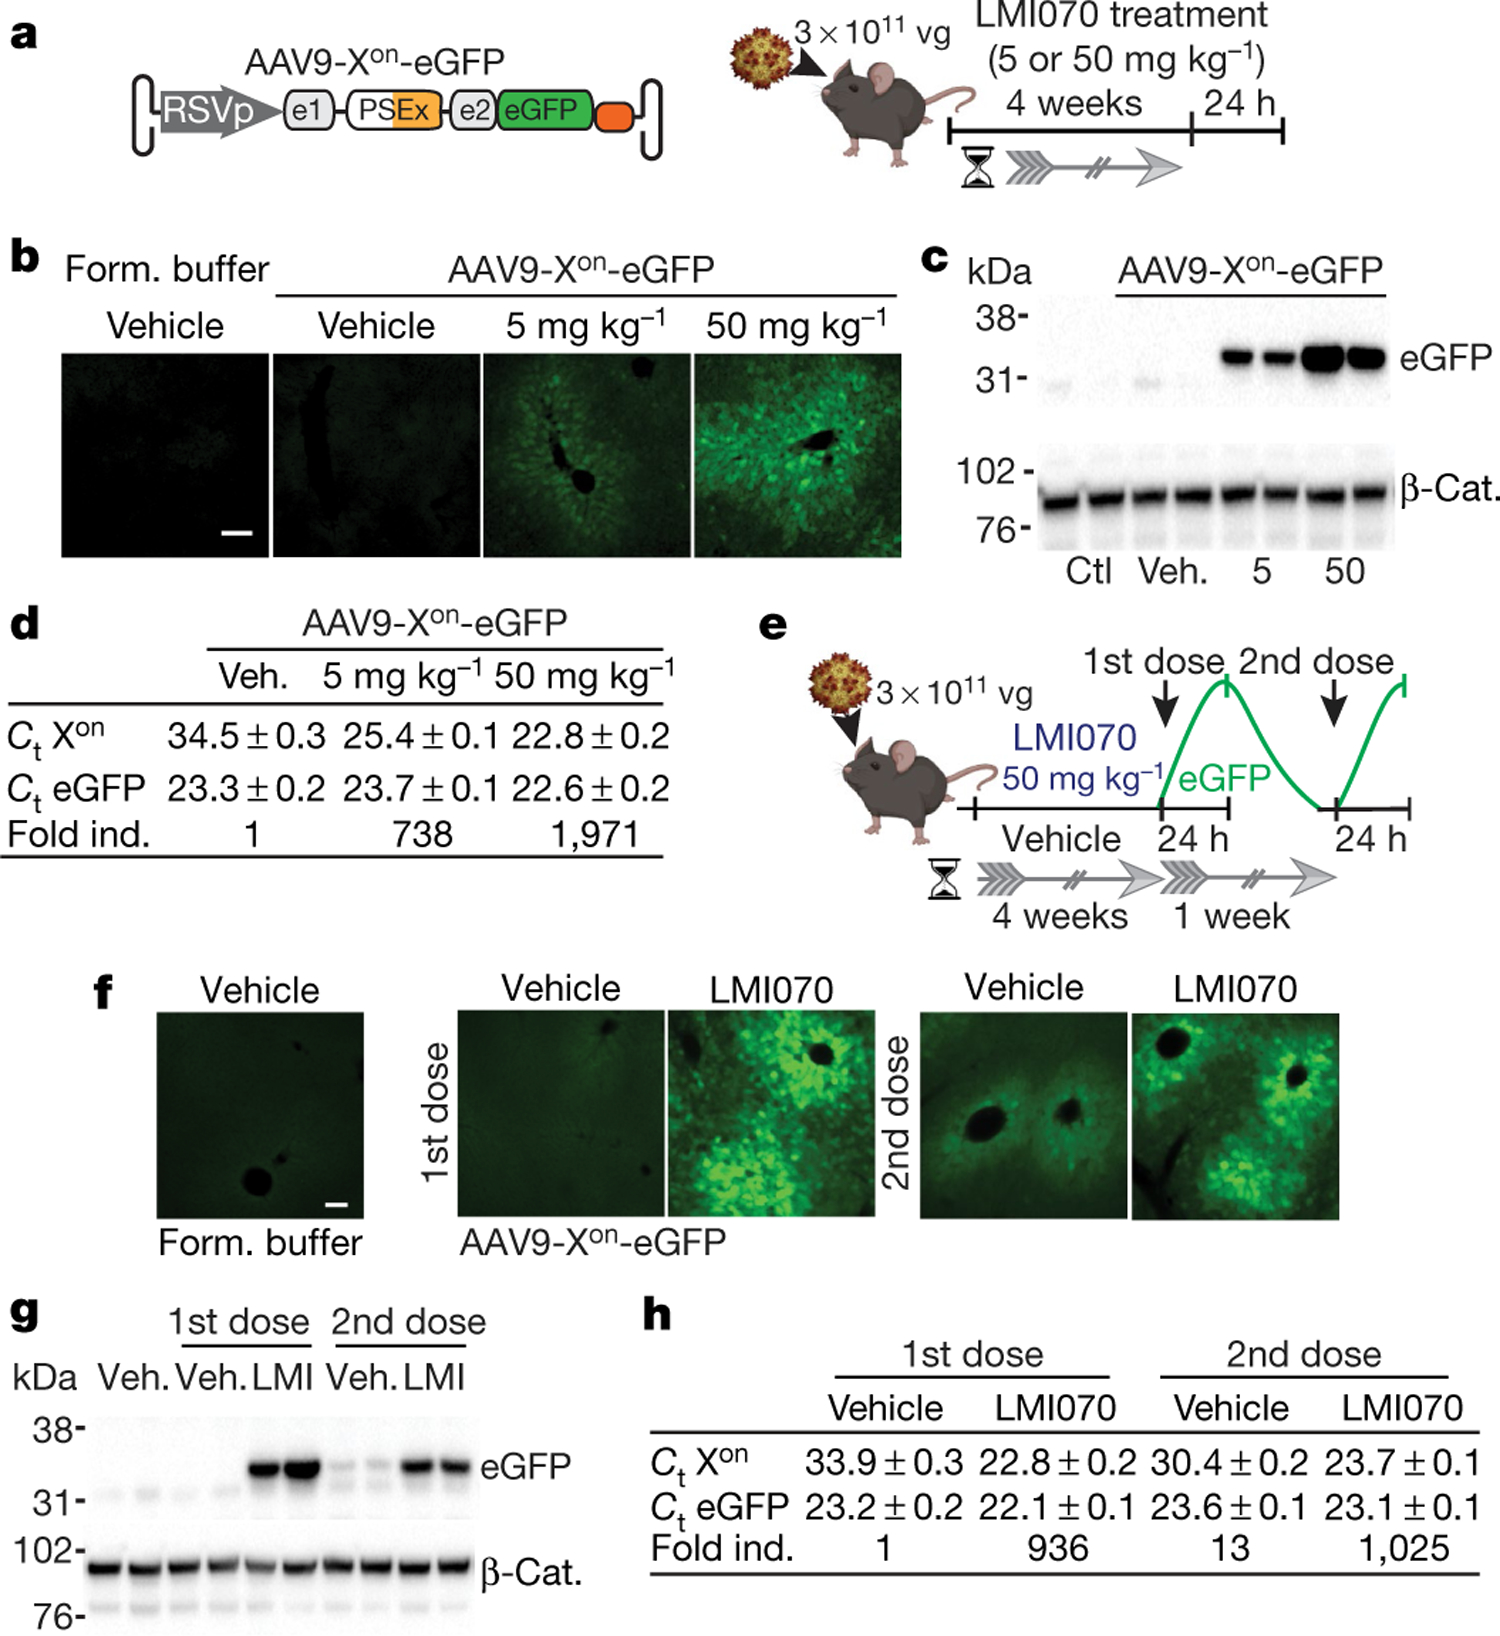
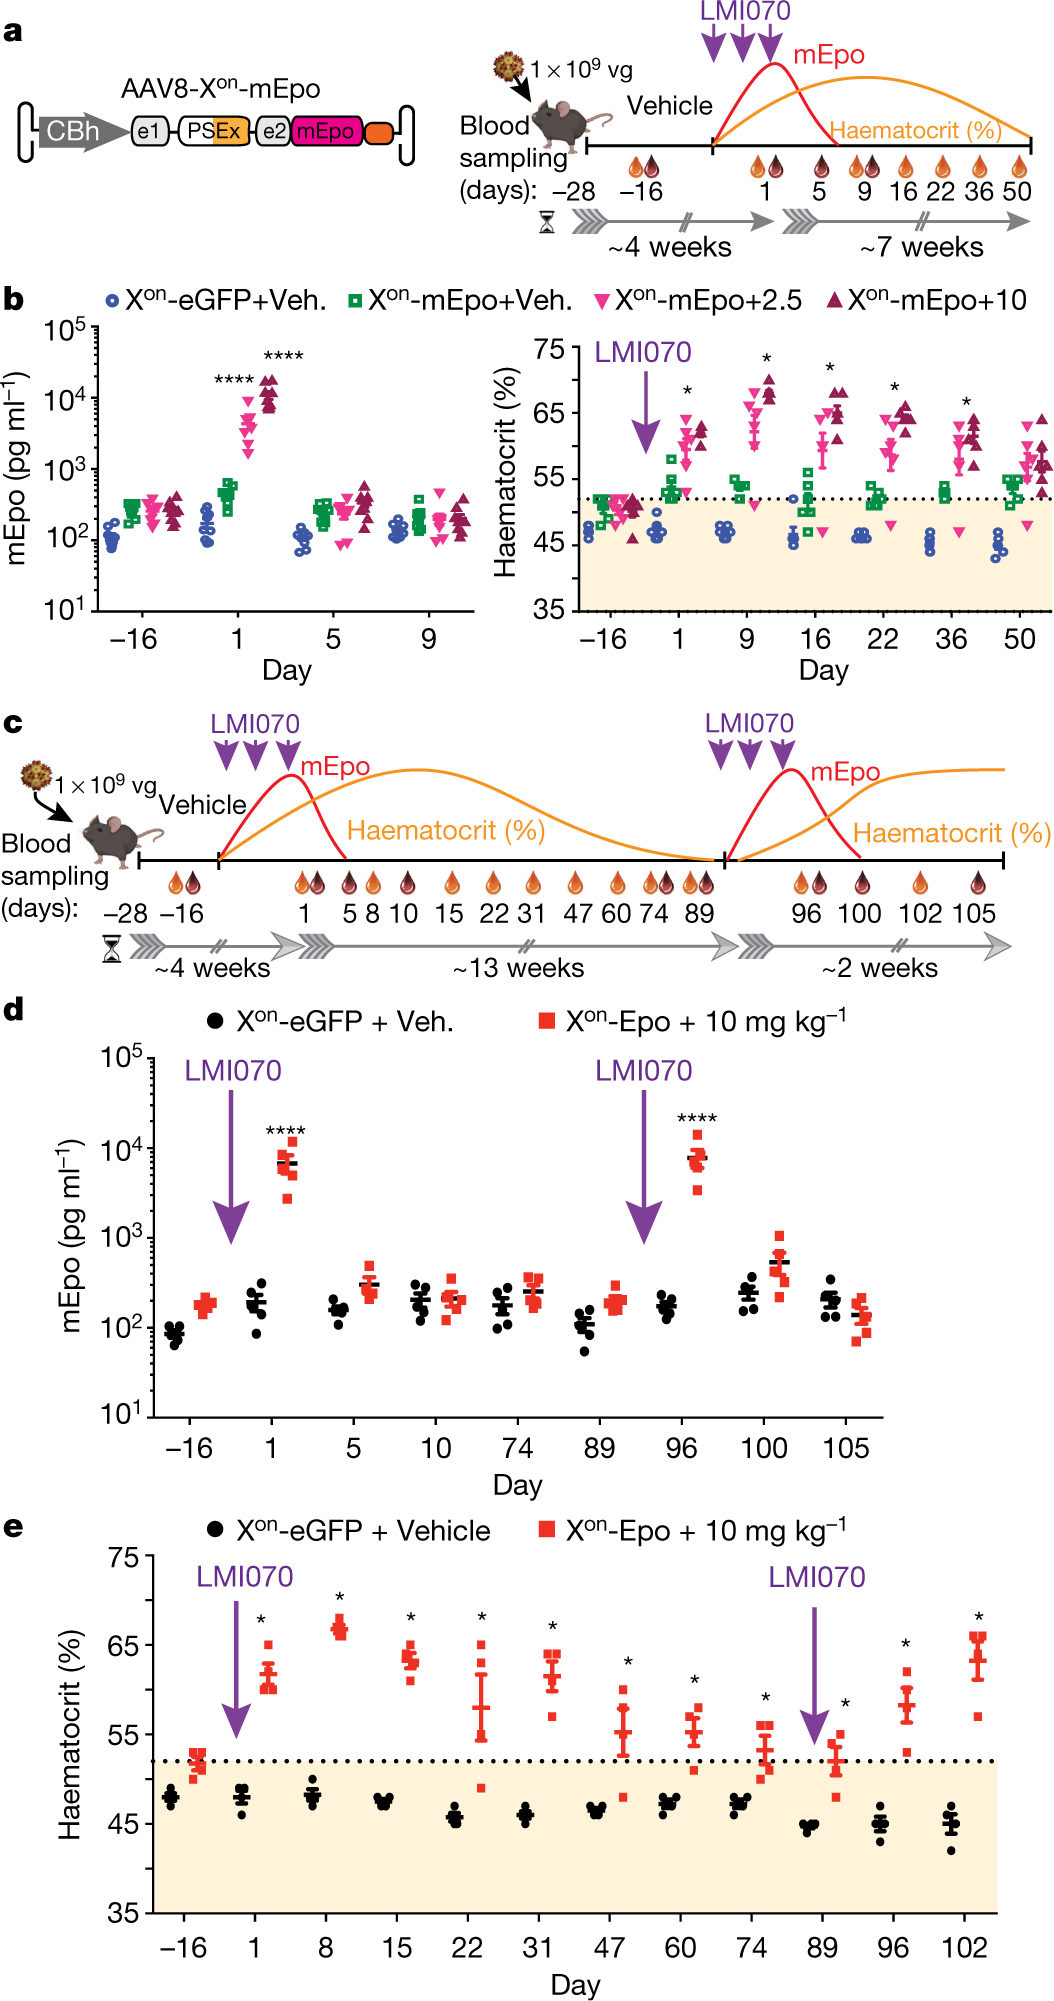
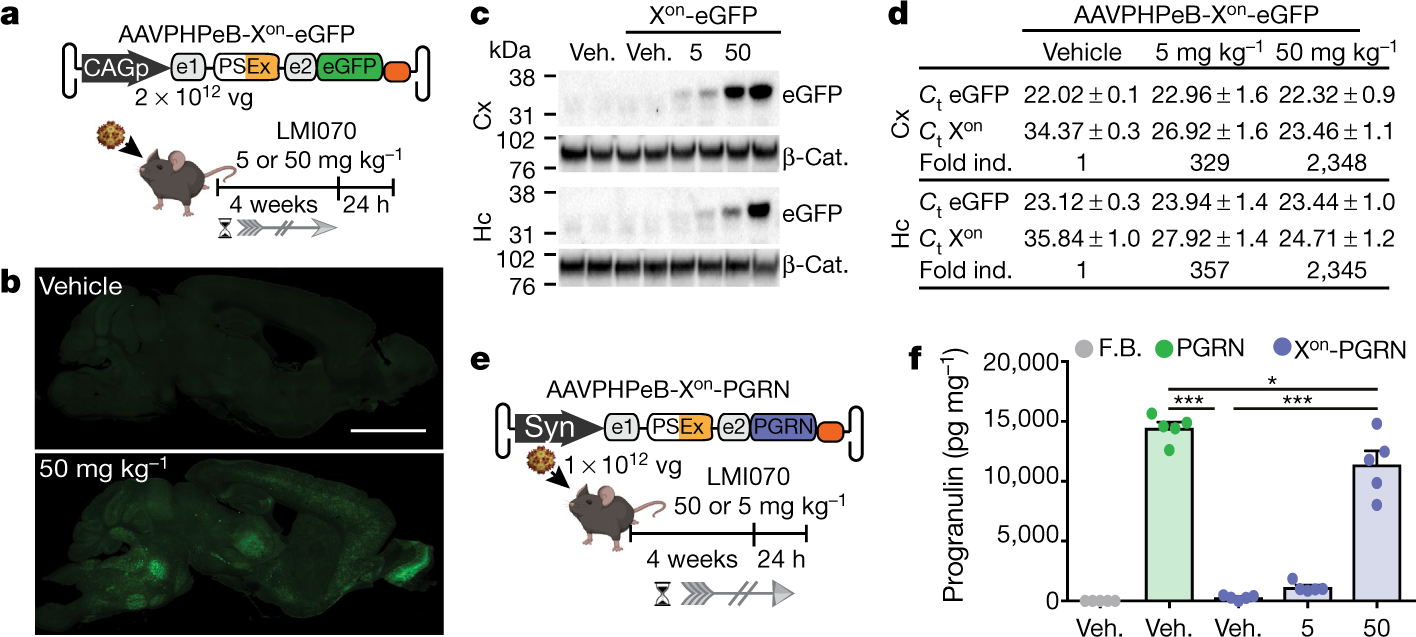
So far, gene therapies have relied on complex constructs that cannot be finely controlled1,2. Here we report a universal switch element that enables precise control of gene replacement or gene editing after exposure to a small molecule. The small-molecule inducers are currently in human use, are orally bioavailable when given to animals or humans and can reach both peripheral tissues and the brain. Moreover, the switch system, which we denote Xon, does not require the co-expression of any regulatory proteins. Using Xon, the translation of the desired elements for controlled gene replacement or gene editing machinery occurs after a single oral dose of the inducer, and the robustness of expression can be controlled by the drug dose, protein stability and redosing. The ability of Xon to provide temporal control of protein expression can be adapted for cell-biology applications and animal studies. Additionally, owing to the oral bioavailability and safety of the drugs used, the Xon switch system provides an unprecedented opportunity to refine and tailor the application of gene therapies in humans.


Conflict of interest statement

Competing interests B.L.D. serves on the advisory boards and/or has sponsored research from Homology Medicines, Intellia Therapeutics, Spirovant Sciences, Resilience Bio, Patch Bio, Saliogen, Moment Bio, Triplet Biosciences, Panorama Medicines, Roche and NBIR. A.M.M. has sponsored research from NBIR.

Figures

Extended Data Fig. 1 |
Extended Data Fig. 1 |. In vitro assessment of SMN2-on cassettes.
a, Cartoon depicting SMN2 exon 7 in its native sequence or with splice-site modifications introduced to reduce background levels of exon 7 inclusion (3′ acceptor splice site, indSMN2). b, Representative RT–PCR reaction showing exon 7 inclusion with the SMN2-on cassettes in the absence of LMI070. The quantification of the exon 7 spliced-in or -out transcripts is depicted as the mean ± s.e.m. of 6 biological replicates. c, Exon 7 splicing of the SMN2 and indSMN2 cassette in response to LMI070 or RG7800. Representative RT–PCR reaction showing exon 7 inclusion as a function of LMI070 or RG7800 dose. The quantification of the exon 7 spliced-in or spliced-out transcripts are the relative transcript levels presented as the mean ± s.e.m. of 8 biological replicates. d, Luciferase activity of the SMN2 and indSMN2 cassettes in response to LMI070. The graph shows relative expression of firefly luciferase expressed from the SMN2-on or indSMN2-on cassettes in cells treated with DMSO or LMI070 (100 nM). The activity of the transfection control Renilla luciferase cassette is represented as a line above the bar graph. Data are the mean ± s.e.m. of 8 biological replicates.
Extended Data Fig. 2 |
Extended Data Fig. 2 |. Comparison between induced splice junctions in a previous study and in this work.
See ref. . a, Sequence logo of U1 RNA site targeted by LMI070 from 45 spliced-in exons identified by RNA-seq. b, To identify splice junctions with the highest induction across both studies we plotted the mean splice junction counts from our study against the mean splice junction counts from the dataset in ref. reprocessed using our pipeline. The datasets correlate with Pearson’s r = 0.7, indicating that induced junctions performed similarly by rank across both datasets. Additionally, the top ranked splice junctions associated with SF3B3 and BECN1 were consistent across both datasets. c, Sashimi plots depicting novel LMI070-spliced in exons for the SF3B3 and BECN1 genes identified in our study and in ref. by RNA-seq. Genomic location, position of the LMI070 spliced in exon, and intronic counts observed are indicated.
Extended Data Fig. 3 |
Extended Data Fig. 3 |. Candidate minigene cassette responsiveness to LMI070 and splicing response to LMI070 of the SF3B3-Xon cassette.
a, Luciferase induction of the minigene cassettes for SF3B3, BECN1, C12ORF4 and PDXDC2. The fold-change luciferase activity in LMI070-treated samples (depicted as +) is relative to DMSO-treated (depicted as −) cells, with data normalized to Renilla luciferase expression. Data are the mean ± s.e.m. of 8 biological replicates. ****P < 0.0001 for SF3B3 versus other candidate exons, ***P < 0.001 C12orf4 versus PDXDC2, one-way ANOVA with Bonferroni’s post hoc test. b, Luciferase activity of the minigene cassettes for SF3B3, BECN1, C12ORF4 and PDXDC2. Data show expression of firefly luciferase from the minigenes in response to DMSO (−) or LMI070 (+) treatment relative to Renilla luciferase activity. Data are mean ± s.e.m. of 8 biological replicates. c, Splicing analysis of the SF3B3-Xon cassette. Representative RT–PCR splicing assay (6 biological replicates) showing inclusion of the LMI070-induced SF3B3 exon in response to DMSO or LMI070 treatment. Inclusion of the LMI070 spliced-in exon was detected using primers binding the exons flanking the LMI070-induced exon (left), or using primers binding within the novel exon sequence (right).
Extended Data Fig. 4 |
Extended Data Fig. 4 |. Depiction of the frequency that non-AUG start codons are used determined by ribosome profiling.
a, Translation frequency from AUG and non-AUG start codons determined from ribosome profiling. b, Depiction of non-AUG start codons in frame luciferase transcripts expressed under control of the SF3B3, BECN1, C12orf4 or PDXDC2 minigenes.
Extended Data Fig. 5 |
Extended Data Fig. 5 |. Analysis of SF3B3-Xon expressed from different promoters.
a, Firefly luciferase of the Xon cassettes in response to varying doses of LMI070 relative to Renilla luciferase (grey line). The data are the mean ± s.e.m. of 8 biological replicates. b, Representative RT−PCR for assessment of LMI070-induced pseudo exon expression. Exon inclusion in the Xon cassette was detected using primers flanking the pseudo exon. Data are the mean ± s.e.m. of 8 biological replicates. c, Representative gels from RT−PCR analysis for assessment of the LMI070-induced pseudo exons expressed from the noted promoters in response to varying doses of LMI070. Pseudo exon inclusion was detected using primers binding within the LMI070-induced pseudo exon and the downstream exon. Splicing was quantified and transcript levels presented as the mean ± s.e.m. of 8 biological replicates.
Extended Data Fig. 6 |
Extended Data Fig. 6 |. Assessment of the SF3B3-Xon cassette to control translation of eGFP in vitro and in vivo.
a, eGFP expression in HEK293 cells transfected with the SF3B3 minigene cassette (SF3B3-Xon-eGFP) and treated 24 h later with DMSO (left) or LMI070 (right). Bright-field panels are shown below (4 technical replicates). b, Representative photomicrograph of heart tissue sections showing eGFP in heart 24 h after treatment with LMI070 at 50 mg kg−1 (n = 2 mice). Scale bar, 200 μm. Inset, eGFP expression in cardiomyocytes at a higher magnification. Scale bar, 50 μm. c, Extended exposure of the western blot from Fig. 2c (4 mice per group). d, PCR assay demonstrates splicing activity in liver, heart and skeletal muscle in response to LMI070 (4 mice per group). e, Cartoon depiction of the Xon assays designed to quantify the LMI070-induced transcripts and eGFP expression levels from the Xon cassette after AAV9-Xon-eGFP gene transfer. f, Data show average Ct values for eGFP or LMI070-induced expression in heart and skeletal muscle. Fold change of the spliced-in expression cassette is shown relative to basal levels in mice injected with AAV9-Xon-eGFP and treated with vehicle (4 mice per group). g, Extended exposure of the western blot from Fig. 2h (3 mice per group). h, PCR assay demonstrates splicing activity in liver, heart and skeletal muscle after each LMI070 dose (3 mice per group). i, Data show average Ct values for eGFP or LMI070-induced expression in heart and skeletal muscle after each dose. Fold change of the spliced expression cassette is shown relative to basal levels in mice injected with AAV9-Xon-eGFP and treated with vehicle (3 mice per group).
Extended Data Fig. 7 |
Extended Data Fig. 7 |. In vivo activity of Xon in brain.
a, Representative photomicrographs (5 mice per group) showing eGFP expression from mice treated intravenously 4 weeks earlier with AAVPHPeB-Xon-eGFP, and 24 h after treatment with vehicle or LMI070 at 5 or 50 mg kg−1. Thalamus (Th), hippocampus (Hc), cerebellum (Cb) and facial motor nucleus (VII), cortex (Cx), striatum (Str), substantia nigra (SN), and medial vestibular nucleus (MV) are shown. Scale bar, 100 μm; inset scale bar, 25 μm. In the hippocampus, * and ** denote the polymorphic and CA3 areas, respectively. In the cerebellum, * denotes the deep cerebellar nuclei. b, Splicing assays for exon inclusion in the cortex and the hippocampus of mice injected with AAVPHPeB-Xon-eGFP (3 mice per group). c, RT–qPCR of human progranulin expression. Data are mean ± s.e.m. of 5 mice per group, ****P < 0.0001 vehicle versus AAV-treated groups, one-way ANOVA followed by Bonferroni’s post-hoc test. d, Splicing assays for exon inclusion in cortex samples of mice injected with AAVPHPeB-Xon-PGRN (3 mice per group).
Extended Data Fig. 8 |
Extended Data Fig. 8 |. Generation of the miniXon cassette and assessment of miniXon control of SaCas9 for in vivo gene editing in liver.
a, Cartoon depicting the AAV genome size with the SF3B3-Xon and SF3B3-miniXon cassettes. b, Luciferase induction in HEK293 cells transfected with SF3B3-miniXon-luciferase or SF3B3-Xon-luciferase in response to varying doses of LMI070. All samples are normalized to Renilla luciferase activity and are relative to DMSO treated cells. Data are the mean ± s.e.m. of 8 biological replicates (***P < 0.001 versus SF3B3.Xon, two-way ANOVA followed by Bonferroni’s post hoc test). c, Splicing inclusion assays of the LMI070-induced exon at 100 nM LMI070. Pseudo exon inclusion in the Xon cassette was detected using primers flanking the pseudoexon (left) or by priming within the novel exon sequence (right; 4 technical replicates). d, Experimental design. Mice were injected with AAV8-miniXon-SaCas9 plus AAV8-sgAi14-eGFP (1 × 10¹² viral genomes, 1:1 ratio) and 2 weeks later dosed with vehicle or LMI070 at 50 mg kg−1 to induce SaCas9 expression and editing of the loxP-STOP cassette (guides: sgA14_1: 5′-CTCTAGAGTCGCAGATCCTC-3′, sgAi14_2: 5′-ACGAAGTTATATTAAGGGTT-3′). One week later, mice were euthanized, and livers processed to assess gene editing by genomic DNA PCR, histology and FACS of isolated hepatocytes. e, Representative FACS analysis of hepatocytes obtained from Ai14 mice after LMI070 or vehicle treatment. The gating/sorting strategy (above), and the percentage of tdTomato expressing cells for each condition (below) is shown (4 biological replicates). f, Representative photomicrographs of liver sections obtained from AAV injected Ai14 mice 1-week after LMI070 treatment. tdTomato expression (red) is evident in LMI070 treated mice (5 mice per group). Scale bars, 100 μm. g, SaCas9 mediated editing of the loxP-STOP cassette in Ai14 mice as detected by PCR assay of liver genomic DNA (3 of 5 mice with guides plus LMI, 2 of 4 mice with guides plus vehicle, 1 of 2 untreated mice are shown). A PCR product of 355 bp size corresponding to the edited Ai14 ROSA Locus was observed in the LMI070-treated mice. h, Sanger sequencing of the 355 bp PCR product confirmed targeted deletion of the loxP-STOP cassette and DNA repair of the Ai14 reporter locus.
Fig. 1 |
Fig. 1 |. Generation and testing of Xon.
a, Schematic depicting the SMN2-on cassette. In the absence of exon 7 (e7), a premature stop codon blocks translation of the gene of interest (GOI). Inclusion of e7 permits translation. b, Change in firefly (FF) luciferase activity in LMI070-treated (100 nM) compared with DMSO-treated cells, normalized to Renilla (Ren) luciferase activity. RLU, relative light units. Data are mean ± s.e.m. of 8 biological replicates, ****P < 0.0001 SMN2 versus indSMN2, two-way ANOVA, Bonferroni’s post-hoc test. c, SF3B3 splicing without (red; control (Ctl)) or with (blue) 25 nM LMI070 treatment. The genomic location of the LMI070 spliced-in SF3B3 exon (green bar) and intron counts are indicated. d, cDNAs for SF3B3, BECN1, GXYLT1, C12orf4 and PDXDC2 amplified from cells treated with DMSO or LMI070 (25 nM) (one representative plot from 4 RNA-seq samples). Novel splicing was confirmed by Sanger sequencing. The asterisks represent non-specific bands. e, Volcano plot illustrating differentially expressed genes between DMSO-treated and LMI070- treated cells. The red horizontal bar represents 0.05 significance on a −log10 scale. The red vertical bars indicate thresholds of −0.1 and 0.1 fold change. Genes meeting the significance and minimum fold-change thresholds are labelled (4 samples per group). f, Candidate minigenes for translation control; e1 and e2 are the flanking exons of the novel SF3B3 exon (Extended Data Tables 1, 2). g, Induction of luciferase activity in cells transfected with the SF3B3-based Xon cassette. Samples are normalized to Renilla luciferase and are relative to DMSO. Data are mean ± s.e.m. of 8 biological replicates, **P < 0.01 mCMV versus RSV or PGK; **P < 0.01 RSV versus PGK, two-way ANOVA followed by Bonferroni’s post hoc test.
Fig. 2 |
Fig. 2 |. Activity of Xon in liver.
a, Schematic of experiments using AAV9-Xon-eGFP. Mice were injected intravenously with AAV9-Xon-eGFP, after 4 weeks they were orally dosed once with LMI070, and tissues were collected 24 h later to assess mRNA (Extended Data Fig. 6) and protein expression. vg, viral genomes. b, Representative photomicrograph showing eGFP in the liver 24 h after dosing. n = 3 mice per group. Scale bar, 100 μm. c, Representative eGFP western blot with β-catenin (β-Cat.) as the loading control. n = 4 mice per group. Form. buffer, vector formulation buffer; Veh., vehicle. d, Average (mean ± s.e.m.) cycle threshold (Ct) values for eGFP or LMI070-induced expression using TaqMan assays (Extended Data Fig. 6e). The fold change stated for the spliced product is relative to vehicle-treated, AAV9-Xon-eGFP injected mice. n = 4 mice per group. e, Schematic of the re-dosing experiment. Mice were injected intravenously and 4 weeks later were dosed with LMI070 or vehicle. LMI070-treated mice were subjected to drug washout for one week and then redosed with drug or vehicle (n = 5 mice per group). Tissues were collected 24 h after each dose. f, Representative photomicrograph of the liver showing eGFP 24 h after each dose. n = 2 mice per group. Scale bar, 100 μm. g, Representative eGFP western blot 24 h after dosing, with β-catenin as loading control. n = 3 mice per group. h, Average (mean ± s.e.m.) Ct values for eGFP and fold change relative to AAV9-Xon-eGFP-injected mice treated with vehicle (n = 3 mice per group).
Fig. 3 |
Fig. 3 |. Drug-induced regulation of Epo.
a, Experimental design for mEpo induction and the effect on haematocrit levels. Three weeks after AAV or buffer delivery, mice were dosed with vehicle or LMI070 at 2.5 or 10 mg kg−1 every other day for a total of 3 doses. Blood was collected for mEpo (red drop) and haematocrit (orange drop) assays as indicated. b, Left, mEpo levels 2 weeks after AAV injection, and 1, 5 and 9 days after the last dose. ****P < 0.0001, LMI070-treated versus vehicle-treated mice; ****P < 0.0001, 10 versus 2.5 mg kg−1 LMI070-treated mice. Right, haematocrit levels two weeks after AAV injection, and for 50 days after dosing. The orange shaded area shows the haematocrit range of wild-type mice. *P < 0.05 mEpo injected, LMI070-treated mice versus vehicle. c, Schematic of the re-inducibility experiment. Xon-mEpo-AAVs were delivered intravenously and mice given vehicle or LMI070 orally every other day for a total of 3 doses. After haematocrit returned to baseline levels, LMI070 was re-administered and mice were monitored as before. d, mEpo levels from 2 weeks after AAV delivery. ****P < 0.0001 AAV-Xon-mEpo-injected, LMI070-treated mice versus AAV-eGFP-injected mice. e, Haematocrit levels assessed over the time course of the experiment. *P < 0.05 mEpo-injected mice treated with LMI070 versus eGFP-injected mice. Data are mean ± s.e.m. of 9, 6 (b), 5 (d) or 4 (e) mice per group, significance was determined by two-way ANOVA followed by Bonferroni’s post hoc test.
Fig. 4 |
Fig. 4 |. In vivo activity of Xon in the brain.
a, Schematic of the AAVPHPeB-Xon-eGFP experiment. AAVs were injected intravenously, then after 4 weeks mice were given an oral dose of LMI070, and brains were collected 24 h later to assess splicing (Extended Data Fig. 7b), transcript levels and protein expression. b, Representative compiled photomicrographs (5 mice per group) from 40-μm-thick sagittal sections. Scale bar, 3 mm. c, Representative eGFP western blots of the cortex (Cx) and the hippocampus (Hc), with β-catenin as the loading control. n = 3 mice per group. d, Average (mean ± s.e.m.) Ct values for eGFP and fold change relative to AAV-Xon-eGFP-injected mice treated with vehicle. e, Schematic depicting the assessment of AAV-Xon-PGRN for regulation of progranulin expression in the brain. Vectors were administered intravenously, then after 4 weeks mice were treated with a single oral dose of LMI070 or vehicle, and tissues were collected 24 h later. f, Progranulin protein levels in the cortex. Data are mean ± s.e.m. of 5 mice per group. ***P < 0.001 for AAV-PGRN or AAV-Xon-PGRN + 50 mg kg−1 versus mice injected with AAV-Xon-PGRN + vehicle, *P < 0.05 for AAV-Xon-PGRN + 50 mg kg−1 versus AAV-PGRN, one-way ANOVA followed by Bonferroni’s post hoc test. F.B., vector formulation buffer.

References

    1. Yen L et al. Exogenous control of mammalian gene expression through modulation of RNA self-cleavage. Nature 431, 471–476 (2004). - PubMed
    1. Dow LE et al. Inducible in vivo genome editing with CRISPR–Cas9. Nat. Biotechnol. 33, 390–394 (2015). - PMC - PubMed
    1. Brown BD, Venneri MA, Zingale A, Sergi Sergi L & Naldini L Endogenous microRNA regulation suppresses transgene expression in hematopoietic lineages and enables stable gene transfer. Nat. Med. 12, 585–591 (2006). - PubMed
    1. Domenger C & Grimm D Next-generation AAV vectors—do not judge a virus (only) by its cover. Hum. Mol. Genet. 28 (R1), R3–R14 (2019). - PubMed
    1. Berget SM, Moore C & Sharp PA Spliced segments at the 5′ terminus of adenovirus 2 late mRNA. Proc. Natl Acad. Sci. USA 74, 3171–3175 (1977). - PMC - PubMed

Publication types

MeSH terms