. 2021 Aug;596(7872):438-443.
doi: 10.1038/s41586-021-03716-8. Epub 2021 Jul 28.

Mechanisms of BRCA1-BARD1 nucleosome recognition and ubiquitylation

Affiliations

Mechanisms of BRCA1-BARD1 nucleosome recognition and ubiquitylation

Qi Hu et al. Nature. 2021 Aug.

Erratum in

Abstract

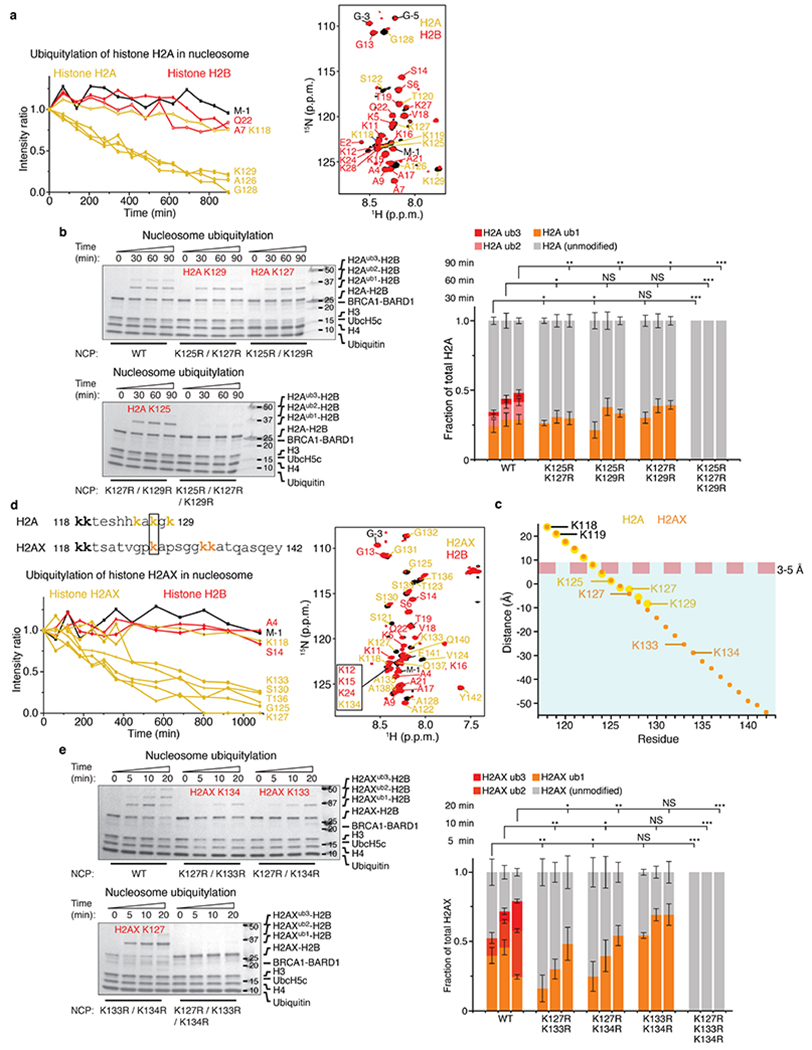
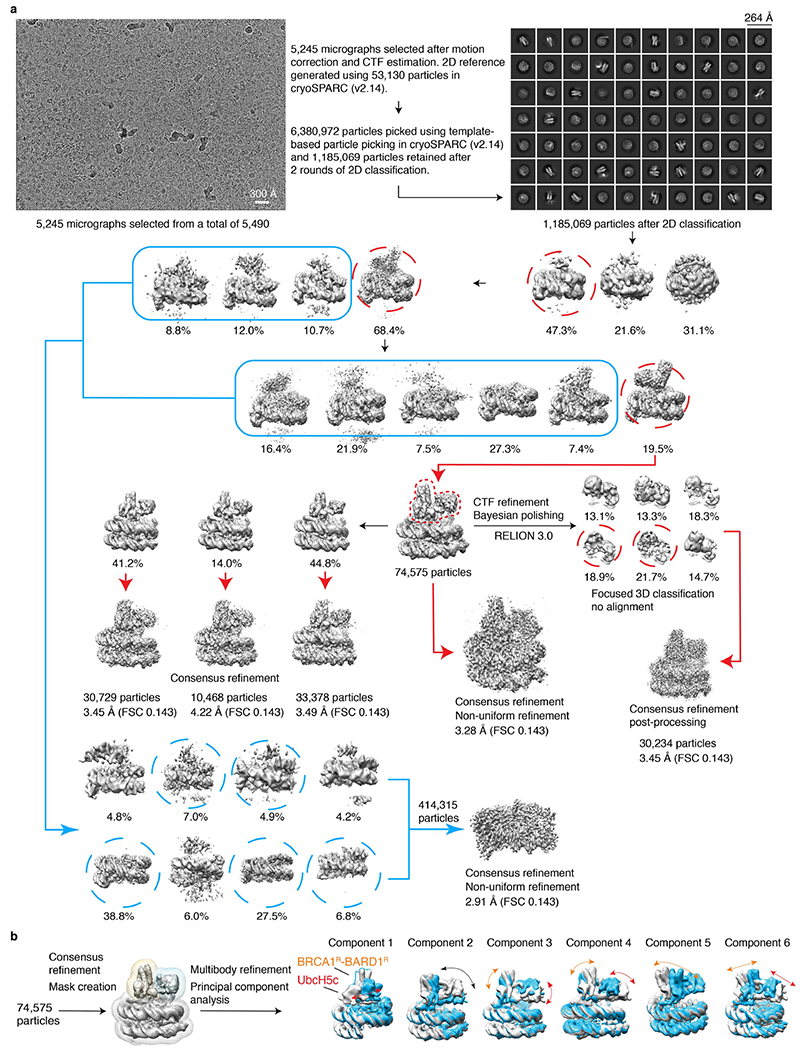
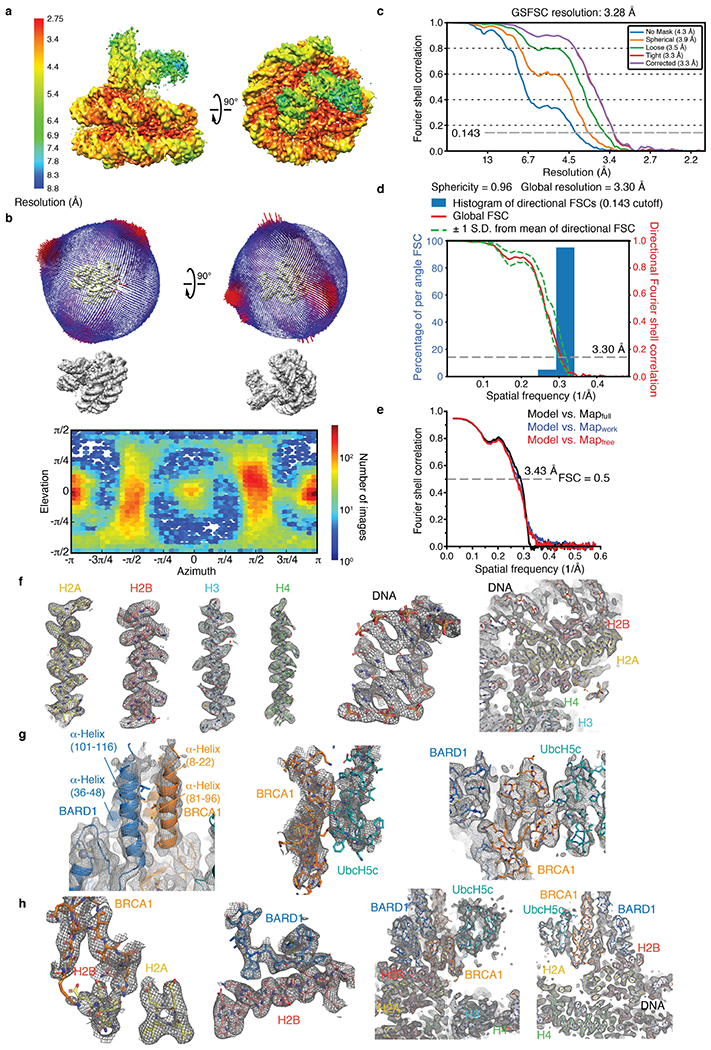
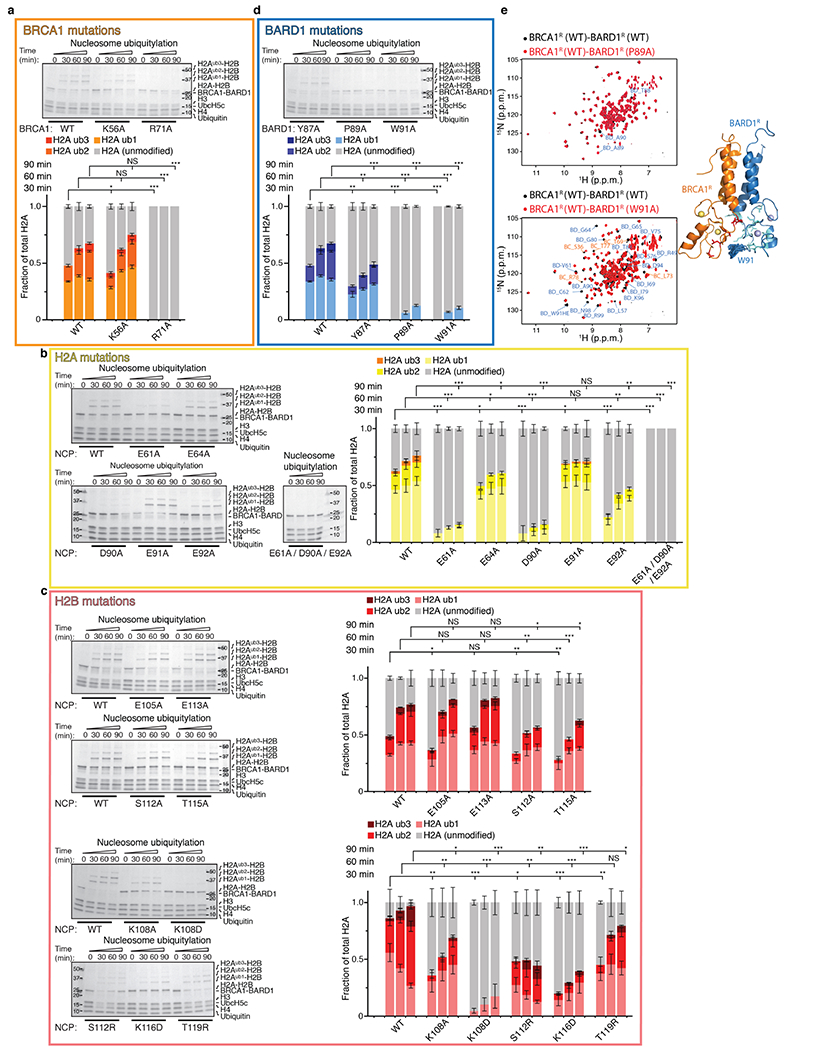
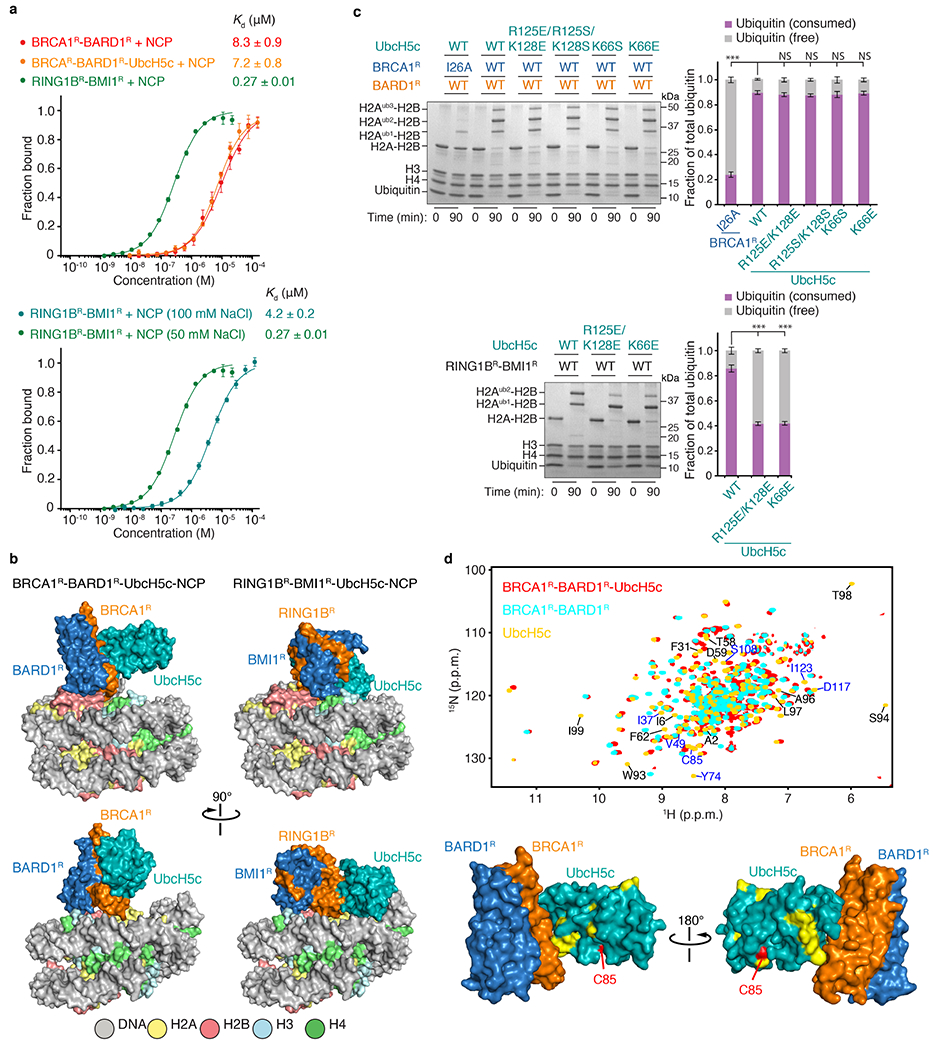
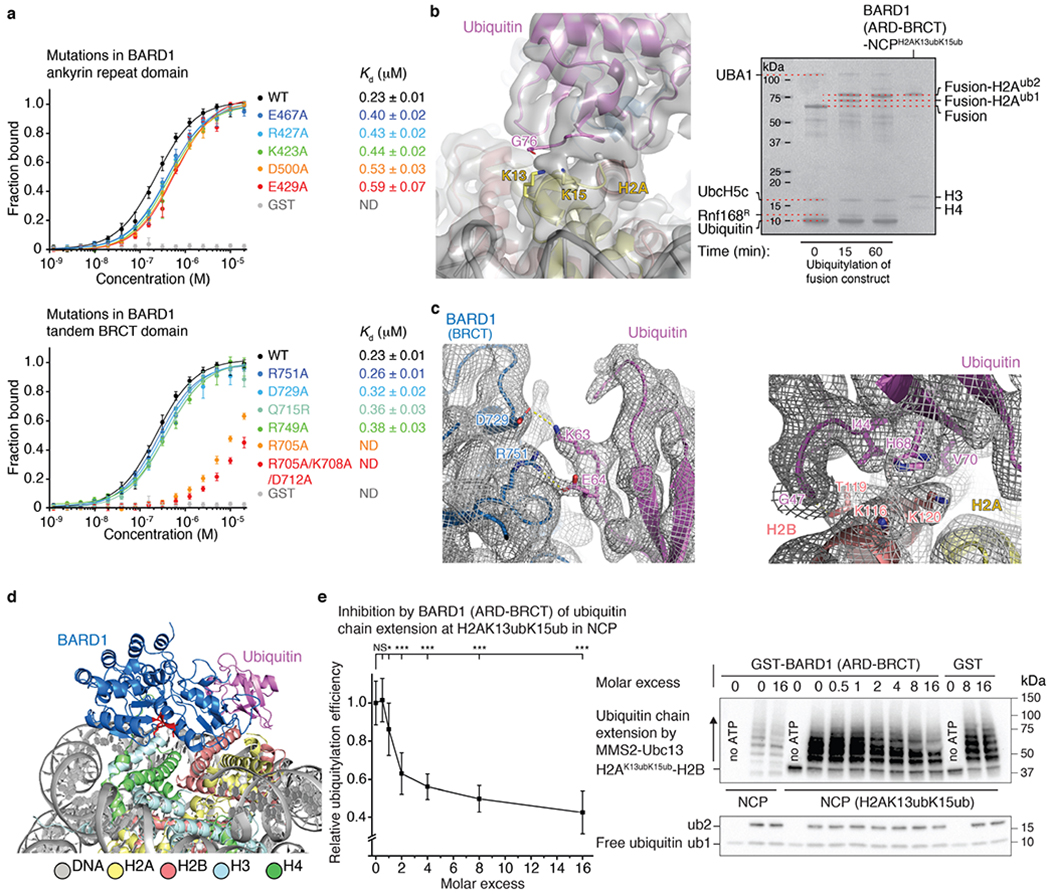
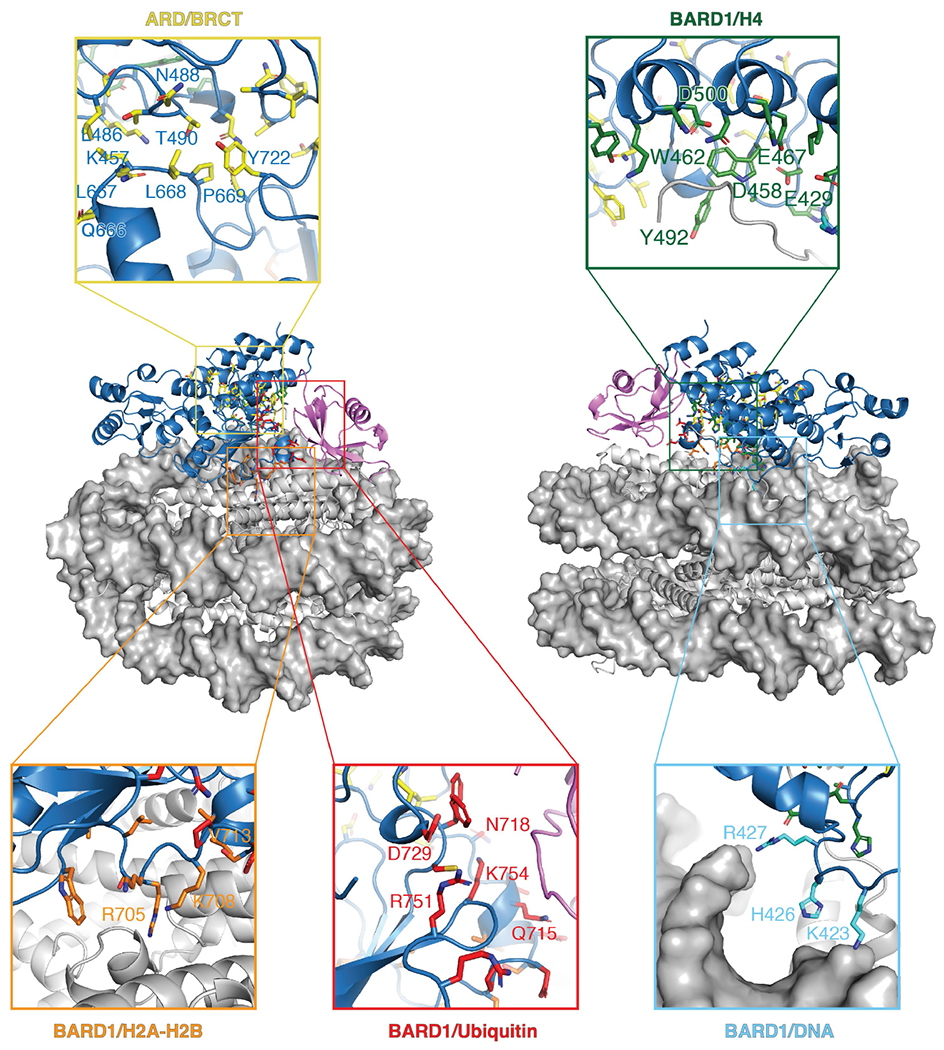
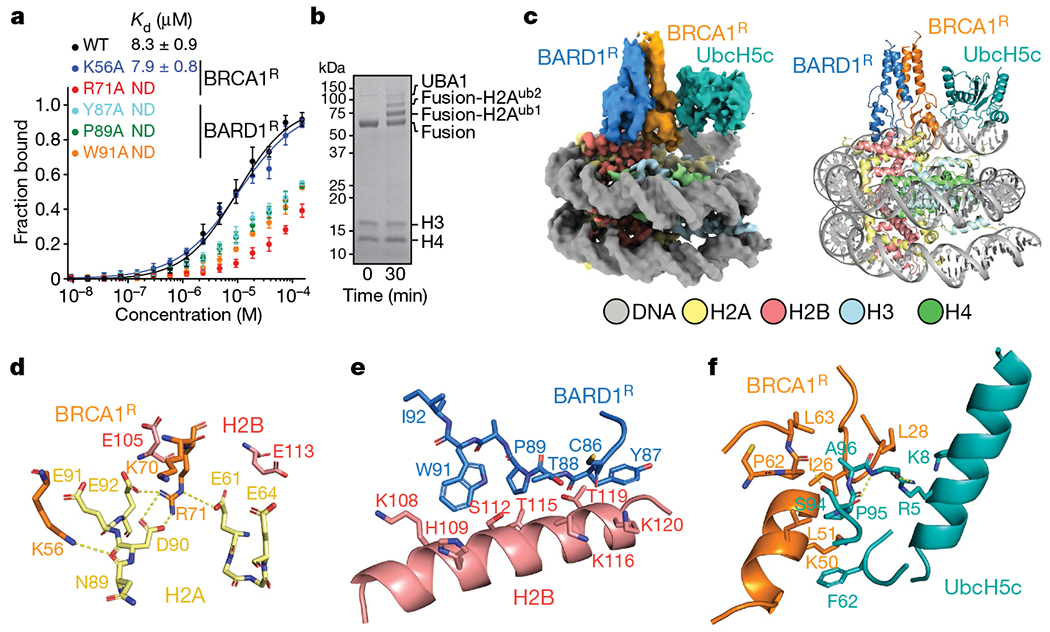
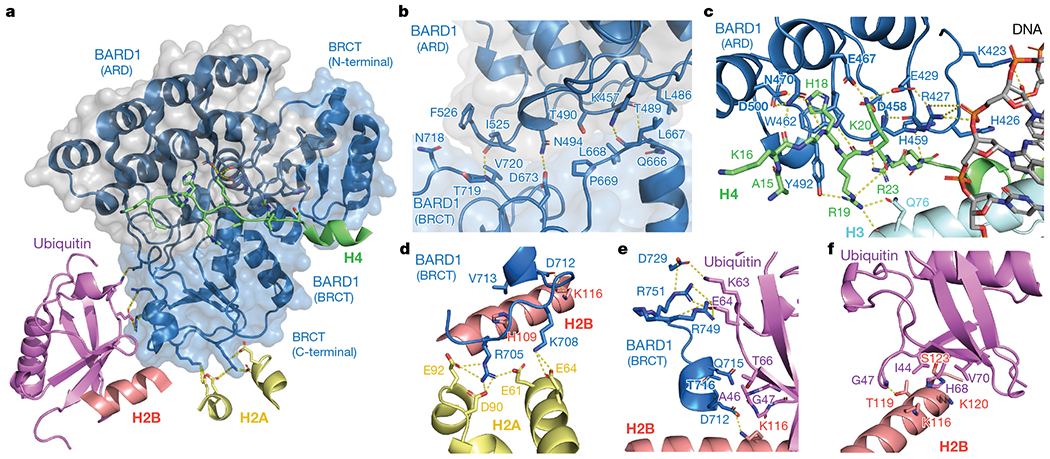
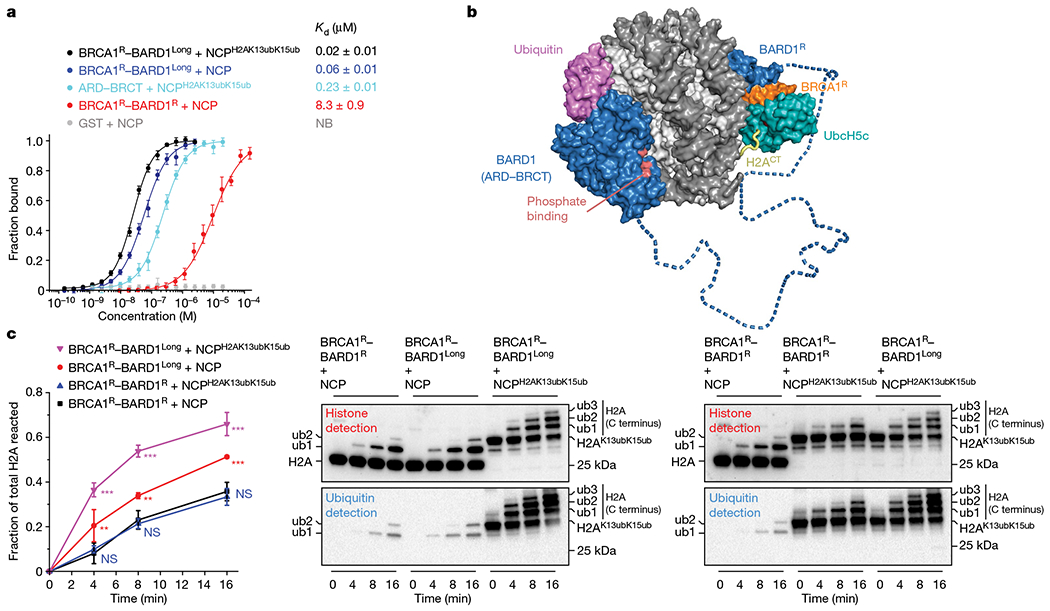
The BRCA1-BARD1 tumour suppressor is an E3 ubiquitin ligase necessary for the repair of DNA double-strand breaks by homologous recombination1-10. The BRCA1-BARD1 complex localizes to damaged chromatin after DNA replication and catalyses the ubiquitylation of histone H2A and other cellular targets11-14. The molecular bases for the recruitment to double-strand breaks and target recognition of BRCA1-BARD1 remain unknown. Here we use cryo-electron microscopy to show that the ankyrin repeat and tandem BRCT domains in BARD1 adopt a compact fold and bind to nucleosomal histones, DNA and monoubiquitin attached to H2A amino-terminal K13 or K15, two signals known to be specific for double-strand breaks15,16. We further show that RING domains17 in BRCA1-BARD1 orient an E2 ubiquitin-conjugating enzyme atop the nucleosome in a dynamic conformation, primed for ubiquitin transfer to the flexible carboxy-terminal tails of H2A and variant H2AX. Our work reveals a regulatory crosstalk in which recognition of monoubiquitin by BRCA1-BARD1 at the N terminus of H2A blocks the formation of polyubiquitin chains and cooperatively promotes ubiquitylation at the C terminus of H2A. These findings elucidate the mechanisms of BRCA1-BARD1 chromatin recruitment and ubiquitylation specificity, highlight key functions of BARD1 in both processes and explain how BRCA1-BARD1 promotes homologous recombination by opposing the DNA repair protein 53BP1 in post-replicative chromatin18-22. These data provide a structural framework to evaluate BARD1 variants and help to identify mutations that drive the development of cancer.


Conflict of interest statement

Competing interests The authors declare no competing interests.

Figures

Extended Data Fig. 1 |
Extended Data Fig. 1 |. Site-specific ubiquitylation of nucleosomal histones H2A and H2AX by BRCA1R-BARD1R and UbcH5c.
a, Left: time-course ubiquitylation of nucleosomal H2A catalysed by BRCA1R-BARD1R-UbcH5c probed using NMR spectroscopy at 25 °C. Changes in signal intensities in the 1H-15N heteronuclear single quantum coherence (HSQC) spectra of the NCP harbouring 15N-labelled H2A-H2B were monitored. Right: overlay of the 1H-15N HSQC spectra before and 1,000 min after the start of the ubiquitylation reaction. Signals from remnant tag residues are labelled in black. b, Left: Coomassie-stained gels as readout of the ubiquitylation of wild-type (WT) NCP and NCPs harbouring double-point and triple-point mutations in H2A as indicated, using BRCA1R-BARD1R and UbcH5c. The lysine residues being monoubiquitylated are indicated in red. Right: quantification of the NCP ubiquitylation from n = 3 independent experiments. Bar graphs show the mean and s.d. for each data point. P values were calculated using a two-sample, two-tailed Student t-test; *P < 0.05, **P < 0.01, ***P < 0.001, NS means not significant. Exact P values are provided in Supplementary Table 1. For gel source data, see Supplementary Fig. 3. c, Estimation by simulation of the conformational space sampled by fluctuating conformations of H2A, H2AX and UbcH5c in BRCA1R-BARD1R-UbcH5c-bound NCP (see Methods). The graph shows the ubiquitylation space accessible to the C-terminal tails of H2A (residues 118–129) and H2AX (residues 118–142). The red dashed line indicates a 3–5 Å distance between the thiol group of the active site cysteine C85 of UbcH5c and an acceptor lysine ε-amino group that allows ubiquitin transfer. The cyan shaded area below this line shows the histone residues accessible for ubiquitylation. A negative distance indicates that the distance between the sulfur atom of C85 and an α-carbon of H2A or H2AX can be short enough to permit ubiquitylation if the corresponding acceptor residue is a lysine. Only H2A and H2AX residues 123–129 and 123–142, respectively, satisfy this condition. Three of these residues are lysines in H2A (K125, K127 and K129) and H2AX (K127, K133 and K134). The conformational variability of UbcH5c was accounted for in these calculations. d, Left: amino acid sequence alignment of H2A and H2AX C-terminal tails and time-course ubiquitylation of nucleosomal H2AX catalysed by BRCA1R-BARD1R-UbcH5c probed using NMR spectroscopy at 25 °C. Changes in signal intensities in the 1H-15N HSQC spectra of the NCP harbouring 15N-labelled H2AX-H2B were monitored. Right: overlay of the 1H-15N HSQC spectra before and 1,000 min after the start of the ubiquitylation reaction. Signals from remnant tag residues are labelled in black. e, Left: Coomassie-stained gels as readout of the ubiquitylation of the NCPs harbouring WT and double-point and triple-point mutations in H2AX as indicated, using BRCA1R-BARD1R and UbcH5c. The lysine residues being monoubiquitylated are indicated in red. Right: quantification of the NCP ubiquitylation from n = 3 independent experiments. Bar graphs show the mean and s.d. for each data point. P values were calculated using a two-sample, two-tailed Student t-test; *P < 0.05, **P < 0.01, ***P < 0.001, NS means not significant. Exact P values are provided in Supplementary Table 1. For gel source data, see Supplementary Fig. 3.
Extended Data Fig. 2 |
Extended Data Fig. 2 |. Processing of cryo-EM data for the BRCA1R-BARD1R-UbcH5c-nucleosome complex.
a, Flow chart showing the stages of cryo-EM image processing. A total of 5,490 micrographs was collected on a Titan Krios 300 kV microscope and subjected to beam-induced motion correction. Data processing was done using cryoSPARC (v2.14) and RELION 3.0. The reconstruction of BRCA1R-BARD1R-UbcH5c-NCP with the highest resolution was selected for building an atomic model. Cryo-EM density reconstruction for the apo NCP (particles with no detectable density for BRCA1R-BARD1R-UbcH5c) was also carried out and is schematized by blue arrows. After 3D models were built, the r.m.s.d. over all NCP backbone atoms between the apo and complex states is 0.29 Å, not including the histone tails, which are not detected in the two densities. b, Multibody refinement and conformational dynamics analysis of BRCA1R-BARD1R-UbcH5c-NCP using RELION 3.1. Six principal components were used to describe motions among three rigid bodies corresponding to BRCA1R-BARD1R, UbcH5c and the NCP, with the two extreme conformations for each rigid body displayed in grey and blue. Rigid body movements of BRCA1R-BARD1R, UbcH5c and BRCA1R-BARD1R-UbcH5c as a whole are indicated by orange, red and black curved arrows, respectively.
Extended Data Fig. 3 |
Extended Data Fig. 3 |. Validation of EM data and sample cryo-EM density for the BRCA1R-BARD1R-UbcH5c-nucleosome complex.
a, Local resolution distribution displayed on the reconstructed cryo-EM density map of the BRCA1R-BARD1R-UbcH5c-nucleosome complex. b, Top: Euler angle distribution generated using RELION 3.0 for the particles used in the final reconstruction. Each bar has a height and colour indicative of the number of particles (increasing from blue to red) in a defined orientation. Bottom: particle angular distribution heatmap generated using cryoSPARC (v2.14). c, Gold-standard Fourier shell correlation (GSFSC) curves for the final refinement in cryoSPARC (v2.14). Non-uniform refinement led to a 3.28 Å resolution map. d, Quantification of directional resolution anisotropy using a 3D Fourier shell correlation (3DFSC) algorithm in the 3DFSC server. e, Fourier shell correlation (FSC) curves between model-calculated density and the final cryo-EM density map generated using PHENIX. Resolution at FSC 0.5 is indicated. f, Representative regions of the cryo-EM density map for the nucleosome components (histones and DNA) of the complex. g, Representative regions of the cryo-EM density map for the BRCA1R, BARD1R and UbcH5c interfaces. The four-helix bundle of BRCA1R-BARD1R is highlighted on the left. h, Representative regions of the cryo-EM density map for the interfaces involving BRCA1R and BARD1R interactions with the nucleosome. The first and second representations from the left highlight BRCA1R interaction with the nucleosome acidic patch and BARD1R interaction with H2B, respectively.
Extended Data Fig. 4 |
Extended Data Fig. 4 |. Effects of structure-based mutations in BRCA1R, BARD1R and nucleosomal histone proteins H2A and H2B on ubiquitin conjugation to H2A.
a, Top: representative Coomassie-stained gel of time-course ubiquitylation assays of the NCP using UbcH5c and BRCA1R-BARD1R, wild type (WT) and with indicated mutations in BRCA1R. Bottom: quantification of the NCP ubiquitylation from n = 3 independent experiments. Bar graphs show the mean and s.d. for each data point. P values were calculated using a two-sample, two-tailed Student t-test; *P < 0.05, **P < 0.01, ***P < 0.001, NS means not significant. Exact P values are provided in Supplementary Table 1. For gel source data, see Supplementary Fig. 4. b, Left: representative Coomassie-stained gels of time-course ubiquitylation assays of WT and indicated H2A mutant NCPs by WT BRCA1R-BARD1R and UbcH5c. Right: quantification of the NCP ubiquitylation from n = 3 independent experiments. Bar graphs show the mean and s.d. for each data point. P values were calculated using a two-sample, two-tailed Student t-test; *P < 0.05, **P < 0.01, ***P < 0.001, NS means not significant. Exact P values are provided in Supplementary Table 1. For gel source data, see Supplementary Fig. 4. c, Similar to b but using WT and indicated H2B mutations in the NCP. Exact P values are provided in Supplementary Table 1. For gel source data, see Supplementary Fig. 4. d, Top: representative Coomassie-stained gel of time-course ubiquitylation assays of the NCP using UbcH5c and BRCA1R-BARD1R, with the indicated mutations in BARD1R. The ubiquitylation assay carried out with WT BRCA1R-BARD1R is shown in a. Bottom: quantification of the NCP ubiquitylation from n = 3 independent experiments. Bar graphs show the mean and s.d. for each data point. P values were calculated using a two-sample, two-tailed Student t-test; *P < 0.05, **P < 0.01, ***P < 0.001, NS means not significant. Exact P values are provided in Supplementary Table 1. For gel source data, see Supplementary Fig. 4. e, Overlays of 1H-15N HSQC NMR spectra of WT BRCA1R-BARD1R versus BRCA1R-BARD1R harbouring the BARD1R P89A or W91A mutation. BRCA1R and BARD1R signals for which there was a change in chemical shift are labelled with BC and BD prefixes, respectively. The spectra demonstrate that the mutant proteins are well folded. The changes in chemical shifts for the W91A mutant map to residues close in space to the mutation site and can be attributed to altered ring current effect. These affected residues are coloured red and cyan on the NMR structure of BRCA1R-BARD1R. The multiple side-chain conformations of W91 in the NMR ensemble are displayed.
Extended Data Fig. 5 |
Extended Data Fig. 5 |. Structural and functional comparison of BRCA1R-BARD1R-UbcH5c and RING1BR-BMI1R-UbcH5c in association with the nucleosome and dynamics of the BRCA1R-UbcH5c interaction.
a, Top: fluorescence polarization nucleosome-binding curves showing that BRCA1R-BARD1R and BRCA1R-BARD1R-UbcH5c bind to the NCP with similar affinities, lower than the affinity of RING1BR-BMI1R for the NCP. Data are mean and s.d. for each data point (n = 3 independent experiments). Kd values are indicated. Bottom: control binding curves for the RING1BR-BMI1R-NCP interaction at two salt concentrations. While our experiments were done with 50 mM NaCl, previously published experiments probing the RING1BR-BMI1R-NCP interaction were done with 100 mM NaCl. The higher RING1BR-BMI1R-NCP Kd that we obtained at 100 mM NaCl is similar to published data. b, Surface representations of the 3D structures of BRCA1R-BARD1R-UbcH5c-NCP and RING1BR-BMI1R-UbcH5c-NCP shown side-by-side with identical orientations of the NCP to highlight the radically different positioning of UbcH5c relative to the NCP in the two complexes. c, Left: representative Coomassie-stained gels of ubiquitylation assays of the NCP by UbcH5c and BRCA1R-BARD1R or RING1BR-BMI1R using wild-type (WT) proteins and the indicated UbcH5c and BRCA1R mutants. Right: quantification of the NCP ubiquitylation from n = 3 independent experiments. Bar graphs show the mean and s.d. for each data point. P values were calculated using a two-sample, two-tailed Student t-test; *P < 0.05, **P < 0.01, ***P < 0.001, NS means not significant. Exact P values are provided in Supplementary Table 1. For gel source data, see Supplementary Fig. 5. d, Top: overlay of the 1H-15N NMR HSQC spectra of BRCA1R-BARD1R-UbcH5c (red), BRCA1R-BARD1R (cyan) and UbcH5c (gold) highlighting 12 residues (black labels) near the BRCA1R-UbcH5c interface for which NMR signals disappear or become very weak due to exchange broadening upon formation of the BRCA1R-BARD1R-UbcH5c complex, consistent with motions on the microsecond-to-millisecond timescale. The signals of seven other UbcH5c residues (blue labels), distant from the interface with BRCA1R, are also exchange broadened because of allosteric effects as previously noted for other UbcH5c and related complexes,. Bottom: surface representation of the BRCA1R-BARD1R-UbcH5c complex. The regions for which NMR signals disappear due to exchange broadening upon formation of the BRCA1R-BARD1R-UbcH5c complex are highlighted in yellow. The active site C85 of UbcH5c is shown in red.
Extended Data Fig. 6 |
Extended Data Fig. 6 |. Flow chart showing the stages of cryo-EM image processing for BARD1 (ARD-BRCT) in complex with the nucleosome ubiquitylated at H2A K13 and K15.
A total of 5,051 micrographs was collected on a Titan Krios 300 kV microscope and subjected to beam-induced motion correction. Data processing was done using cryoSPARC (v2.15). The reconstruction with the highest resolution was selected for building an atomic model.
Extended Data Fig. 7 |
Extended Data Fig. 7 |. Validation of EM data for BARD1 (ARD-BRCT) in complex with the nucleosome ubiquitylated at H2A K13 and K15.
a, Local resolution distribution displayed on the reconstructed cryo-EM density map of BARD1 (ARD-BRCT) bound to the H2AK13ubK15ub-containing NCP. b, Top: Euler angle distribution generated using RELION 3.0 for the particles used in the final reconstruction. Each bar has a height and colour indicative of the number of particles (increasing from blue to red) in a defined orientation. Bottom: particle angular distribution heatmap generated using cryoSPARC (v2.15). c, Gold-standard Fourier shell correlation (GSFSC) curves for the final refinement in cryoSPARC (v2.14). Non-uniform refinement led to a 2.94 Å resolution map. d, Quantification of directional resolution anisotropy using a 3D Fourier shell correlation (3DFSC) algorithm in the 3DFSC server. e, Fourier shell correlation (FSC) curves between model-calculated density and the final cryo-EM density map generated using PHENIX. Resolution at FSC 0.5 is indicated.
Extended Data Fig. 8 |
Extended Data Fig. 8 |. Sample cryo-EM density of the BARD1 (ARD-BRCT)-ubiquitylated nucleosome complex.
a, Representative regions of the cryo-EM density map for the different components (histones, DNA, BARD1-ARD, BARD1-BRCT and ubiquitin) of the complex. b, Representative regions of the cryo-EM density map highlighting global interfaces. c, Representative regions of the cryo-EM density map highlighting details of the various interfaces in the complex.
Extended Data Fig. 9 |
Extended Data Fig. 9 |. Ubiquitylated nucleosome-binding properties of BARD1 (ARD-BRCT) and associated inhibition of K63-mediated polyubiquitin chain formation.
a, Top: fluorescence polarization binding curves for BARD1 (ARD-BRCT), wild type (WT) and with the indicated mutations in the ARD domain, added to fluorescently labelled H2AK13ubK15ub-bearing NCP. GST was used as a control since BARD1 (ARD-BRCT) was GST-tagged. Data are mean and s.d. for each data point (n = 3 independent experiments). Kd values are indicated. ND, not determined. Bottom: similar to the top panel but with the indicated mutations in the tandem BRCT domain. b, Left: cryo-EM density near the ubiquitin isopeptide bond linkage in the structure of BARD1 (ARD-BRCT) in complex with H2AK13ubK15ub-bearing NCP. Only one ubiquitin molecule, interacting with BARD1 and NCP surfaces (that is, bound ubiquitin), is detected in the density. The weak and blurry density for the isopeptide bond region is compatible with the bound ubiquitin being linked to H2A K13 or H2A K15, suggesting binding exchange between H2AK13ub and H2AK15ub. Lack of density for a second ubiquitin molecule is probably due to flexibility in the unbound state. Right: ubiquitylation reaction of BARD1 (ARD-BRCT)-H2A-H2B fusion (labelled as Fusion) by RNF168, UbcH5c and UBA1 showing that there are two ubiquitin molecules attached to H2A (at K13 and K15) in the purified samples used for cryo-EM. Data shown are representative of n = 5 independent experiments. For gel source data, see Supplementary Fig. 6. c, Cryo-EM density at BARD1 BRCT-ubiquitin (left) and H2B-ubiquitin (right) interfaces in the structure of BARD1 (ARD-BRCT) bound to the NCP ubiquitylated at H2A K13 and K15. Ubiquitin K63 and E64 contact BARD1 while ubiquitin I44, G47, H68 and V70 contact H2B. d, Location of the putative phosphate-binding site in the BARD1 tandem BRCT domain. The predicted phosphate-binding residues S575, G576, L618 and K619 are highlighted in red. e, Left: MMS2-Ubc13-catalysed polyubiquitin chain elongation at H2AK13ubK15ub in the NCP was inhibited by adding increasing amounts of GST-tagged BARD1 (ARD-BRCT), up to 16 times molar excess. Ubiquitylation efficiency was calculated as a ratio of the total intensities of the ubiquitylated products in that particular western blot (WB) lane against the lane with uninhibited MMS2-Ubc13 activity. Data are mean and s.d. for each data point from n = 3 independent experiments. P values were calculated using a two-sample, two-tailed Student t-test; *P < 0.05, **P < 0.01, ***P < 0.001, NS means not significant. Exact P values are provided in Supplementary Table 1. Right: representative WB images depicting inhibition of the MMS2-Ubc13-catalysed polyubiquitin chain elongation at H2AK13ubK15ub in the NCP by GST-tagged BARD1 (ARD-BRCT) but not by GST. The non-ubiquitylated NCP, used as a control substrate, shows chain elongation of free ubiquitin only by MMS2-Ubc13, uninhibited by BARD1 (ARD-BRCT). All lanes with ATP show formation of di-ubiquitin with additional chain extension by MMS2-Ubc13, demonstrating that BARD1 or GST do not inhibit MMS2-Ubc13. For gel source data, see Supplementary Fig. 6.
Extended Data Fig. 10 |
Extended Data Fig. 10 |. BARD1 missense variants that map near the interdomain and intermolecular interfaces in the 3D structure of BARD1 (ARD-BRCT) in complex with the ubiquitylated nucleosome.
The side chains of BARD1 (ARD-BRCT) residues for which missense variants were identified in patients with cancer are highlighted on the 3D structure of BARD1 (ARD-BRCT)-ubiquitylated NCP. Only variants that are located near the interdomain and intermolecular interfaces are shown with a different colour for each interface. The amino acids are labelled when they are directly involved in interdomain or intermolecular interactions in the BARD1 (ARD-BRCT)-ubiquitylated NCP structure. The variants were obtained from the ClinVar database maintained at the US National Institutes of Health.
Fig. 1 |
Fig. 1 |. Cryo-EM structure of the BRCA1R–BARD1R–UbcH5c–nucleosome complex.
a, Fluorescence polarization binding curves for BRCA1R–BARD1R, wild type (WT) and with the indicated mutations in BRCA1R or BARD1R, added to fluorescently labelled NCP. Data are mean ± s.d. for each data point (n = 3 independent experiments). Kd values are indicated. ND, not determined. b, Representative Coomassie-stained gel readout of n = 2 independent ubiquitylation reactions carried out with UBA1 and the BRCA1R–BARD1R–UbcH5c–NCP complex (labelled as Fusion) used for 3D structure determination. For gel source data, see Supplementary Fig. 1. c, Cryo-EM density map (left) and structure (right) of the BRCA1R–BARD1R–UbcH5c–NCP complex. d-f, Close-up views of the contacts between BRCA1R and the H2A–H2B acidic patch in the NCP (d); BARD1R and histone H2B (e); and BRCA1R and UbcH5c (f). Relevant side chains and polar contacts identified using PyMol (yellow dashes) are highlighted.
Fig. 2 |
Fig. 2 |. Cryo-EM structure of BARD1 (ARD-BRCT) in complex with the nucleosome ubiquitylated at H2A K13 and K15.
a, Cryo-EM reconstruction of BARD1 (ARD–BRCT) in complex with the NCP bearing H2AK13ubK15ub presented in two orientations. A linked construct was used for structure determination as detailed in the Methods. b, Structure of the complex in a.
Fig. 3 |
Fig. 3 |. Intramolecular and intermolecular interfaces in the cryo-EM structure of BARD1 bound to the nucleosome ubiquitylated at H2A K13 and K15.
a, Overview of the interactions of BARD1 with histone proteins and ubiquitin in the NCP context. BARD1 ARD and tandem BRCT domain are differentiated by grey and blue surfaces, respectively. bf, Close-up views of the contacts between BARD1 (BRCT) and BARD1 (ARD) (b); BARD1 (ARD) and H4/DNA (c); BARD1 (BRCT) and the H2A–H2B acidic patch (d); BARD1 (BRCT) and ubiquitin/H2B (e); and ubiquitin and H2B (f). Relevant side chains and polar contacts identified using PyMol (yellow dashes) are highlighted.
Fig. 4 |
Fig. 4 |. BRCA1–BARD1 multivalent recognition of the NCP ubiquitylated at the H2A N terminus promotes NCP ubiquitylation at the H2A C terminus.
a, Affinities of the indicated BRCA1–BARD1 constructs, GST-tagged BARD1 (ARD–BRCT) and GST for fluorescently labelled NCPs, non-ubiquitylated and ubiquitylated at H2A K13 and K15 (NCPH2AK13ubK15ub), determined by fluorescence polarization. Data are mean ± s.d. for each data point (n = 3 independent experiments). Kd values are indicated. NB, no binding. b, Structural model assembled from the cryo-EM structures of the BRCA1R–BARD1R–UbcH5c–NCP complex and BARD1 (ARD–BRCT) bound to NCPH2AK13ubK15ub. The model illustrates a multivalent binding mechanism in which BRCA1R–BARD1R and BARD1 (ARD–BRCT) bind to opposite sides of NCPH2AK13ubK15ub. The BARD1 segment (blue dashed tube) connecting the ARD–BRCT and RING domains is predicted to be disordered. The disordered C-terminal tail of histone H2A (H2ACT; yellow tube) that is ubiquitylated by BRCA1R–BARD1R–UbcH5c and the putative phosphate-binding site (pink) in BARD1 (BRCT) are shown. c, Left, comparison of NCP and NCPH2AK13ubK15ub ubiquitylation by BRCA1R–BARD1R and BRCA1R–BARD1Long. Fractions of total H2A ubiquitylated (at the C terminus) were quantified from band intensities of fused H2A–H2B (non-ubiquitylated and ubiquitylated) in an anti-H2A western blot. Quantification using anti-H2B antibody produced similar results. Data are mean ± s.d. for each point (n = 3 independent experiments). P values were calculated in reference to BRCA1R–BARD1R + NCP ubiquitylation using a two-sample, two-tailed Student t-test; *P < 0.05, **P < 0.01, ***P < 0.001 and not significant (NS). Exact P values are provided in Supplementary Table 1. Right, representative western blot images for the ubiquitylation reactions. Histone and ubiquitin antibodies were used to show starting substrates and ubiquitylated products. For gel source data, see Supplementary Fig. 2.

References

    1. Hall JM et al. Linkage of early-onset familial breast cancer to chromosome 17q21. Science 250, 1684–1689 (1990). - PubMed
    1. Miki Y et al. A strong candidate for the breast and ovarian cancer susceptibility gene BRCA1. Science 266, 66–71 (1994). - PubMed
    1. Futreal PA et al. BRCA1 mutations in primary breast and ovarian carcinomas. Science 266, 120–122 (1994). - PubMed
    1. Friedman LS et al. Confirmation of BRCA1 by analysis of germline mutations linked to breast and ovarian cancer in ten families. Nat. Genet 8, 399–404 (1994). - PubMed
    1. Wu LC et al. Identification of a RING protein that can interact in vivo with the BRCA1 gene product. Nat. Genet 14, 430–440 (1996). - PubMed

Publication types

MeSH terms