

Microchip Electrophoresis Assay for Calmodulin Binding Proteins
- PMID: 34321981
- PMCID: PMC8312402
- DOI: 10.1002/jssc.202000884
Microchip Electrophoresis Assay for Calmodulin Binding Proteins
Abstract
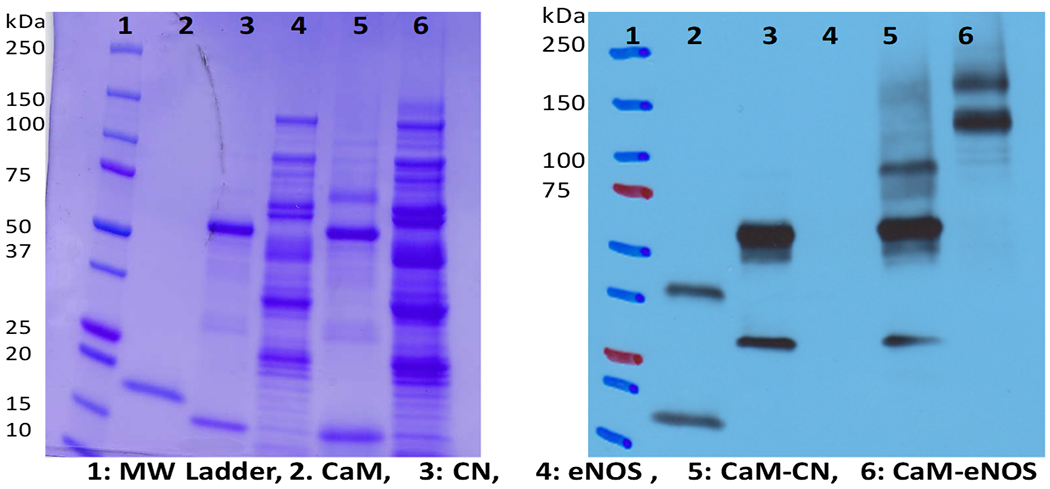
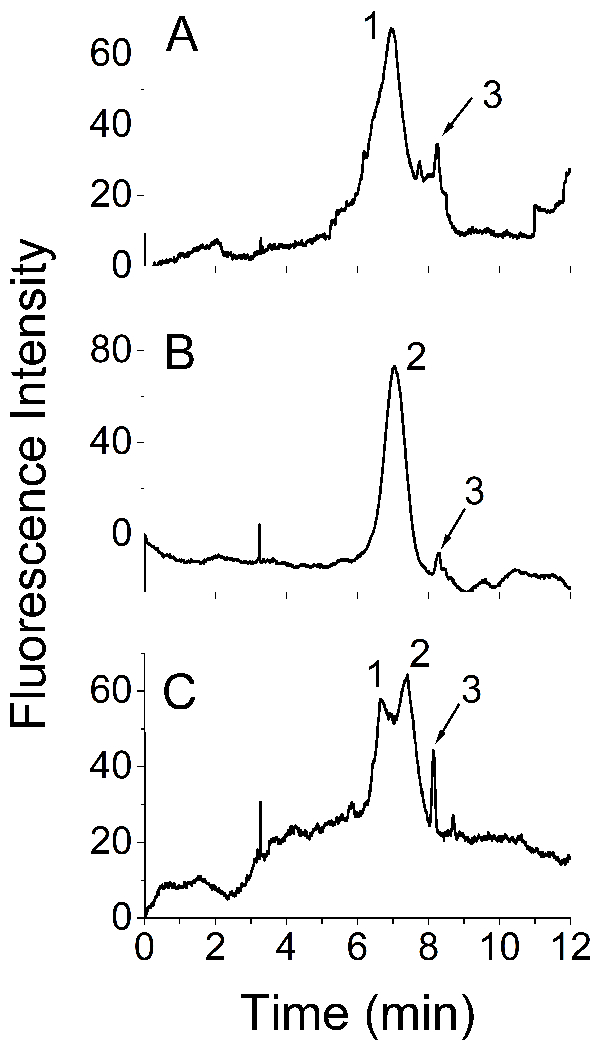
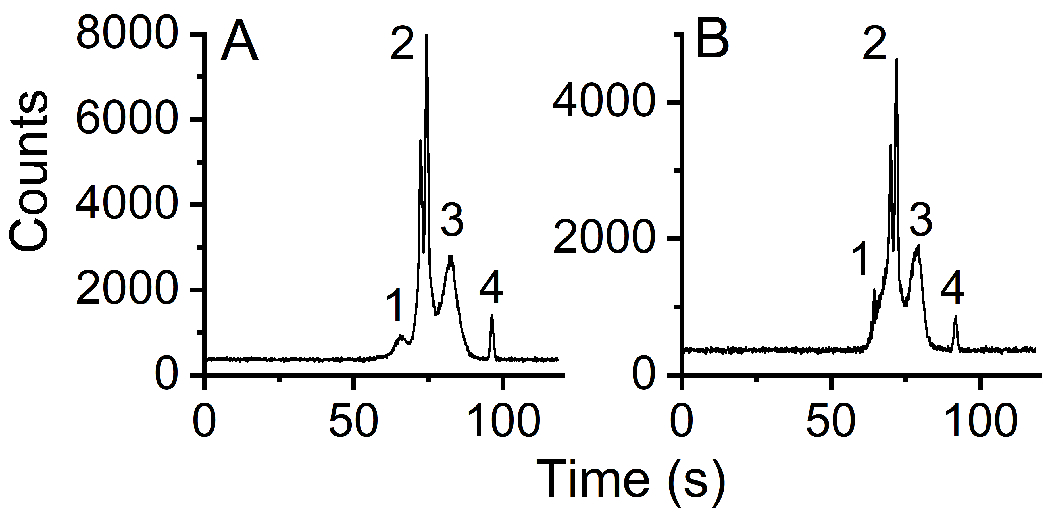
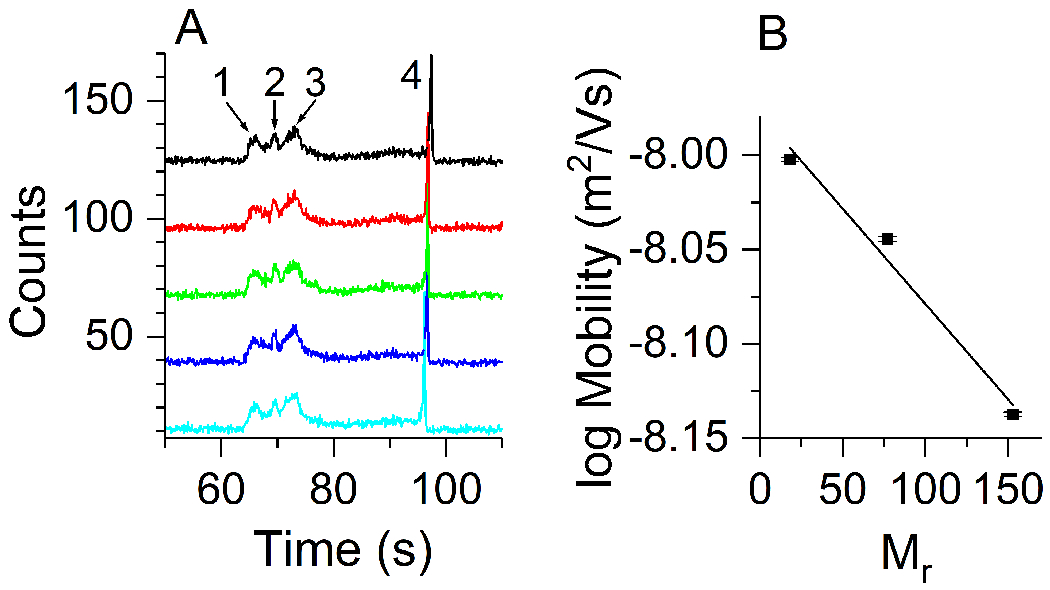
The calcium signaling protein calmodulin regulates numerous intracellular processes. We introduce a sensitive microchip assay to separate and detect calmodulin binding proteins. The assay utilizes an optimized microchip electrophoresis protein separation platform with laser-induced fluorescence detection. Fluorescence-labeled calmodulin modified with a photoreactive diazirine crosslinker allowed selective detection of calmodulin binding proteins. We demonstrate successful in-vitro crosslinking of calmodulin with two calmodulin binding proteins, calcineurin and nitric oxide synthase. We compare the efficacy of commonly applied electrophoretic separation modes: microchip capillary zone electrophoresis, microchip micellar electrokinetic chromatography/gel electrophoresis, and nanoparticle colloidal arrays. Out of the methods tested, polydymethylsiloxane/glass chips with microchip zone electrophoresis gave the poorest separation, whereas sieving methods in which electro-osmotic flow was suppressed gave the best separation of photoproducts of calmodulin conjugated with calmodulin binding proteins.
Keywords: calmodulin binding protein; colloidal array; micellar electrokinetic chromatography; microchip electrophoresis; photo-crosslinking.
Conflict of interest statement
Conflict of interest statement The authors declare no financial/commercial conflicts of interest.
Figures
Similar articles
-
Comparison of separation modes for microchip electrophoresis of proteins.J Sep Sci. 2021 Feb;44(3):744-751. doi: 10.1002/jssc.202000883. Epub 2020 Dec 13. J Sep Sci. 2021. PMID: 33226183 Free PMC article.
-
[Advances in microchip electrophoresis for the separation and analysis of biological samples].Se Pu. 2023 Aug;41(8):641-650. doi: 10.3724/SP.J.1123.2022.12004. Se Pu. 2023. PMID: 37534551 Free PMC article. Review. Chinese.
-
Electrokinetic characterization of hybrid NOA 81-glass microchips: Application to protein microchip electrophoresis with indirect fluorescence detection.Electrophoresis. 2022 Oct;43(20):2044-2048. doi: 10.1002/elps.202200057. Epub 2022 Aug 10. Electrophoresis. 2022. PMID: 35948488
-
Fast electrophoretic analysis of individual mitochondria using microchip capillary electrophoresis with laser induced fluorescence detection.Lab Chip. 2006 Aug;6(8):1007-11. doi: 10.1039/b601896c. Epub 2006 Jun 2. Lab Chip. 2006. PMID: 16874370
-
Microchip capillary electrophoresis: application to peptide analysis.Methods Mol Biol. 2006;339:159-86. doi: 10.1385/1-59745-076-6:159. Methods Mol Biol. 2006. PMID: 16790873 Review.
References
-
- Chin D, Means AR, Calmodulin: A prototypical calcium sensor. Trends Cell Biol. 2000, 10, 322–328. - PubMed
-
- Means AR, in: Bradshaw RA, Dennis EA (Eds.), Handbook of cell signaling. Academic Press, San Diego: 2004, pp. 83–85.
-
- O’Day DH, CaMBOT: Profiling and characterizing calmodulin-binding proteins. Cell. Signal. 2003, 15, 347–354. - PubMed
-
- O’Day DH, Myre MA, Calmodulin-binding domains in Alzheimer’s disease proteins: Extending the calcium hypothesis. Biochem. Biophys. Res. Commun. 2004, 320, 1051–1054. - PubMed
-
- Berggård T, Arrigoni G, Olsson O, Fex M, Linse S, James P, 140 mouse brain proteins identified by Ca2+-calmodulin affinity chromatography and tandem mass spectrometry. J. Proteome Res. 2006, 5, 669–687. - PubMed
MeSH terms
Substances
Grants and funding
LinkOut - more resources
Full Text Sources
