

Progressive Brain Degeneration From Subjective Cognitive Decline to Amnestic Mild Cognitive Impairment: Evidence From Large-Scale Anatomical Connection Classification Analysis
- PMID: 34322011
- PMCID: PMC8312851
- DOI: 10.3389/fnagi.2021.687530
Progressive Brain Degeneration From Subjective Cognitive Decline to Amnestic Mild Cognitive Impairment: Evidence From Large-Scale Anatomical Connection Classification Analysis
Abstract
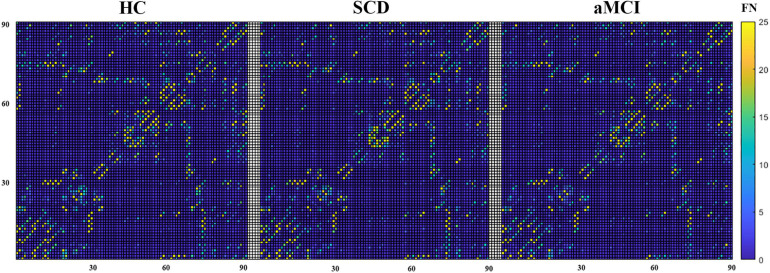
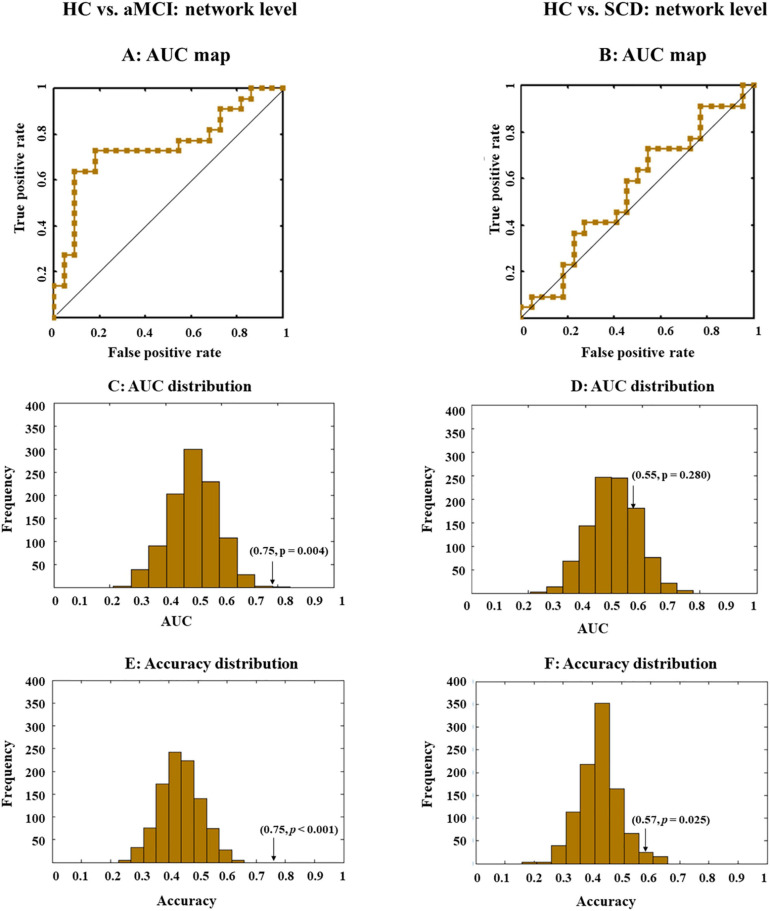
People with subjective cognitive decline (SCD) and amnestic mild cognitive impairment (aMCI) are both at high risk for Alzheimer's disease (AD). Behaviorally, both SCD and aMCI have subjective reports of cognitive decline, but the latter suffers a more severe objective cognitive impairment than the former. However, it remains unclear how the brain develops from SCD to aMCI. In the current study, we aimed to investigate the topological characteristics of the white matter (WM) network that can successfully identify individuals with SCD or aMCI from healthy control (HC) and to describe the relationship of pathological changes between these two stages. To this end, three groups were recruited, including 22 SCD, 22 aMCI, and 22 healthy control (HC) subjects. We constructed WM network for each subject and compared large-scale topological organization between groups at both network and nodal levels. At the network level, the combined network indexes had the best performance in discriminating aMCI from HC. However, no indexes at the network level can significantly identify SCD from HC. These results suggested that aMCI but not SCD was associated with anatomical impairments at the network level. At the nodal level, we found that the short-path length can best differentiate between aMCI and HC subjects, whereas the global efficiency has the best performance in differentiating between SCD and HC subjects, suggesting that both SCD and aMCI had significant functional integration alteration compared to HC subjects. These results converged on the idea that the neural degeneration from SCD to aMCI follows a gradual process, from abnormalities at the nodal level to those at both nodal and network levels.
Keywords: Alzheimer’s disease; amnestic mild cognitive impairment; network; subjective cognitive decline; white matter.
Copyright © 2021 Tao, Li, Li, Huang, Shao, Guan and Zhang.
Conflict of interest statement
The authors declare that the research was conducted in the absence of any commercial or financial relationships that could be construed as a potential conflict of interest.
Figures


Similar articles
-
Recent contributions to the field of subjective cognitive decline in aging: A literature review.Alzheimers Dement (Amst). 2023 Oct 18;15(4):e12475. doi: 10.1002/dad2.12475. eCollection 2023 Oct-Dec. Alzheimers Dement (Amst). 2023. PMID: 37869044 Free PMC article. Review.
-
Research progress on brain network imaging biomarkers of subjective cognitive decline.Front Neurosci. 2025 Feb 13;19:1503955. doi: 10.3389/fnins.2025.1503955. eCollection 2025. Front Neurosci. 2025. PMID: 40018359 Free PMC article. Review.
-
Disrupted Patterns of Rich-Club and Diverse-Club Organizations in Subjective Cognitive Decline and Amnestic Mild Cognitive Impairment.Front Neurosci. 2020 Oct 15;14:575652. doi: 10.3389/fnins.2020.575652. eCollection 2020. Front Neurosci. 2020. PMID: 33177982 Free PMC article.
-
Altered Patterns of Phase Position Connectivity in Default Mode Subnetwork of Subjective Cognitive Decline and Amnestic Mild Cognitive Impairment.Front Neurosci. 2020 Mar 20;14:185. doi: 10.3389/fnins.2020.00185. eCollection 2020. Front Neurosci. 2020. PMID: 32265623 Free PMC article.
-
Structural and Functional Disruption of Salience Network in Distinguishing Subjective Cognitive Decline and Amnestic Mild Cognitive Impairment.ACS Chem Neurosci. 2021 Apr 21;12(8):1384-1394. doi: 10.1021/acschemneuro.1c00051. Epub 2021 Apr 7. ACS Chem Neurosci. 2021. PMID: 33825444
Cited by
-
Recent contributions to the field of subjective cognitive decline in aging: A literature review.Alzheimers Dement (Amst). 2023 Oct 18;15(4):e12475. doi: 10.1002/dad2.12475. eCollection 2023 Oct-Dec. Alzheimers Dement (Amst). 2023. PMID: 37869044 Free PMC article. Review.
-
Research progress on brain network imaging biomarkers of subjective cognitive decline.Front Neurosci. 2025 Feb 13;19:1503955. doi: 10.3389/fnins.2025.1503955. eCollection 2025. Front Neurosci. 2025. PMID: 40018359 Free PMC article. Review.
-
Abnormal regional homogeneity in right caudate as a potential neuroimaging biomarker for mild cognitive impairment: A resting-state fMRI study and support vector machine analysis.Front Aging Neurosci. 2022 Sep 1;14:979183. doi: 10.3389/fnagi.2022.979183. eCollection 2022. Front Aging Neurosci. 2022. PMID: 36118689 Free PMC article.
-
Altered pattern analysis and identification of subjective cognitive decline based on morphological brain network.Front Aging Neurosci. 2022 Aug 11;14:965923. doi: 10.3389/fnagi.2022.965923. eCollection 2022. Front Aging Neurosci. 2022. PMID: 36034138 Free PMC article.
References
-
- Bangen K. J., Thomas K. R., Weigand A. J., Sanchez D. L., Delano-Wood L., Edmonds E. C., et al. (2020). Pattern of regional white matter hyperintensity volume in mild cognitive impairment subtypes and associations with decline in daily functioning. Neurobiol. Aging 86 134–142. 10.1016/j.neurobiolaging.2019.10.016 - DOI - PMC - PubMed
-
- Bilello M., Doshi J., Nabavizadeh S. A., Toledo J. B., Erus G., Xie S. X., et al. (2015). Correlating cognitive decline with white matter lesion and brain atrophy magnetic resonance imaging measurements in Alzheimer’s disease. J. Alzheimers Disease 48 987–994. 10.3233/jad-150400 - DOI - PMC - PubMed
LinkOut - more resources
Full Text Sources