Sphingosine 1-phosphate Stimulates Insulin Secretion and Improves Cell Survival by Blocking Voltage-dependent K+ Channels in β Cells
- PMID: 34322019
- PMCID: PMC8313013
- DOI: 10.3389/fphar.2021.683674
Sphingosine 1-phosphate Stimulates Insulin Secretion and Improves Cell Survival by Blocking Voltage-dependent K+ Channels in β Cells
Abstract
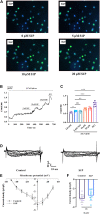
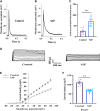
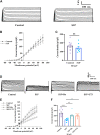
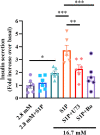
Recent studies suggest that Sphingosine 1-phosphate (S1P) plays an important role in regulating glucose metabolism in type 2 diabetes. However, its effects and mechanisms of promoting insulin secretion remain largely unknown. Here, we found that S1P treatment decreased blood glucose level and increased insulin secretion in C57BL/6 mice. Our results further showed that S1P promoted insulin secretion in a glucose-dependent manner. This stimulatory effect of S1P appeared to be irrelevant to cyclic adenosine monophosphate signaling. Voltage-clamp recordings showed that S1P did not influence voltage-dependent Ca2+ channels, but significantly blocked voltage-dependent potassium (Kv) channels, which could be reversed by inhibition of phospholipase C (PLC) and protein kinase C (PKC). Calcium imaging revealed that S1P increased intracellular Ca2+ levels, mainly by promoting Ca2+ influx, rather than mobilizing intracellular Ca2+ stores. In addition, inhibition of PLC and PKC suppressed S1P-induced insulin secretion. Collectively, these results suggest that the effects of S1P on glucose-stimulated insulin secretion (GSIS) depend on the inhibition of Kv channels via the PLC/PKC signaling pathway in pancreatic β cells. Further, S1P improved β cell survival; this effect was also associated with Kv channel inhibition. This work thus provides new insights into the mechanisms whereby S1P regulates β cell function in diabetes.
Keywords: insulin secretion; sphingosine 1-phosphate; type 2 diabetes; voltage-dependent potassium channels; β cell.
Copyright © 2021 Liu, Yang, Zhi, Xue, Lu, Zhao, Cui, Liu, Ren, He, Liu and Zhang.
Conflict of interest statement
The authors declare that the research was conducted in the absence of any commercial or financial relationships that could be construed as a potential conflict of interest.
Figures


Similar articles
-
Sphingosine 1-phosphate induces CREB activation in rat cerebral artery via a protein kinase C-mediated inhibition of voltage-gated K+ channels.Biochem Pharmacol. 2003 Nov 1;66(9):1861-70. doi: 10.1016/s0006-2952(03)00546-x. Biochem Pharmacol. 2003. PMID: 14563496
-
The PLC/PKC/Ras/MEK/Kv channel pathway is involved in uncarboxylated osteocalcin-regulated insulin secretion in rats.Peptides. 2016 Dec;86:72-79. doi: 10.1016/j.peptides.2016.10.004. Epub 2016 Oct 14. Peptides. 2016. PMID: 27746193
-
PACAP stimulates insulin secretion by PAC1 receptor and ion channels in β-cells.Cell Signal. 2019 Sep;61:48-56. doi: 10.1016/j.cellsig.2019.05.006. Epub 2019 May 11. Cell Signal. 2019. PMID: 31085235
-
Voltage-dependent K(+) channels in pancreatic beta cells: role, regulation and potential as therapeutic targets.Diabetologia. 2003 Aug;46(8):1046-62. doi: 10.1007/s00125-003-1159-8. Epub 2003 Jun 27. Diabetologia. 2003. PMID: 12830383 Review.
-
Glucose-stimulated signaling pathways in biphasic insulin secretion.Diabetes Metab Res Rev. 2002 Nov-Dec;18(6):451-63. doi: 10.1002/dmrr.329. Diabetes Metab Res Rev. 2002. PMID: 12469359 Review.
Cited by
-
HDL-bound S1P affects the subventricular niche and early neuropathological features of Alzheimer's disease.Nat Commun. 2025 Jul 1;16(1):5728. doi: 10.1038/s41467-025-60750-0. Nat Commun. 2025. PMID: 40593621 Free PMC article.
-
Cinchonine, a Potential Oral Small-Molecule Glucagon-Like Peptide-1 Receptor Agonist, Lowers Blood Glucose and Ameliorates Non-Alcoholic Steatohepatitis.Drug Des Devel Ther. 2023 May 11;17:1417-1432. doi: 10.2147/DDDT.S404055. eCollection 2023. Drug Des Devel Ther. 2023. PMID: 37197367 Free PMC article.
-
Signaling controversy and future therapeutical perspectives of targeting sphingolipid network in cancer immune editing and resistance to tumor necrosis factor-α immunotherapy.Cell Commun Signal. 2024 May 2;22(1):251. doi: 10.1186/s12964-024-01626-6. Cell Commun Signal. 2024. PMID: 38698424 Free PMC article. Review.
-
HDL as Bidirectional Lipid Vectors: Time for New Paradigms.Biomedicines. 2022 May 20;10(5):1180. doi: 10.3390/biomedicines10051180. Biomedicines. 2022. PMID: 35625916 Free PMC article. Review.
-
Role of sphingolipid metabolites in the homeostasis of steroid hormones and the maintenance of testicular functions.Front Endocrinol (Lausanne). 2023 Mar 17;14:1170023. doi: 10.3389/fendo.2023.1170023. eCollection 2023. Front Endocrinol (Lausanne). 2023. PMID: 37008929 Free PMC article. Review.
References
-
- Blom T., Slotte J. P., Pitson S. M., Törnquist K. (2005). Enhancement of Intracellular Sphingosine-1-Phosphate Production by Inositol 1,4,5-Trisphosphate-Evoked Calcium Mobilisation in HEK-293 Cells: Endogenous Sphingosine-1-Phosphate as a Modulator of the Calcium Response. Cell Signal. 17, 827–836. 10.1016/j.cellsig.2004.11.022 - DOI - PubMed
-
- Bokvist K., Eliasson L., Ammälä C., Renström E., Rorsman P. (1995). Co-localization of L-type Ca2+ Channels and Insulin-Containing Secretory Granules and its Significance for the Initiation of Exocytosis in Mouse Pancreatic B-Cells. EMBO J. 14, 50–57. 10.1002/j.1460-2075.1995.tb06974.x - DOI - PMC - PubMed
LinkOut - more resources
Full Text Sources
Miscellaneous

