. 2021 Jul 12:11:680136.
doi: 10.3389/fcimb.2021.680136. eCollection 2021.

Rodent Malaria Erythrocyte Preference Assessment by an Ex Vivo Tropism Assay

Affiliations

Rodent Malaria Erythrocyte Preference Assessment by an Ex Vivo Tropism Assay

Yew Wai Leong et al. Front Cell Infect Microbiol. .

Abstract

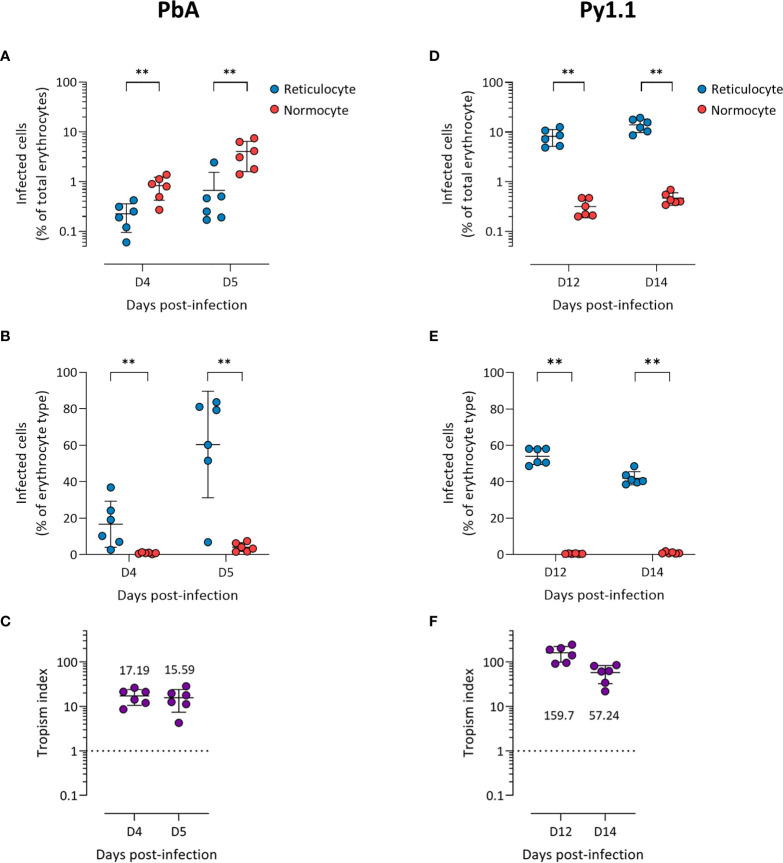
Circulating red blood cells consist of young erythrocytes (early and late reticulocytes) and mature erythrocytes (normocytes). The human malaria parasites, Plasmodium falciparum and P. vivax, have a preference to invade reticulocytes during blood-stage infection. Rodent malaria parasites that also prefer reticulocytes could be useful tools to study human malaria reticulocyte invasion. However, previous tropism studies of rodent malaria are inconsistent from one another, making it difficult to compare cell preference of different parasite species and strains. In vivo measurements of cell tropism are also subjected to many confounding factors. Here we developed an ex vivo tropism assay for rodent malaria with highly purified fractions of murine reticulocytes and normocytes. We measured invasion into the different erythrocyte populations using flow cytometry and evaluated the tropism index of the parasite strains. We found that P. berghei ANKA displayed the strongest reticulocyte preference, followed by P. yoelii 17X1.1, whereas P. chabaudi AS and P. vinckei S67 showed mixed tropism. These preferences are intrinsic and were maintained at different reticulocyte and normocyte availabilities. Our study shed light on the true erythrocyte preference of the parasites and paves the way for future investigations on the receptor-ligand interactions mediating erythrocyte tropism.

Keywords: erythrocyte invasion; erythrocyte tropism; flow cytometry; normocyte; reticulocyte; rodent malaria.


Conflict of interest statement

The authors declare that the research was conducted in the absence of any commercial or financial relationships that could be construed as a potential conflict of interest.

Figures

Figure 1
Figure 1
P. berghei ANKA (A–C) and P. yoelii 17X1.1 (D–F) prefer to invade reticulocytes in vivo. Flow cytometry data of peripheral blood taken from infected mice before the peak of infection (two days shown). Reticulocytes (blue circles) and normocytes (red circles) are defined as CD71+ CD98+ cells and CD71- CD98- cells, respectively. Infected cells are Hoechst-positive. (A, D) Data shown are infected reticulocytes and infected normocytes, as a percentage of total erythrocytes. (B, E) Data normalized to the relative frequencies of reticulocytes and normocytes, by expressing infected reticulocytes and normocytes as a percentage of total reticulocytes and total normocytes, respectively. (C, F) The in vivo tropism index is calculated as the ratio of percentage of infected reticulocytes (out of total reticulocytes) to percentage of infected normocytes (out of total normocytes). The mean tropism indices (n = 6 mice) are shown. Dotted lines at tropism index = 1 represent no erythrocyte preference. All error bars are standard deviations. **p < 0.01.
Figure 2
Figure 2
P. chabaudi chabaudi AS has no erythrocyte preference (A–C) and P. vinckei vinckei S67 prefers normocytes (D–F) in vivo. Flow cytometry data of peripheral blood taken from infected mice before the peak of infection (two days shown). Reticulocytes (blue circles) and normocytes (red circles) are defined as CD71+ CD98+ cells and CD71- CD98- cells, respectively. Infected cells are Hoechst-positive. (A, D) Data shown are infected reticulocytes and infected normocytes, as a percentage of total erythrocytes. (B, E) Data normalized to the relative frequencies of reticulocytes and normocytes, by expressing infected reticulocytes and normocytes as a percentage of total reticulocytes and total normocytes, respectively. (C, F) The in vivo tropism index is calculated as the ratio of percentage of infected reticulocytes (out of total reticulocytes) to percentage of infected normocytes (out of total normocytes). The mean tropism indices (n = 5 mice) are shown. Dotted lines at tropism index = 1 represent no erythrocyte preference. All error bars are standard deviations. ns, not significant; *p < 0.05; **p < 0.01.
Figure 3
Figure 3
Development of an ex vivo tropism assay to measure erythrocyte preference of rodent malaria. (A) Schematic showing workflow of the assay. Normocytes are enriched by Percoll density centrifugation of blood taken from normal mice (untreated and uninfected). Reticulocytes are enriched similarly from blood taken from mice that underwent a phlebotomy routine. Enriched cells are then stained with different fluorescent dyes. Late-stage parasites are enriched from infected blood via magnetic-activated cell sorting (MACS). The cells are then incubated together for 12 hrs and measured by flow cytometry. Images were created on Biorender.com. (B) Reticulocyte purity (based on thiazole orange staining) after the two-step reticulocyte enrichment. Data from 9 independent experiments. Error bars represent standard deviation. (C) Late-stage parasite purity post-MACS for the four major rodent malaria strains. Histogram showing Hoechst levels and Giemsa-stained thin smears of enriched cells. Most of the enriched cells consist of late-stage parasites. Scale bar of microscopy images = 20 µm. PbA, P. berghei ANKA. Py1.1, P. yoelii 17X1.1. PccAS, P. chabaudi chabaudi AS. PvvS67, P. vinckei vinckei S67. (D) Flow cytometry gating strategy. At T=0hr, reticulocytes stained with CellTracker Deep Red (CTDR) are easily distinguishable from normocytes stained with CellTrace Oregon Green (CTOG). Late-stage parasites within erythrocytes are negative for both dyes. At T=12hr, new invasions into reticulocytes and normocytes can be detected by Hoechst.
Figure 4
Figure 4
Ex vivo tropism of rodent malaria strains at equal reticulocyte:normocyte ratio. (A) Reticulocyte and normocytes invasion efficiencies (see Materials and Methods for calculation) were compared for all strains to determine erythrocyte preference. Data shown for each of the parasite strains are from 5 independent experiments. Error bars represent standard error of mean (SEM). ns, not significant; *p < 0.05; **p < 0.01. (B) Tropism indices are derived from the invasion efficiencies in (A). Tropism index was calculated as the ratio of reticulocyte invasion efficiency to normocyte invasion efficiency. Dotted lines at tropism index = 0.67 and 1.5 represent the boundaries of mixed tropism, as determined by the spread of PccAS’s and PvvS67’s data. Tropism indices of > 1.5 indicate a preference for reticulocytes and tropism indices of < 0.67 indicate normocyte tropism. The mean tropism indices are shown, and error bars represent SEM. PbA, P. berghei ANKA. Py1.1, P. yoelii 17X1.1. PccAS, P. chabaudi chabaudi AS. PvvS67, P. vinckei vinckei S67.
Figure 5
Figure 5
Ex vivo tropism of P. berghei ANKA (A–C) and P. yoelii 17X1.1 (D–F) at variable reticulocyte:normocyte ratios. (A, D) Reticulocyte (blue) and normocyte (red) invasion efficiencies (see Materials and Methods for calculation) were compared at five different erythrocyte ratios, 10:90, 30:70, 50:50, 70:30, 90:10 reticulocyte:normocyte. Total invasion efficiency (black) is the sum of reticulocyte and normocyte invasions. (B, E) Reticulocyte and normocyte invasion efficiencies were normalized to their respective population frequencies (see Materials and Methods). (C, F) Tropism indices were calculated from the ratio of normalized reticulocyte invasion efficiency to the normalized normocyte invasion efficiency. Mean tropism indices are also shown. Dotted lines at tropism index = 1 represent mixed tropism. All error bars represent standard deviation. n = 5 technical replicates, for each strain.
Figure 6
Figure 6
Ex vivo tropism of P. chabaudi chabaudi AS (A–C) and P. vinckei vinckei S67 (D–F) at variable reticulocyte:normocyte ratios. (A, D) Reticulocyte (blue) and normocyte (red) invasion efficiencies (see Materials and Methods for calculation) were compared at five different erythrocyte ratios, 10:90, 30:70, 50:50, 70:30, 90:10 reticulocyte:normocyte. Total invasion efficiency (black) is the sum of reticulocyte and normocyte invasions. (B, E) Reticulocyte and normocyte invasion efficiencies were normalized to their respective population frequencies (see Materials and Methods). (C, F) Tropism indices were calculated from the ratio of normalized reticulocyte invasion efficiency to the normalized normocyte invasion efficiency. Mean tropism indices are also shown. Dotted lines at tropism index = 1 represent mixed tropism. All error bars represent standard deviation. n = 5 technical replicates, for each strain.

References

    1. Bafort J. (1967). La Transmission Cyclique Du Plasmodium Vinckei . Ann. Soc Belg. Med. Trop. 47, 271–276. - PubMed
    1. Banerjee R., Khandelwal S., Kozakai Y., Sahu B., Kumar S. (2015). CD47 Regulates the Phagocytic Clearance and Replication of the Plasmodium Yoelii Malaria Parasite. Proc. Natl. Acad. Sci. 112, 3062–3067. 10.1073/pnas.1418144112 - DOI - PMC - PubMed
    1. Chin-Yee I., Keeney M., Lohmann R. C. (1991). Flow Cytometric Reticulocyte Analysis Using Thiazole Orange; Clinical Experience and Technical Limitations. Clin. Lab. Haematol. 13, 177–188. 10.1111/j.1365-2257.1991.tb00267.x - DOI - PubMed
    1. Chu T. T. T., Sinha A., Malleret B., Suwanarusk R., Park J. E., Naidu R., et al. . (2018). Quantitative Mass Spectrometry of Human Reticulocytes Reveal Proteome-Wide Modifications During Maturation. Br. J. Haematol. 180, 118–133. 10.1111/bjh.14976 - DOI - PubMed
    1. Claser C., Malleret B., Gun S. Y., Wong A. Y. W., Chang Z. W., Teo P., et al. . (2011). Cd8+ T Cells and IFN-γ Mediate the Time-Dependent Accumulation of Infected Red Blood Cells in Deep Organs During Experimental Cerebral Malaria. PloS One 6, e18720. 10.1371/journal.pone.0018720 - DOI - PMC - PubMed

Publication types