Review
. 2021 Jun;36(6):581-588.
doi: 10.1007/s10654-021-00787-9. Epub 2021 Jul 28.

Over- and under-estimation of COVID-19 deaths

Affiliations
Review

Over- and under-estimation of COVID-19 deaths

John P A Ioannidis. Eur J Epidemiol. 2021 Jun.

Abstract

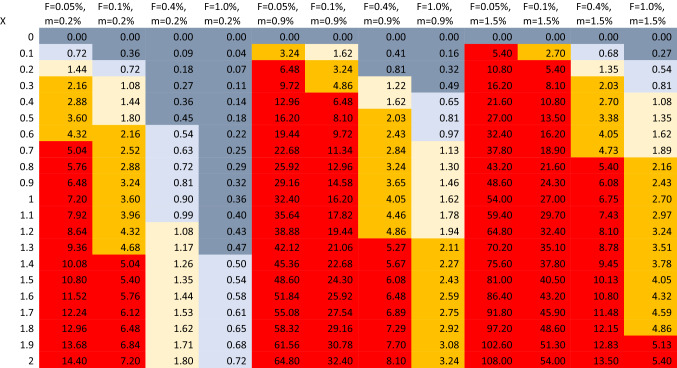
The ratio of COVID-19-attributable deaths versus "true" COVID-19 deaths depends on the synchronicity of the epidemic wave with population mortality; duration of test positivity, diagnostic time window, and testing practices close to and at death; infection prevalence; the extent of diagnosing without testing documentation; and the ratio of overall (all-cause) population mortality rate and infection fatality rate. A nomogram is offered to assess the potential extent of over- and under-counting in different situations. COVID-19 deaths were apparently under-counted early in the pandemic and continue to be under-counted in several countries, especially in Africa, while over-counting probably currently exists for several other countries, especially those with intensive testing and high sensitization and/or incentives for COVID-19 diagnoses. Death attribution in a syndemic like COVID-19 needs great caution. Finally, excess death estimates are subject to substantial annual variability and include also indirect effects of the pandemic and the effects of measures taken.

Keywords: COVID-19; Death certificates; Diagnostic testing; Excess deaths; Mortality.


Figures

Fig. 1
Fig. 1
Nomogram of inflation ratio R (test-attributed deaths divided by deaths truly caused by COVID-19) for different combinations of values of X, m, and F. Red color corresponds to r > 5, orange color R = 2–5, yellow color R = 1–2, light blue color R = 0.5–1.0, dark clue color R < 0.5
Fig. 2
Fig. 2
Scatterplots of reported COVID-19 deaths as of May 9, 2021 (in deaths per 100,000 population) against (a) overall population mortality rate (annual, per 1000 population) and b percentage of population over 65 years. Panel c shows a scatterplot of the overall mortality rate against the percentage of population over 65 years. Countries with < 50 tests done per 1000 population during the pandemic and those with no information on number of tests done are shown with smaller markers, since under-counting of deaths is very likely in them. Data for overall mortality rate are from ref. 11, data for COVID-19 mortality are from ref. 21 and both data have been completed also from Ref. and from https://www.indexmundi.com/. Data for age structure are from https://data.worldbank.org/indicator/SP.POP.65UP.TO.ZS. All the data are in the Supplementary data file

References

    1. Rao C. Medical certification of cause of death for COVID-19. Bull World Health Organ. 2020;98(5):298–298A. doi: 10.2471/BLT.20.257600. - DOI - PMC - PubMed
    1. Brooks EG, Reed KD. Principles and pitfalls: a guide to death certification. Clin Med Res. 2015;13:74–82. doi: 10.3121/cmr.2015.1276. - DOI - PMC - PubMed
    1. McGivern L, Shulman L, Carney JK, Shapiro S, Bundock E. Death certification errors and the effect on mortality statistics. Public Health Rep. 2017;132:669–675. doi: 10.1177/0033354917736514. - DOI - PMC - PubMed
    1. Watson J, Whiting PF, Brush JE. Interpreting a COVID-19 test result. BMJ. 2020;369:m1808. - PubMed
    1. Tsang NNY, So HC, Ng KY, Cowling BJ, Leung GM, Ip DKM. Diagnostic performance of different sampling approaches for SARS-CoV-2 RT-PCR testing: a systematic review and meta-analysis. Lancet Infect Dis. 2021 doi: 10.1016/S1473-3099(21)00146-8. - DOI - PMC - PubMed