. 2021 Jul 29:10:e69317.
doi: 10.7554/eLife.69317.

Reduced antibody cross-reactivity following infection with B.1.1.7 than with parental SARS-CoV-2 strains

Affiliations

Reduced antibody cross-reactivity following infection with B.1.1.7 than with parental SARS-CoV-2 strains

Nikhil Faulkner et al. Elife. .

Abstract

Background: The degree of heterotypic immunity induced by severe acute respiratory syndrome coronavirus 2 (SARS-CoV-2) strains is a major determinant of the spread of emerging variants and the success of vaccination campaigns, but remains incompletely understood.

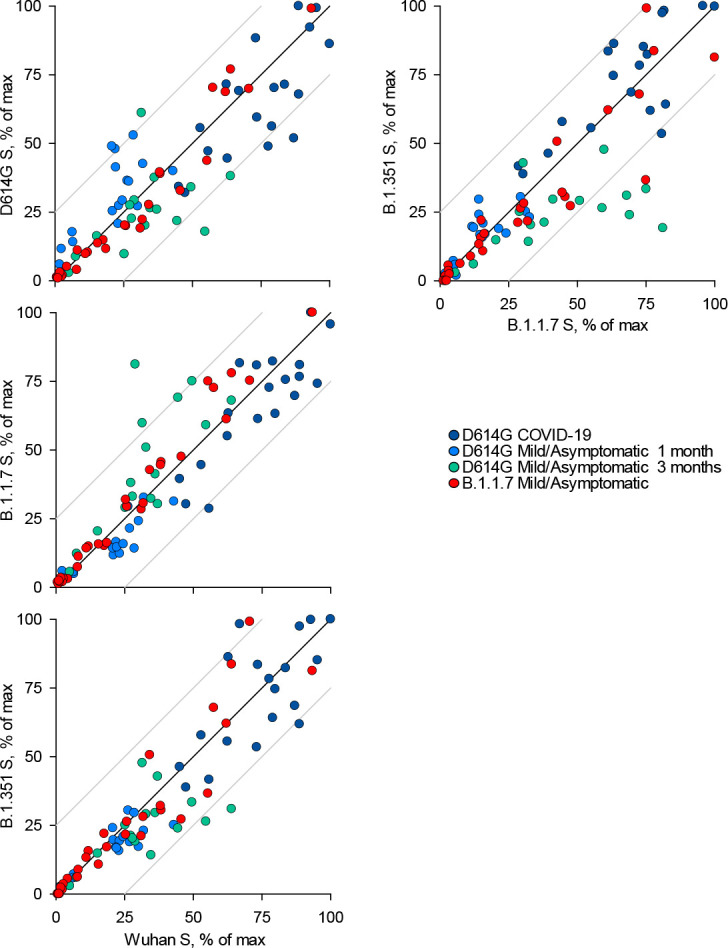
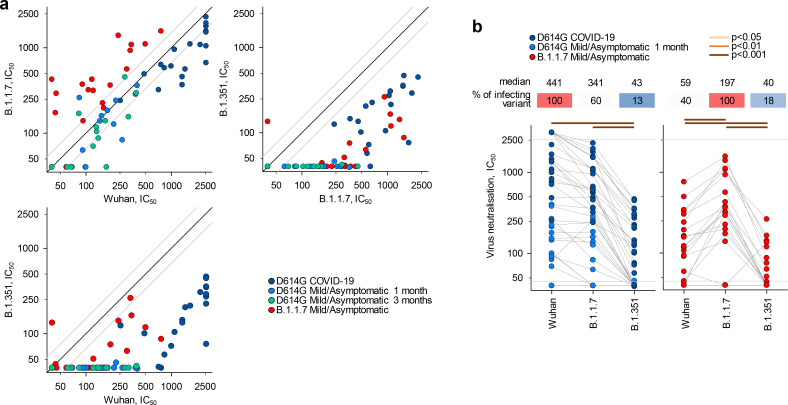
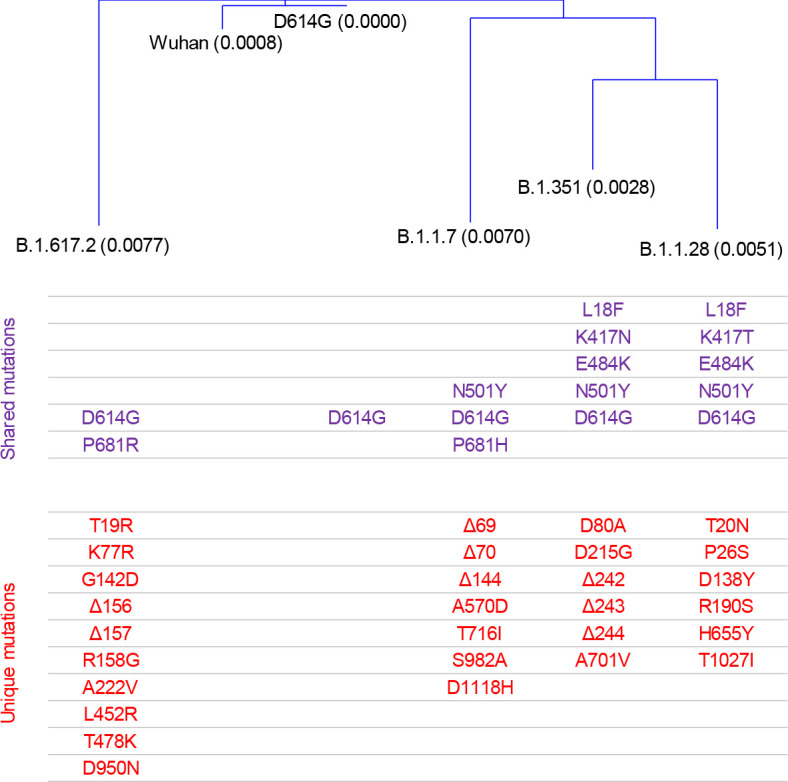
Methods: We examined the immunogenicity of SARS-CoV-2 variant B.1.1.7 (Alpha) that arose in the United Kingdom and spread globally. We determined titres of spike glycoprotein-binding antibodies and authentic virus neutralising antibodies induced by B.1.1.7 infection to infer homotypic and heterotypic immunity.

Results: Antibodies elicited by B.1.1.7 infection exhibited significantly reduced recognition and neutralisation of parental strains or of the South Africa variant B.1.351 (Beta) than of the infecting variant. The drop in cross-reactivity was significantly more pronounced following B.1.1.7 than parental strain infection.

Conclusions: The results indicate that heterotypic immunity induced by SARS-CoV-2 variants is asymmetric.

Funding: This work was supported by the Francis Crick Institute and the Max Planck Institute for Dynamics of Complex Technical Systems, Magdeburg.

Keywords: COVID-19; SARS-CoV-2; epidemiology; global health; human; infectious disease; microbiology; viral variant; virus.


Conflict of interest statement

NF, KN, MW, RH, MM, SP, CH, SH, MG, WB, SW, JH, HR, MS, DF, MB, Td, AS, SK, CS, SG, RB, SG, JM, RD, MH, DB, EN, GK No competing interests declared

Figures

Figure 1.
Figure 1.. Recognition of distinct severe acute respiratory syndrome coronavirus 2 (SARS-CoV-2) spike glycoproteins by antibodies in D614G and B.1.1.7 sera.
(a-c) Correlation of IgG (a), IgM (b), and IgA (c) antibody levels to D614G and B.1.1.7 or B.1.351 spikes in the indicated groups of donors infected either with the D614G or B.1.1.7 strains. Each symbol represents an individual sample and levels are expressed as a percentage of the positive control. Black lines denote complete correlation and grey lines a 25% change in either direction. (d-f) Comparison of IgG (d), IgM (e), and IgA (f) antibody levels to the indicated spikes in groups of donors acutely infected either with the D614G or B.1.1.7 strains. Connected symbols represent individual donors. Numbers above the plots denote the average binding to each spike, expressed as a percentage of binding to the infecting spike.
Figure 1—figure supplement 1.
Figure 1—figure supplement 1.. Flow cytometric detection of spike-binding antibodies.
HEK293T cells were transfected with expression plasmids encoding each severe acute respiratory syndrome coronavirus 2 (SARS-CoV-2) variant spike and were used for flow cytometric analysis 2 days later. (a) Gating of HEK293T cells and of single cells in these mixed cell suspensions. (b) Example of IgG, IgM, and IgA staining in a positive sample and a negative control. Numbers within the plots denote the percentage of positive cells. (c) Staining of HEK293T cells transfected to express the Wuhan spike, with titrated amounts of the S2-specific D001 monoclonal antibody. Numbers above the plots denote the final D001 antibody concentration. (d) Median fluorescence intensity (MFI) of stained cells in c, according to the D001 antibody concentration.
Figure 1—figure supplement 2.
Figure 1—figure supplement 2.. Recognition of distinct severe acute respiratory syndrome coronavirus 2 (SARS-CoV-2) spike glycoproteins by antibodies in D614G and B.1.1.7 sera.
Correlation of IgG antibody levels to Wuhan, D614G, B.1.1.7, and B.1.351 spikes in the indicated groups of donors infected either with the D614G or B.1.1.7 strains. Each symbol represents an individual sample and levels are expressed as a percentage of the positive control. Black lines denote complete correlation and grey lines a 25% change in either direction.
Figure 1—figure supplement 3.
Figure 1—figure supplement 3.. Recognition of distinct severe acute respiratory syndrome coronavirus 2 (SARS-CoV-2) spike glycoproteins by antibodies in D614G and B.1.1.7 sera.
Correlation of IgM antibody levels to Wuhan, D614G, B.1.1.7, and B.1.351 spikes in the indicated groups of donors infected either with the D614G or B.1.1.7 strains. Each symbol represents an individual sample and levels are expressed as a percentage of the positive control. Black lines denote complete correlation and grey lines a 25% change in either direction.
Figure 1—figure supplement 4.
Figure 1—figure supplement 4.. Recognition of distinct severe acute respiratory syndrome coronavirus 2 (SARS-CoV-2) spike glycoproteins by antibodies in D614G and B.1.1.7 sera.
Correlation of IgA antibody levels to Wuhan, D614G, B.1.1.7, and B.1.351 spikes in the indicated groups of donors infected either with the D614G or B.1.1.7 strains. Each symbol represents an individual sample and levels are expressed as a percentage of the positive control. Black lines denote complete correlation and grey lines a 25% change in either direction.
Figure 1—figure supplement 5.
Figure 1—figure supplement 5.. Matrix of correlation coefficients between binding and neutralising antibodies.
Levels of binding IgG, IgM, and IgA antibodies to the indicated spikes and levels of neutralising antibodies to the indicated strains were correlated using all the samples described in this work (n=83).
Figure 1—figure supplement 6.
Figure 1—figure supplement 6.. Kinetics and magnitude of the antibody response to D614G and B.1.1.7 infection.
(a) Levels of IgG antibodies to the spike of the infecting strain in sera from donors infected with the D614G or B.1.1.7 strains, over time since onset of symptoms (for symptomatic cases) or the first positive RT-qPCR diagnosis (for asymptomatic cases). Levels are expressed as a percentage of the positive control. (b) Neutralising antibody levels (IC50) against the closest infecting strain (Wuhan for D614G infection and B.1.1.7 for B.1.1.7 infection) in sera from donors infected with the D614G or B.1.1.7 strains, over time since onset of symptoms or since the first positive RT-qPCR diagnosis. (c) Correlation of binding IgG and neutralising antibody levels from a and b, respectively. (d) Comparison of binding IgG, IgM, and IgA antibody levels and of neutralising antibody levels (IC50) between B.1.1.7-infected asymptomatic donors and those with mild COVID-19 symptoms. Antibody binding and virus neutralisation were tested against the homologous B.1.1.7 spike and virus, respectively. Differences between the two groups were not statistically significant. Grey horizontal lines denote the lower and upper limit of detection. In (a-d), each symbol represents an individual sample.
Figure 2.
Figure 2.. Neutralisation of distinct severe acute respiratory syndrome coronavirus 2 (SARS-CoV-2) strains by antibodies in D614G and B.1.1.7 sera.
(a) Correlation of neutralising antibody levels (IC50) against the Wuhan, B.1.1.7, or B.1.351 strains in the indicated groups of donors infected either with the D614G or B.1.1.7 strains. Each symbol represents an individual sample. Black lines denote complete correlation and grey lines a 50% (twofold) change in either direction. (b) Comparison of neutralising antibody levels (IC50) to the indicated SARS-CoV-2 strains in groups of donors acutely infected with either the D614G or B.1.1.7 strains. Connected symbols represent individual donors. Numbers above the plots denote the average IC50 against each strain, expressed as a percentage of IC50 against the infecting strain. Grey horizontal lines denote the lower and upper limit of detection.
Figure 2—figure supplement 1.
Figure 2—figure supplement 1.. Neutralisation of distinct severe acute respiratory syndrome coronavirus 2 (SARS-CoV-2) strains by antibodies in D614G sera, according to severity of infection.
Comparison of neutralising antibody levels (IC50) to the indicated SARS-CoV-2 strains in donors acutely infected with the D614G strain, grouped according to the severity of the outcome. Connected symbols represent individual donors. Numbers above the plots denote the average IC50 against each strain, expressed as a percentage of IC50 against the infecting strain. Grey horizontal lines denote the lower and upper limit of detection.
Figure 2—figure supplement 2.
Figure 2—figure supplement 2.. Binding and neutralising antibodies at a 3-month follow-up of mild/asymptomatic D614G infection.
(a) Levels of IgG, IgM, and IgA antibodies (expressed as a percentage of the positive control) to the D614G spike in sera from D614G-infected donors at 1 and 3 months post infection. (b) Neutralising antibody levels (IC50) against the Wuhan, B.1.1.7, or B.1.351 strains in same donors described in a. In a and b, connected symbols represent individual donors.
Figure 2—figure supplement 3.
Figure 2—figure supplement 3.. Neutralisation of distinct severe acute respiratory syndrome coronavirus 2 (SARS-CoV-2) strains by antibodies in D614G and B.1.1.7 sera from mild/asymptomatic infection.
Comparison of neutralising antibody levels (IC50) to the indicated SARS-CoV-2 strains in subgroups of donors acutely infected with either the D614G (n=11) or B.1.1.7 (n=11) strains, selected for comparable disease outcome and time since infection. Connected symbols represent individual donors. Numbers above the plots denote the average IC50 against each strain, expressed as a percentage of IC50 against the infecting strain. Grey horizontal lines denote the lower and upper limit of detection.
Figure 2—figure supplement 4.
Figure 2—figure supplement 4.. Spike sequence distance of severe acute respiratory syndrome coronavirus 2 (SARS-CoV-2) variants.
Distance was calculated based on the sequence alignment of the full-length spike amino acid sequences of the indicated SARS-CoV-2 variants. Mutations of amino acid residues that are shared by at least two strains or are unique to specific strains are indicated in different colours. Mutations were considered shared if they affected the same amino acid position even if the change was not identical.
Figure 2—figure supplement 5.
Figure 2—figure supplement 5.. Severe acute respiratory syndrome coronavirus 2 (SARS-CoV-2) neutralisation assay setup.
The 96-well racks of serum samples including controls are serially diluted after an initial dilution of 1:10 to generate four total dilution plates. These are used to treat pre-seeded Vero E6 cells in 384-well assay plates in duplicate before infection with SARS-CoV-2 virus. After immunostaining with DAPI and a 488-conjugated monoclonal antibody against SARS-CoV-2 nucleoprotein, each well is imaged and infection area per area of cells calculated, followed by automated curve fitting and identification of serum dilution factor to achieve 50% neutralisation (IC50).

References

    1. Aitken J, Ambrose K, Barrell S, Beale R, Bineva-Todd G, Biswas D, Byrne R, Caidan S, Cherepanov P, Churchward L, Clark G, Crawford M, Cubitt L, Dearing V, Earl C, Edwards A, Ekin C, Fidanis E, Gaiba A, Gamblin S, Gandhi S, Goldman J, Goldstone R, Grant PR, Greco M, Heaney J, Hindmarsh S, Houlihan CF, Howell M, Hubank M, Hughes D, Instrell R, Jackson D, Jamal-Hanjani M, Jiang M, Johnson M, Jones L, Kanu N, Kassiotis G, Kirk S, Kjaer S, Levett A, Levett L, Levi M, Lu WT, MacRae JI, Matthews J, McCoy LE, Moore C, Moore D, Nastouli E, Nicod J, Nightingale L, Olsen J, O'Reilly N, Pabari A, Papayannopoulos V, Patel N, Peat N, Pollitt M, Ratcliffe P, Reis E Sousa C, Rosa A, Rosenthal R, Roustan C, Rowan A, Shin GY, Snell DM, Song OR, Spyer MJ, Strange A, Swanton C, Turner JMA, Turner M, Wack A, Walker PA, Ward S, Wong WK, Wright J, Wu M, Crick COVID-19 Consortium Scalable and robust SARS-CoV-2 testing in an academic center. Nature Biotechnology. 2020;38:927–931. doi: 10.1038/s41587-020-0588-y. - DOI - PubMed
    1. Brown JC, Goldhill DH, Zhou J, Peacock TP, Frise R, Goonawardane N, Baillon L, Kugathasan R, Pinto A, McKay PF, Hassard J, Moshe M, Singanayagam A, Burgoyne T, Barclay WS. Increased transmission of Sars-Cov-2 lineage b.1.1.7 (Voc 2020212/01) Is not accounted for by a replicative advantage in primary airway cells or antibody escape. bioRxiv. 2021 doi: 10.1101/2021.02.24.432576. - DOI
    1. Cele S, Gazy I, Jackson L, Hwa SH, Tegally H, Lustig G, Giandhari J, Pillay S, Wilkinson E, Naidoo Y, Karim F, Ganga Y, Khan K, Bernstein M, Balazs AB, Gosnell BI, Hanekom W, Moosa MS, Lessells RJ, de Oliveira T, Sigal A, Network for Genomic Surveillance in South Africa. COMMIT-KZN Team Escape of SARS-CoV-2 501Y.V2 from neutralization by convalescent plasma. Nature. 2021;593:142–146. doi: 10.1038/s41586-021-03471-w. - DOI - PMC - PubMed
    1. Diamond M, Chen R, Xie X, Case J, Zhang X, VanBlargan L, Liu Y, Liu J, Errico J, Winkler E, Suryadevara N, Tahan S, Turner J, Kim W, Schmitz A, Thapa M, Wang D, Boon A, Pinto D, Presti R. Sars-Cov-2 variants show resistance to neutralization by many monoclonal and Serum-Derived polyclonal antibodies. Research Square. 2021;5:228079. doi: 10.21203/rs.3.rs-228079/v. - DOI - PMC - PubMed
    1. Edara VV, Norwood C, Floyd K, Lai L, Davis-Gardner ME, Hudson WH, Mantus G, Nyhoff LE, Adelman MW, Fineman R, Patel S, Byram R, Gomes DN, Michael G, Abdullahi H, Beydoun N, Panganiban B, McNair N, Hellmeister K, Pitts J. Reduced binding and neutralization of infection- and Vaccine-Induced antibodies to the b.1.351 (South african) Sars-Cov-2 variant. bioRxiv. 2021 doi: 10.1101/2021.02.20.432046. - DOI - PMC - PubMed

Publication types

Substances