. 2021 Dec;89(12):1824-1833.
doi: 10.1002/prot.26197. Epub 2021 Aug 23.

Protein oligomer modeling guided by predicted interchain contacts in CASP14

Affiliations

Protein oligomer modeling guided by predicted interchain contacts in CASP14

Minkyung Baek et al. Proteins. 2021 Dec.

Abstract

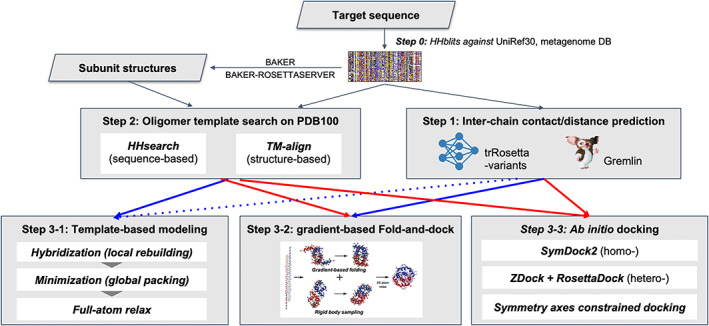
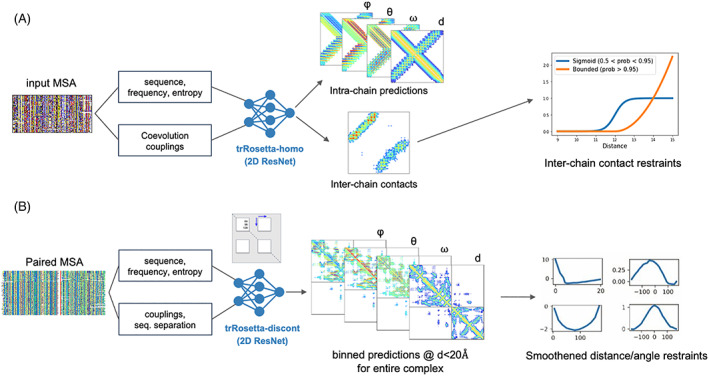
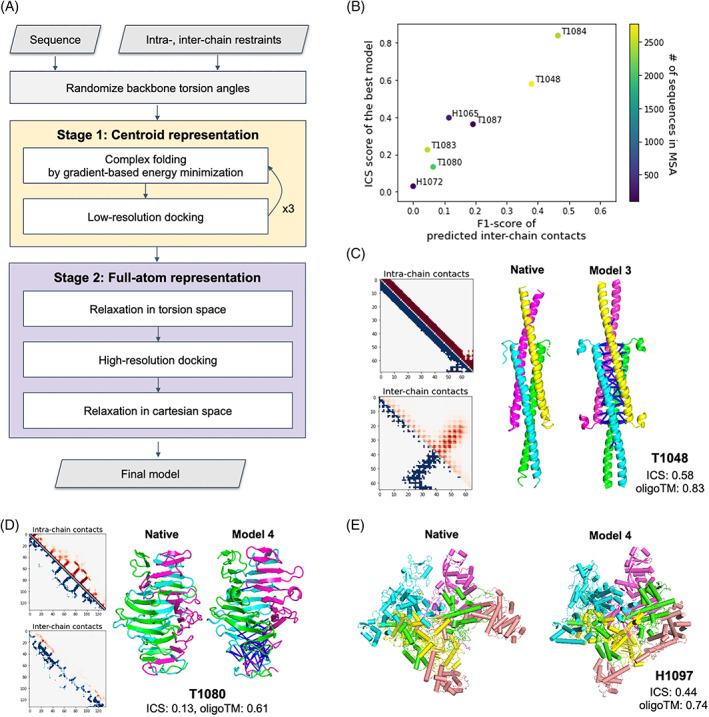
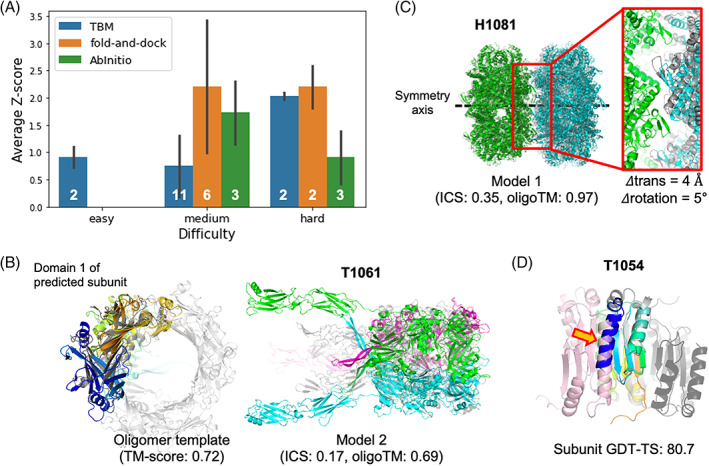
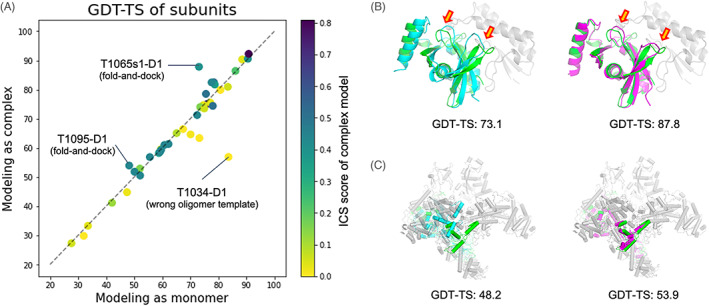
For CASP14, we developed deep learning-based methods for predicting homo-oligomeric and hetero-oligomeric contacts and used them for oligomer modeling. To build structure models, we developed an oligomer structure generation method that utilizes predicted interchain contacts to guide iterative restrained minimization from random backbone structures. We supplemented this gradient-based fold-and-dock method with template-based and ab initio docking approaches using deep learning-based subunit predictions on 29 assembly targets. These methods produced oligomer models with summed Z-scores 5.5 units higher than the next best group, with the fold-and-dock method having the best relative performance. Over the eight targets for which this method was used, the best of the five submitted models had average oligomer TM-score of 0.71 (average oligomer TM-score of the next best group: 0.64), and explicit modeling of inter-subunit interactions improved modeling of six out of 40 individual domains (ΔGDT-TS > 2.0).

Keywords: deep learning; interchain contact prediction; protein complex structure prediction; protein-protien docking.


Conflict of interest statement

The authors declare no conflict of interest.

Figures

FIGURE 1
FIGURE 1
The oligomer structure modeling procedure used by the BAKER‐experimental group
FIGURE 2
FIGURE 2
Deep learning‐based residue pairwise interaction prediction for (A) homo‐oligomers (trRosetta‐homo) and (B) hetero‐oligomers (trRosetta‐discont)
FIGURE 3
FIGURE 3
Performance of the gradient‐based fold‐and‐dock method. (A) Schematic outline of the fold‐and‐dock procedure consisting of two stages: repetitive folding and docking in centroid representation followed by full‐atom docking and relaxation. (B) Correlation between the quality of predicted interchain contacts and that of modeled interfaces. (C,D) Examples of successful predictions using gradient‐based fold‐and‐dock methods with predicted interchain contacts. Predicted intrachain distances and interchain contacts are shown in the upper diagonal (colored in red) of 2D maps while those from native structures are shown in the lower diagonal (colored in blue). The correctly predicted interchain contacts are shown as blue lines in the model structures. Both native and model structures are colored by chains. (E) Native and the best prediction submitted as model 4 for H1097
FIGURE 4
FIGURE 4
Oligomer modeling performance of BAKER‐experimental group. (A) The relative performance in terms of average Z‐score for the best out of five submissions for each target difficulty and modeling strategy we used. (B) A successful example (T1061) of template‐based approach by detecting a distant oligomer template based on structural similarity. Left; The subunit structure (colored in rainbow) used to search oligomer templates and the detected template (colored in gray, PDB ID: 3CDD) are shown. Right; The predicted structure (submitted as model 2) is shown with the native structure colored in gray. (C) A successful example (H1081) of ab initio docking with a constraint to match symmetry axes of two subunits. The native structure is colored in gray. (D) A failed example (T1054) to generate a correct binding pose by ab initio docking with the subunit structure (colored in rainbow colors from the N‐terminus in blue to the C‐terminus in red) having high GDT‐TS. The problematic N‐terminal helix is highlighted by an orange arrow. The correct binding pose is colored in pink while the predicted one is colored in dark gray
FIGURE 5
FIGURE 5
Comparison of subunit structures modeled as complexes to those modeled as monomers. (A) Head‐to‐head comparison of the subunit qualities in terms of the evaluation unit‐wise GDT‐TS score. Dots are colored by the ICS score of predicted complex structures. (B and C) Two successful examples (T1065s1‐D1 and T1095‐D1) where modeling in oligomer contexts generated better subunit structures. The native structure of the target subunit and its binding partners are shown in green and gray, respectively. The subunit structures predicted as a monomer are shown in cyan (left), while those predicted in oligomer contexts are colored in magenta (right)

References

    1. Berggård T, Linse S, James P. Methods for the detection and analysis of protein‐protein interactions. Proteomics. 2007;7(16):2833‐2842. - PubMed
    1. Keskin O, Tuncbag N, Gursoy A. Predicting protein‐protein interactions from the molecular to the proteome level. Chem Rev. 2016;116(8):4884‐4909. - PubMed
    1. Goodsell DS, Olson AJ. Structural symmetry and protein function. Annu Rev Biophys Biomol Struct. 2000;29:105‐153. - PubMed
    1. Baek M, Park T, Heo L, Park C, Seok C. GalaxyHomomer: a web server for protein homo‐oligomer structure prediction from a monomer sequence or structure. Nucleic Acids Res. 2017;45(W1):W320‐W324. - PMC - PubMed
    1. Bertoni M, Kiefer F, Biasini M, Bordoli L, Schwede T. Modeling protein quaternary structure of homo‐ and hetero‐oligomers beyond binary interactions by homology. Sci Rep. 2017;7(1):10480. - PMC - PubMed

Publication types

LinkOut - more resources