. 2022 Feb;69(2):528-536.
doi: 10.1109/TBME.2021.3100770. Epub 2022 Jan 21.

Magnetic Field Mapping and Correction for Moving OP-MEG

Magnetic Field Mapping and Correction for Moving OP-MEG

Stephanie Mellor et al. IEEE Trans Biomed Eng. 2022 Feb.

Abstract

Background: Optically pumped magnetometers (OPMs) have made moving, wearable magnetoencephalography (MEG) possible. The OPMs typically used for MEG require a low background magnetic field to operate, which is achieved using both passive and active magnetic shielding. However, the background magnetic field is never truly zero Tesla, and so the field at each of the OPMs changes as the participant moves. This leads to position and orientation dependent changes in the measurements, which manifest as low frequency artefacts in MEG data.

Objective: We model the spatial variation in the magnetic field and use the model to predict the movement artefact found in a dataset.

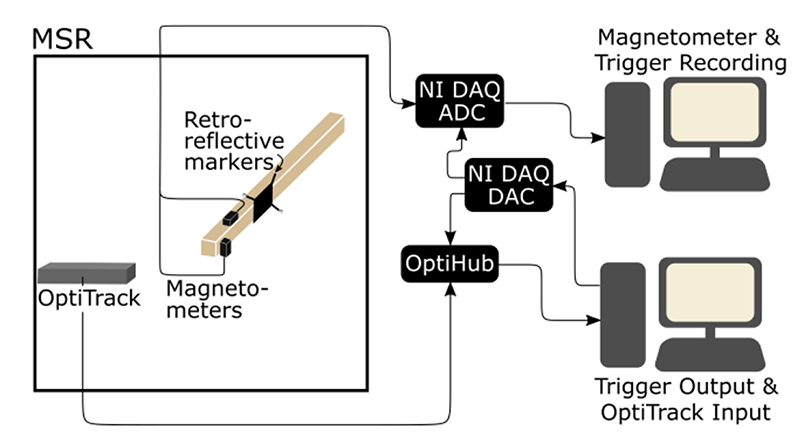
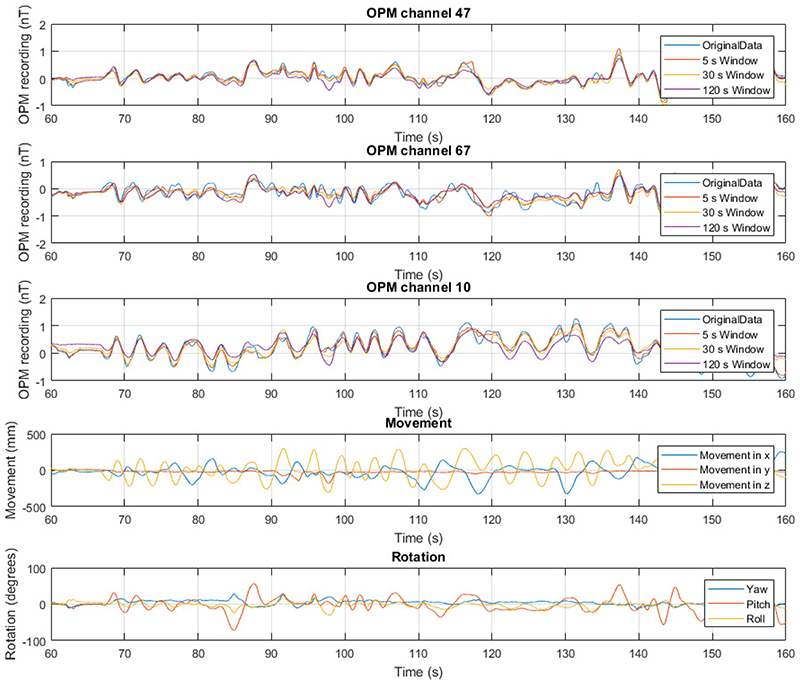
Methods: We demonstrate a method for modelling this field with a triaxial magnetometer, then show that we can use the same technique to predict the movement artefact in a real OPM-based MEG (OP-MEG) dataset.

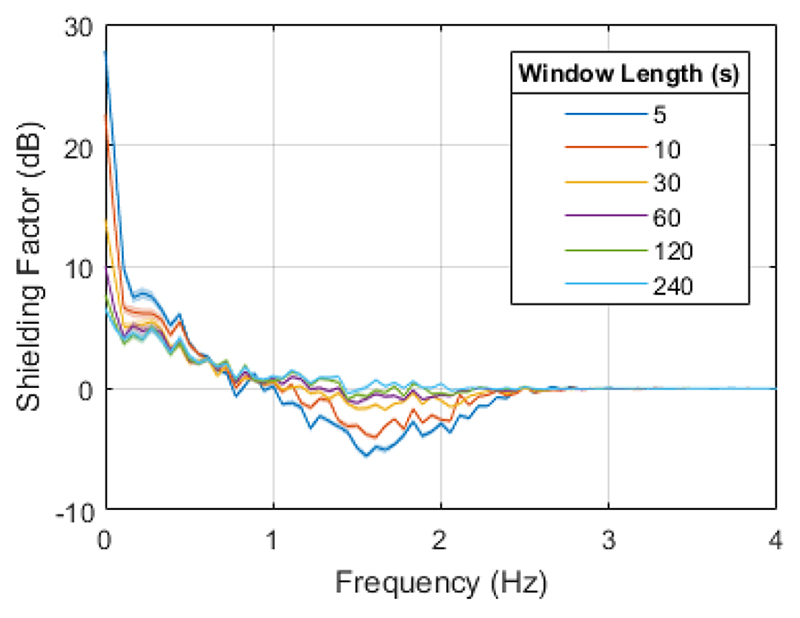
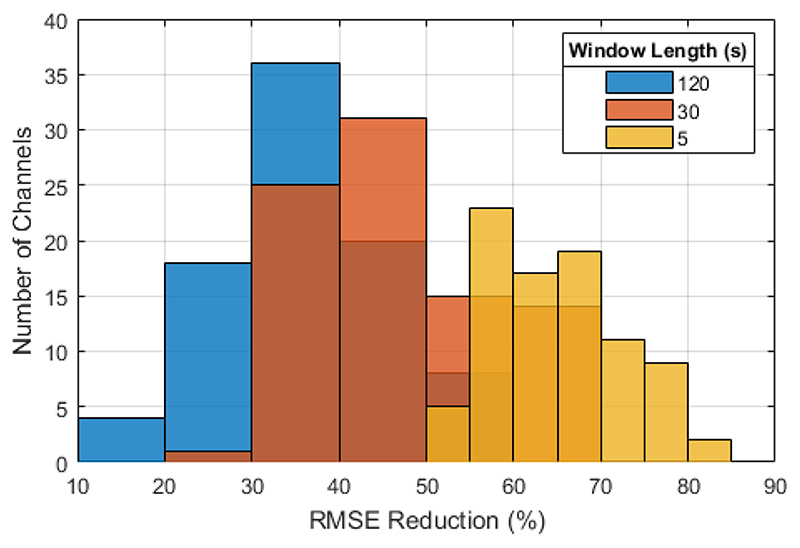
Results: Using an 86-channel OP-MEG system, we found that this modelling method maximally reduced the power spectral density of the data by 27.8 ± 0.6 dB at 0 Hz, when applied over 5 s non-overlapping windows.

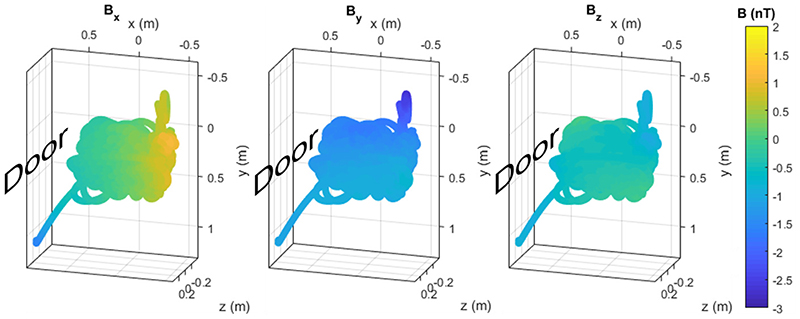
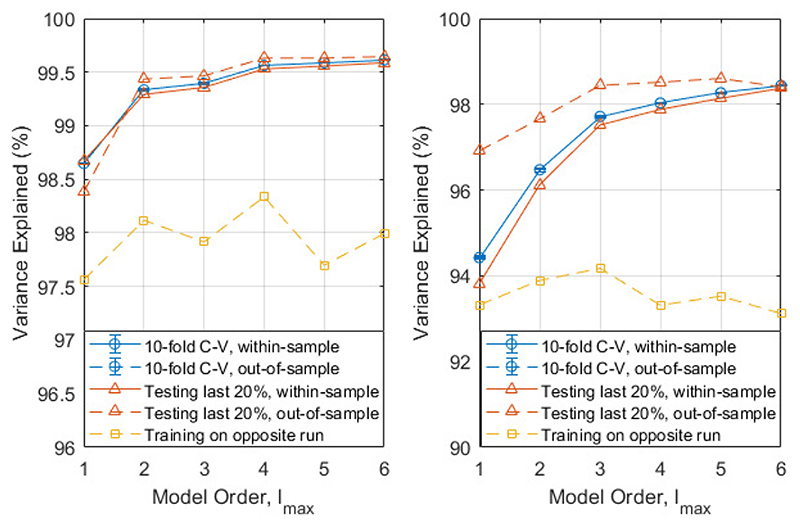
Conclusion: The magnetic field inside our state-of-the art magnetically shielded room can be well described by low-order spherical harmonic functions. We achieved a large reduction in movement noise when we applied this model to OP-MEG data.

Significance: Real-time implementation of this method could reduce passive shielding requirements for OP-MEG recording and allow the measurement of low-frequency brain activity during natural participant movement.


Figures

Fig. 1
Fig. 1
Field Mapping system set up. In the triaxial experiment, the position and orientation of two magnetometers were tracked optically, while the field along two of their axes were recorded. These two datastreams (magnetic field and position/orientation) were synchronously recorded.
Fig. 2
Fig. 2. Photographs of the experimental set-up, showing the OPMs and retroreflective markers for position tracking, taken from opposite directions.
Fig. 3
Fig. 3
Position of each of the OPMs (black cuboids) and retroreflective markers (blue circles) in the auditory experiment. The participant’s head is represented by the grey mesh.
Fig. 4
Fig. 4
Background magnetic field in the Magnetic Shields Limited (MSL) MSR at UCL at the mean OPM position during the first run of the triaxial experiment, according to a 3rd order real spherical harmonic model. The three columns are the three magnetic field components. In each, the direction of the MSR door is indicated. The graphs are oriented to be representative of the room such that down the page is nearer to the ground in the room. The two trails coming out of the main space - bottom left and top right - are, respectively, caused by the magnetometer being picked up off the table at the start of the experiment and moving it nearer the camera (to see how this affected the field). The equivalent figure for the second run of this experiment and for the OP-MEG experiment is shown in Supplementary Fig. 3.
Fig. 5
Fig. 5
Variance explained ( R 2) by different order spherical harmonic models in three different analyses: 10-fold cross-validation (blue circles), training on the first 80% of the data (orange triangles) and training on the opposite run (yellow squares). The within-sample (testing and training data are the same) variance explained is given by complete lines, the out-of-sample (testing and training data are different) variance explained is given a dashed line. The two recordings are shown on separate graphs. Run 1 (left) was recorded first, then run 2 (right) recorded 20 minutes later. Note the different scales on the two graphs.
Fig. 6
Fig. 6
Example OPM recordings (first three rows) and corresponding movement information (last two rows) for the participant experiment. In the OPM recordings, the measured data is shown in blue. The model predictions for a second order model with three window lengths is shown: 5 s (orange), 30 s (yellow) and 120 s (purple). The equivalent measured minus modelled recordings are shown in Supplementary Fig. 6. The position information is shown as the movement (position minus starting position, 4th row) and rotation (bottom) of the scanner-cast during the field mapping recording. In the movement panel, the x (blue), y (orange) and z (yellow) components of the position of the scanner cast in the same room-based coordinate system as the triaxial recording are shown. The bottom panel shows the pitch (blue), roll (orange) and yaw (yellow) of the scanner-cast, as recorded by the OptiTrack camera.
Fig. 7
Fig. 7
Shielding factor for a 2nd order spherical harmonic model on the OP-MEG recording for different window lengths. The values shown are the mean over all channels, with the width of the line given by the standard error of the mean.
Fig. 8
Fig. 8. The RMS noise reduction for 120 s, 30 s and 5 s sliding modelling windows as a histogram of the values for different channels.

References

    1. Hämäläinen M, et al. Magnetoencephalography theory, instrumentation, and applications to noninvasive studies of the working human brain. Rev Mod Phys. 1993 Apr;65(2):413–497.
    1. Sander TH, Preusser J, Mhaskar R, Kitching J, Trahms L, Knappe S. Magnetoencephalography with a chip-scale atomic magnetometer. Biomed Opt Express. 2012 May;3(5):981. - PMC - PubMed
    1. Knappe S, Alem O, Sheng D, Kitching J. Microfabricated Optically-Pumped Magnetometers for Biomagnetic Applications. Journal of Physics: Conference Series. 2016
    1. Alem O, Benison AM, Barth DS, Kitching J, Knappe S. Magnetoencephalography of Epilepsy with a Microfabricated Atomic Magnetrode. J Neurosci. 2014 Oct;34(43):14324–14327. - PMC - PubMed
    1. Xia H, Ben-Amar Baranga A, Hoffman D, Romalis MV. Magnetoencephalography with an atomic magnetometer. Appl Phys Lett. 2006 Nov;89(21):211104

Publication types