. 2021 Sep 8;6(17):e140173.
doi: 10.1172/jci.insight.140173.

Creatine transporter deficiency impairs stress adaptation and brain energetics homeostasis

Affiliations

Creatine transporter deficiency impairs stress adaptation and brain energetics homeostasis

Hong-Ru Chen et al. JCI Insight. .

Abstract

The creatine transporter (CrT) maintains brain creatine (Cr) levels, but the effects of its deficiency on energetics adaptation under stress remain unclear. There are also no effective treatments for CrT deficiency, the second most common cause of X-linked intellectual disabilities. Herein, we examined the consequences of CrT deficiency in brain energetics and stress-adaptation responses plus the effects of intranasal Cr supplementation. We found that CrT-deficient (CrT-/y) mice harbored dendritic spine and synaptic dysgenesis. Nurtured newborn CrT-/y mice maintained baseline brain ATP levels, with a trend toward signaling imbalance between the p-AMPK/autophagy and mTOR pathways. Starvation elevated the signaling imbalance and reduced brain ATP levels in P3 CrT-/y mice. Similarly, CrT-/y neurons and P10 CrT-/y mice showed an imbalance between autophagy and mTOR signaling pathways and greater susceptibility to cerebral hypoxia-ischemia and ischemic insults. Notably, intranasal administration of Cr after cerebral ischemia increased the brain Cr/N-acetylaspartate ratio, partially averted the signaling imbalance, and reduced infarct size more potently than intraperitoneal Cr injection. These findings suggest important functions for CrT and Cr in preserving the homeostasis of brain energetics in stress conditions. Moreover, intranasal Cr supplementation may be an effective treatment for congenital CrT deficiency and acute brain injury.

Keywords: Autophagy; Bioenergetics; Metabolism; Neurological disorders; Neuroscience.


Conflict of interest statement

Conflict of interest: The authors have declared that no conflict of interest exists.

Figures

Figure 1
Figure 1. Generation of CrT-null mice.
(A) The scheme to generate CrT-null (CrT–/y) mice using the knockout-first strategy via an ES cell line from the NIH KOMP Repository (CSD24513). The locations of PCR primers to detect the CrT-targeted genomic allele are indicated. (B) Schematic of primer design for RT-qPCR analysis of different regions of the CrT (Slc6a8) mRNA. (C) PCR analysis of the genomic DNA of CrT+/y and CrT–/y mice to verify the wild-type and knockout alleles. The RT-PCR product (243 bp) from primers F3 and R3 corresponds to the region overlapping exon 3 and exon 4 sequences of both CrT+/y and CrT–/y cDNA; the 344 bp and 220 bp RT-qPCR products from primers F4 and R4 and F2 and R2, respectively, correspond to the region overlapping exon 5 to exon 10, which was missing in the CrT–/y cDNA. (D) PCR analysis of different regions of the CrT mRNA of CrT+/y and CrT–/y mice. (E) RT-qPCR showed the absence of full-length CrT mRNAs in the brain, heart, liver, skeletal muscles, and kidney in CrT–/y mice (n = 4). (F and G) Proton–HR-MAS NMR showed severe reduction in Cr/PCr peaks in the brain (arrows and asterisks), but not the testis, of CrT–/y mice (n = 5 for each genotype). All data are shown as mean ± SEM. All P values were determined by Student’s t test.
Figure 2
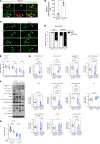
Figure 2. Dendritic spine dysgenesis and synaptic reduction in CrT–/y mice.
(A and B) CrT+/– and Thy1-YFP mice were crossed to assist visualization of dendritic spines in the cortical layer V neurons in CrT+/y versus CrT–/y mice. (A) Shown are typical images of dendritic spines in 3-month-old Thy1-YFP; CrT+/y and Thy1-YFP; CrT–/y mice. Scale bar: 5 μm. (B) Thy1-YFP; CrT–/y mice (n = 5) showed significantly lower spinal density than Thy1-YFP; CrT+/y mice (n = 3). (C) Spine classification by Imaris software revealed a reduction in the mature, mushroom subtype and an increase in the immature, thin subtype in Thy1-YFP; CrT–/y neurons. (D and E) Immunoblotting showed significant reduction in postsynaptic proteins (PSD-95 and Homer1), but not presynaptic synaptotagmin (Syn) in the hippocampus of 3-month-old CrT–/y mice compared with CrT+/y mice (n = 5 for each genotype). (F and G) Confocal laser microscopy showed reduced synaptic densities (colocalized anti-Syn and anti–PSD-95 puncta) in CA1 hippocampal neurons in CrT–/y mice compared with CrT+/y mice (n = 3 for each genotype). Scale bar: 50 μm. All data are shown as mean ± SEM. All P values were determined by Student’s t test.
Figure 3
Figure 3. Imbalance between p-AMPK/autophagy and mTOR signaling in CrT–/y neonates.
(A) EM showed more membrane whorls (arrows) and large lucid cytoplasm (pink-colored) in the neocortical neuropil of 3-day-old CrT–/y mice, particularly after 12 hours of starvation/separation from the dam (n = 3 for each condition). The numbering 1–4 for the indicated condition is used in all panels of this figure. Scale bar: 1 μm. (B) Immunoblot detection of AGAT and GAMT in P3 CrT+/y and CrT–/y mice (n > 3 for each). Note the expression of AGAT and GAMT in P3 mouse brains with or without starvation, but not in the adult brain. (C) LC-MS measurement of the brain ATP, Cr, and PCr levels in P3 CrT+/y and CrT–/y neonates with or without starvation (n = 5 for each group). (D and E) Immunoblotting analysis and quantification of the p-AMPK/autophagy and mTOR signaling pathways in P3 CrT+/y and CrT-/y mouse brains, with or without starvation as indicated (n = 4 for each). The violin plots in E are representative of 3 independent experiments, with n = 4 biological replicates; all other data are shown as mean ± SEM. All statistical analyses were performed using 2-way ANOVA followed by Tukey’s multiple comparison post hoc test.
Figure 4
Figure 4. CrT deficiency increases mitochondrial ROS and reduces neuronal viability after oxygen-glucose deprivation.
(A and B) CrT+/y and CrT–/y cortical neurons were stained with MitoTracker and 4 μM MitoSox Red and visualized by fluorescence microscopy after challenge with 2 hours of oxygen-glucose deprivation (OGD). Mitochondrial ROS production was quantified by measurement of MitoSOX fluorescence intensity. The mitochondrial subcellular location of MitoSOX was visualized by colabeling with MitoTracker Green using a Leica SP8 confocal microscope. n = 3 sets of cultures. Scale bar: 10 μm. (C and D) Control CrT+/y cortical neurons exhibited normal long/tubular mitochondrial morphology, whereas those exposed to 2 hours of OGD showed increased short/mitochondrial fragmentation in a time-dependent manner. CrT–/y cortical neurons showed increased short/mitochondrial fragmentation both in normoxia (Nor) and after OGD compared with CrT+/y neurons. The mitochondrial morphology was visualized by MitoTracker Green. Note the presence of long (arrows) and short mitochondria (arrowheads). Scale bar: 10 μm. (E) CrT–/y cortical neurons showed reduced viability after 4- or 8-hour OGD, followed by a 20- or 16-hour recovery, respectively, compared with CrT+/y neurons (n = 3–7 sets of cultures). (F and G) Immunoblot analysis and quantification of the p-AMPK/autophagy and mTOR signaling pathway activity in CrT+/y and CrT–/y cortical neurons in normoxia (Nor) or 4 hours after OGD (n = 3 for each condition). (H) Influence of autophagy inhibitor 3-MA on cell viability of OGD-challenged CrT+/y and CrT–/y cortical neurons. Violin plots in E, G, and H are representative of 3 independent experiments, with n = 3–7 (E) or 3 (G and H) biological replicates; all other data are shown as mean ± SEM. Statistical significance was determined using Student’s t test (B and D), 1-way ANOVA followed by Tukey’s multiple comparisons post hoc test (E), or 2-way ANOVA followed by Tukey’s multiple comparisons post hoc test (G and H).
Figure 5
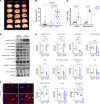
Figure 5. CrT deficiency increases brain damage after neonatal hypoxic-ischemic (HI) insult.
(A and B) Representative brain sections and quantification of brain tissue loss in CrT+/y, CrT+/–, and CrT–/y mice 7 days after neonatal HI (n = 5–11 for each group, as indicated). (C) Quantification of TUNEL+ cell death in the ipsilateral cerebral cortex and hippocampus in CrT+/y versus CrT–/y mouse brains 24 hours after neonatal HI (n = 3 for each). (D and E) Immunoblotting and quantification of the p-AMPK/autophagy and mTOR signaling pathway activity in the contralateral or ipsilateral (Con or Ipsi) hemisphere of P10 CrT+/y versus CrT–/y neonates 24 hours after unilateral HI. The violin plots in E are representative of 3 independent experiments, with n = 3 biological replicates; all other data are shown as mean ± SEM. Statistical significance was determined using 1-way ANOVA with Tukey’s multiple comparison post hoc test (B), Student’s t test (C), or 2-way ANOVA followed by Tukey’s multiple comparison post hoc test (E). (F) Anti-LC3B staining of HI-injured CrT+/y versus CrT–/y mouse brains at 24 hours of recovery (n = 5 for each). Scale bar: 20 μm.
Figure 6
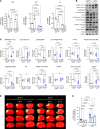
Figure 6. CrT deficiency causes greater infarct and ATP depletion after cerebral ischemia.
(A) LC-MS quantification of the brain ATP, Cr, and PCr levels in contralateral (Con) and ipsilateral (Ipsi) hemispheres in CrT+/y versus CrT–/y mice 24 hours after photoactivation (n = 4 for each). (B and C) Immunoblotting and quantification of the p-AMPK/autophagy and mTOR signaling pathway activity in P16 CrT+/y versus CrT–/y mice 24 hours after photoactivation directed at the proximal branch of the middle cerebral artery. The protein expression levels in the contralateral hemisphere of CrT+/y mice were used as the baseline. (D and E) Representative brain sections and quantification of the infarct size in untreated CrT+/y (n = 10) and CrT–/y mice (n = 14), intranasal 184 mg/kg Cr–treated CrT+/y (n = 12) and CrT–/y mice (n = 11), and intraperitoneal 200 mg/kg Cr–treated CrT+/y (n = 7) and CrT–/y mice at 16 days of age (n = 9). The intranasal and intraperitoneal Cr treatment was administered within 30 minutes after photoactivation. The violin plots in C are representative of 3 independent experiments, with n = 3 biological replicates; all other data are shown as mean ± SEM. All statistical analyses were performed using 2-way ANOVA followed by Tukey’s multiple comparison post hoc test. IN, intranasal; IP, intraperitoneal.
Figure 7
Figure 7. Proton–HR-MAS NMR showed elevation of brain Cr/PCr peaks by intranasal Cr treatment at cerebral ischemia.
Proton–HR-MAS NMR analysis was performed to compare the contralateral (A and B) and ipsilateral (C and D) cerebral cortices of CrT+/y and CrT–/y mice 24 hours after photothrombosis. This analysis showed that intranasal Cr treatment elevated the Cr/PCr peaks and increased the Cr/NAA ratio in both contralateral and ipsilateral cortices of CrT–/y mice, while its effects on CrT+/y were minimal. The violin plots are representative of 3 independent experiments, with n = 3 biological replicates. All statistical analyses were performed using 2-way ANOVA followed by Tukey’s multiple comparison post hoc test.
Figure 8
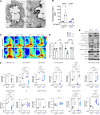
Figure 8. Post-stroke intranasal Cr delivery reduces brain injury and signaling imbalance.
(A) CrT distribution in murine brain based on anti-CrT/anti–β-galactosidase immuno-EM labeling in CrT+/– mice. Arrows indicate robust immunoreaction deposits on the extracellular surface of endothelial cells in the blood vessel lumen (bvl) and endothelial basement membrane (bm). Scale bars: 1 μm. (B) CrT–/y neurons internalized Cr from the medium containing 500 μM Cr at approximately 40% efficiency compared with CrT+/y neurons (n = 3). (C and D) Cerebral blood flow (CBF) was evaluated by laser speckle contrast imaging (LSCI) immediately after photothrombosis and reassessed 24 hours later in CrT+/y and CrT–/y mice, with or without intranasal Cr supplementation (n = 4 for each condition). (E and F) Immunoblotting and quantification of the p-AMPK/autophagy and mTOR signaling pathway activity in stroke-injured CrT+/y and CrT–/y hemispheres, with or without intranasal Cr supplementation, at 24 hours of recovery. Intranasal Cr supplementation showed significant attenuation of stroke-induced p-AMPK/autophagy signaling and better-preserved mTOR activity. The violin plots in F are from 3 independent experiments; all other data are shown as mean ± SEM. Statistical significance was determined using Student’s t test (B) or 2-way ANOVA followed by Tukey’s multiple comparison post hoc test (D and F).
Figure 9
Figure 9. Potential functions of Cr and CrT in brain energetics and signaling homeostasis.
Schematic depictions of (A) the PCr-mediated ATP regeneration and the default mTOR signaling responses under normal conditions (in the black text and arrows, respectively) and (B) the Cr biosynthesis pathway and the consequences of CrT deficiency (in red text and arrow).

References

    1. Wyss M, Kaddurah-Daouk R. Creatine and creatinine metabolism. Physiol Rev. 2000;80(3):1107–1213. doi: 10.1152/physrev.2000.80.3.1107. - DOI - PubMed
    1. Brosnan JT, Brosnan ME. Creatine: endogenous metabolite, dietary, and therapeutic supplement. Annu Rev Nutr. 2007;27:241–261. doi: 10.1146/annurev.nutr.27.061406.093621. - DOI - PubMed
    1. Bessman SP, Geiger PJ. Transport of energy in muscle: the phosphorylcreatine shuttle. Science. 1981;211(4481):448–452. doi: 10.1126/science.6450446. - DOI - PubMed
    1. Cunnane SC, et al. Brain energy rescue: an emerging therapeutic concept for neurodegenerative disorders of ageing. Nat Rev Drug Discov. 2020;19(9):609–633. doi: 10.1038/s41573-020-0072-x. - DOI - PMC - PubMed
    1. Marques EP, Wyse ATS. Creatine as a neuroprotector: an actor that can play many parts. Neurotox Res. 2019;36(2):411–423. doi: 10.1007/s12640-019-00053-7. - DOI - PubMed

Publication types

MeSH terms

Supplementary concepts