. 2021 Jul 29;17(7):e1009231.
doi: 10.1371/journal.pcbi.1009231. eCollection 2021 Jul.

A Keller-Segel model for C elegans L1 aggregation

Affiliations

A Keller-Segel model for C elegans L1 aggregation

Leon Avery et al. PLoS Comput Biol. .

Abstract

We describe a mathematical model for the aggregation of starved first-stage C elegans larvae (L1s). We propose that starved L1s produce and respond chemotactically to two labile diffusible chemical signals, a short-range attractant and a longer range repellent. This model takes the mathematical form of three coupled partial differential equations, one that describes the movement of the worms and one for each of the chemical signals. Numerical solution of these equations produced a pattern of aggregates that resembled that of worm aggregates observed in experiments. We also describe the identification of a sensory receptor gene, srh-2, whose expression is induced under conditions that promote L1 aggregation. Worms whose srh-2 gene has been knocked out form irregularly shaped aggregates. Our model suggests this phenotype may be explained by the mutant worms slowing their movement more quickly than the wild type.


Conflict of interest statement

The authors have declared that no competing interests exist.

Figures
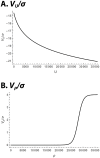
Fig 1
Fig 1. Potential function plots.
Potential functions that appear in the ρ PDE (2). Both potentials are made dimensionless by dividing them by σ. Parameter values are as in Table 2.
Fig 2
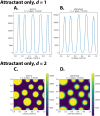
Fig 2. Simulation of the attractant-only model.
This figure shows the state of a numerical simulation of the attractant-only model after 20 0000 s (2 days and 7 hours). The initial condition was a uniform worm density of ρ¯=9000cmd, perturbed by normally distributed random noise of standard deviation 1% (i.e. 90 cm−d). (The entire time courses can be seen in S2 and S3 Videos in the Supporting Information.) S1 Fig shows results at t = 200 000 s and t = 1 × 10⁷ s (116 days) of ten independent runs of the same simulation with different pseudorandom noise in the initial condition. Panels A, B show the results of simulations in one-dimensional space; C, D show results in two-dimensional space. A, C show density ρ; B, D show attractant concentration U. The two numbers below each plot are the minimum and maximum values of the plotted function over the entire 1 cm × 1 cm domain. The spatial units are centimeters.
Fig 3
Fig 3. Attractant+repellent simulation.
Panels A, D show density ρ, B, E show attractant concentration Ua, and C, F show repellent concentration Ur. The spatial units are centimeters. The two numbers below each plot are the minimum and maximum values of the plotted function over the entire 1 cm × 1 cm domain. Note the different scale of the attractant and repellent plots. The means are the same, but because repellent is a longer-range signal, it is smoothed much more by diffusion and varies less than attractant. (S4 and S5 Videos show the full time courses for these simulations. S2 Fig shows ten independent solutions of the two-dimensional system with different pseudorandom noise at time 0.)
Fig 4
Fig 4. srh–2 knockout L1 aggregation.
Starved L1s of mutant worms lacking a functional srh–2 gene aggregate, but the aggregates they form are irregularly shaped (the animal crackers phenotype). srh–2 encodes a G–protein coupled receptor expressed in starving L1s.
Fig 5
Fig 5. Attractant+repellent simulation with slowdown.
Worm density ρ(t, x) of a slowdown model simulation at t = 200 000 s for four different values of τ.
Fig 6
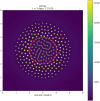
Fig 6. Full-scale attractant+repellent simulation.
Simulation of the attractant+repellent model on a 6 × 6 cm domain. The simulation began with 68 400 worms in a 2 cm diameter circle at the center of the plate (inner red circle). (S6 Video shows the entire time course.) The spatial units are centimeters. The two numbers below the plot are the minimum and maximum values of the plotted function over the entire 6 cm × 6 cm domain. Density is muted in a central 2 cm diameter circle, corresponding to where the worms were initially placed, to suggest the region in which we think influences not included in our model might be important.
Fig 7
Fig 7. Spectral comparison of experimental and simulation results.
A. Last frame of aggregation video S1 Video, cropped to a square to facilitate Fourier analysis. This square is 1.93 cm in size. B. Final time point of the full-scale simulation Fig 6, cropped and scaled to match A as closely as possible, with a corresponding central mass added. C. The central mass alone. D. Low-frequency region of the two-dimensional power spectrum of the discrete Fourier transform of image A. The power scale is truncated at 10 AU (arbitrary units) E. Low-frequency region of the power spectrum of image B. The power scale is truncated at 20 AU. F. Radially summed power spectra of images A,B, and C. Peaks of the experimental image spectrum are picked out in blue.

References

    1. Barr MM, Garcia LR. Male mating behavior.; 2006. - PMC - PubMed
    1. Artyukhin AB, Yim JJ, Cheong MC, Avery L. Starvation-induced collective behavior in C. elegans. Scientific reports. 2015;5:10647. doi: 10.1038/srep10647 - DOI - PMC - PubMed
    1. de Bono M, Bargmann CI. Natural variation in a neuropeptide Y receptor homolog modifies social behavior and food response in C. elegans. Cell. 1998;94(5):679–689. doi: 10.1016/S0092-8674(00)81609-8 - DOI - PubMed
    1. de Bono M, Tobin DM, Davis MW, Avery L, Bargmann CI. Social feeding in Caenorhabditis elegans is induced by neurons that detect aversive stimuli. Nature. 2002;419(6910):899–903. doi: 10.1038/nature01169 - DOI - PMC - PubMed
    1. Rogers C, Persson A, Cheung B, de Bono M. Behavioral motifs and neural pathways coordinating O2 responses and aggregation in C. elegans. Curr Biol. 2006;16(7):649–659. doi: 10.1016/j.cub.2006.03.023 - DOI - PubMed

Publication types

MeSH terms

Substances