. 2021 Nov 4;138(18):1691-1704.
doi: 10.1182/blood.2021011682.

An erythroid-to-myeloid cell fate conversion is elicited by LSD1 inactivation

Affiliations

An erythroid-to-myeloid cell fate conversion is elicited by LSD1 inactivation

Lei Yu et al. Blood. .

Abstract

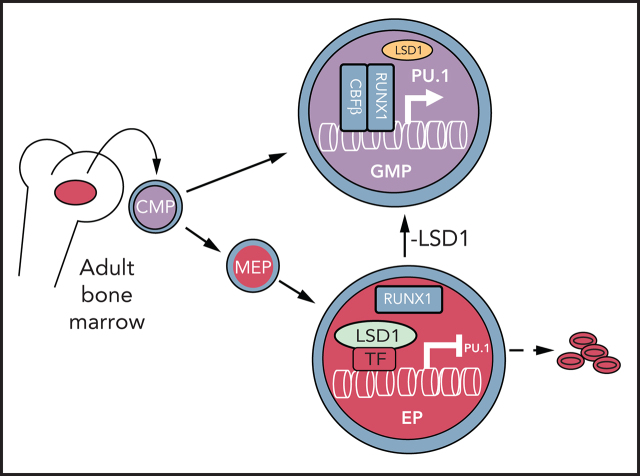
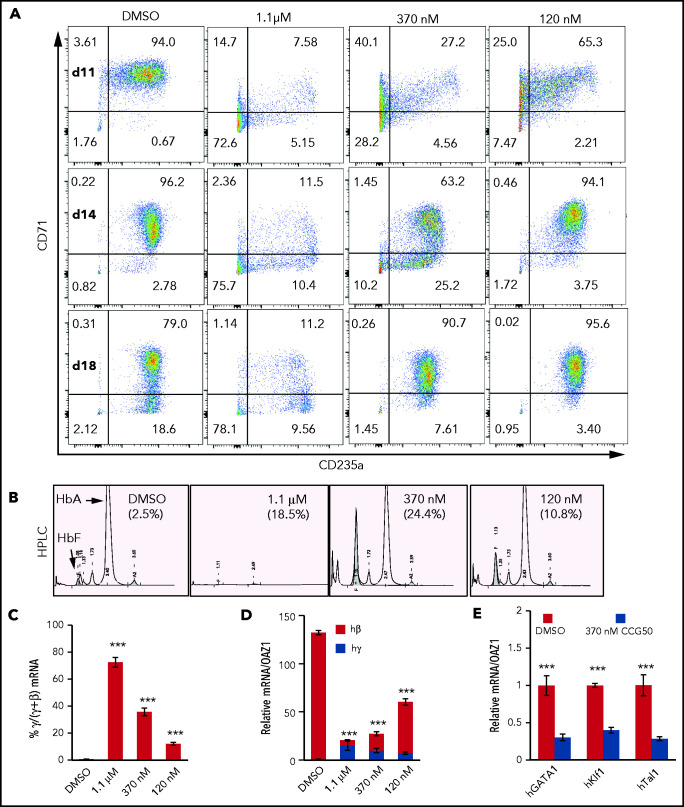
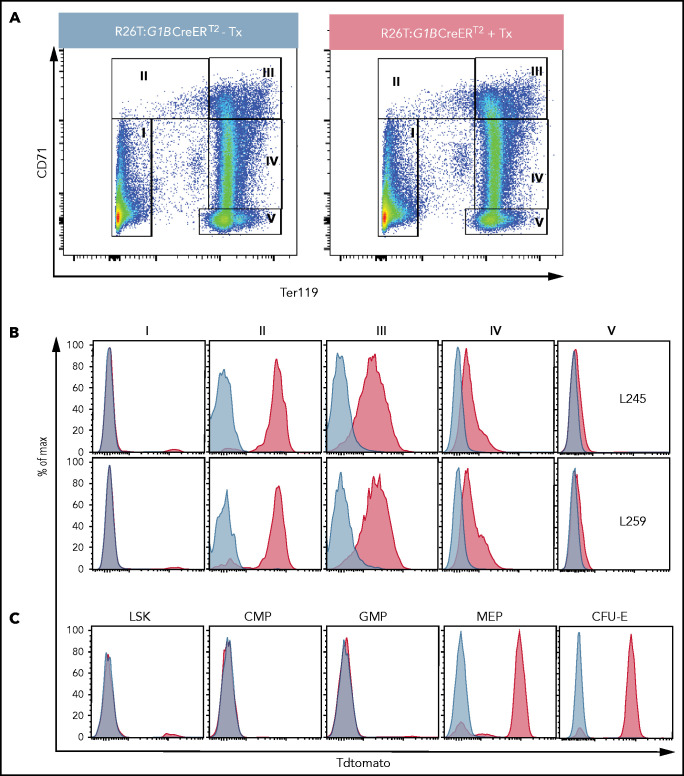
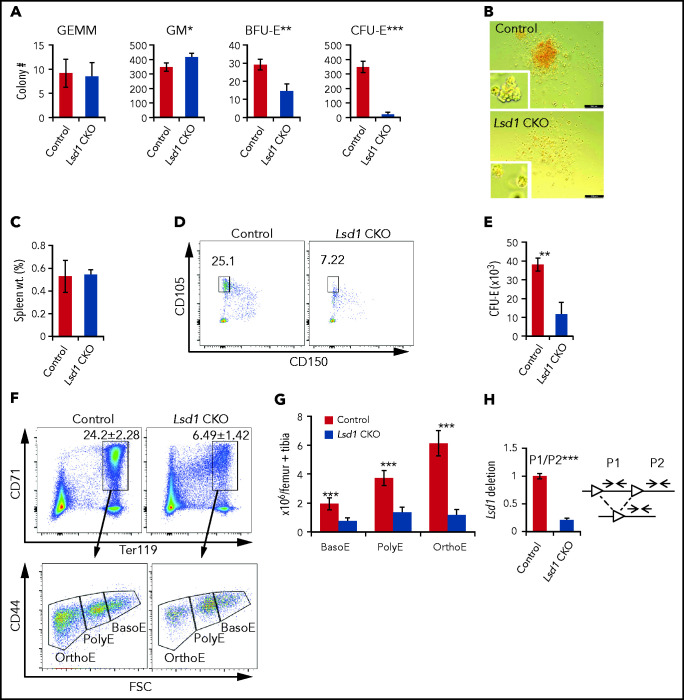
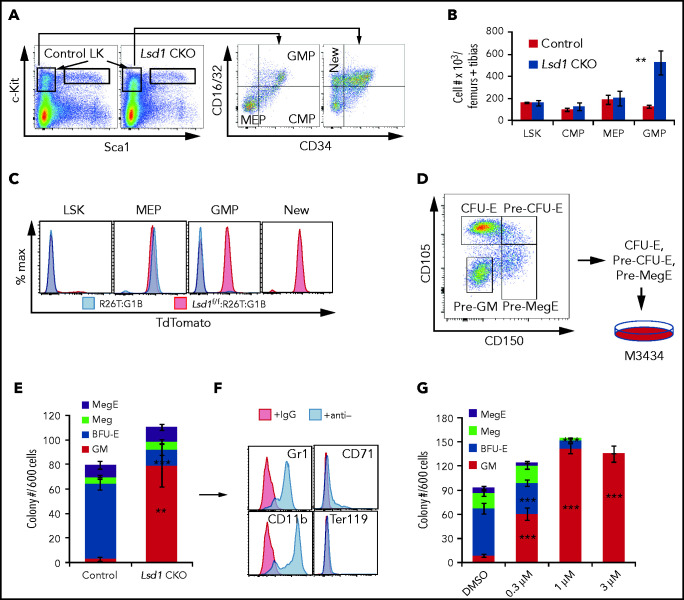
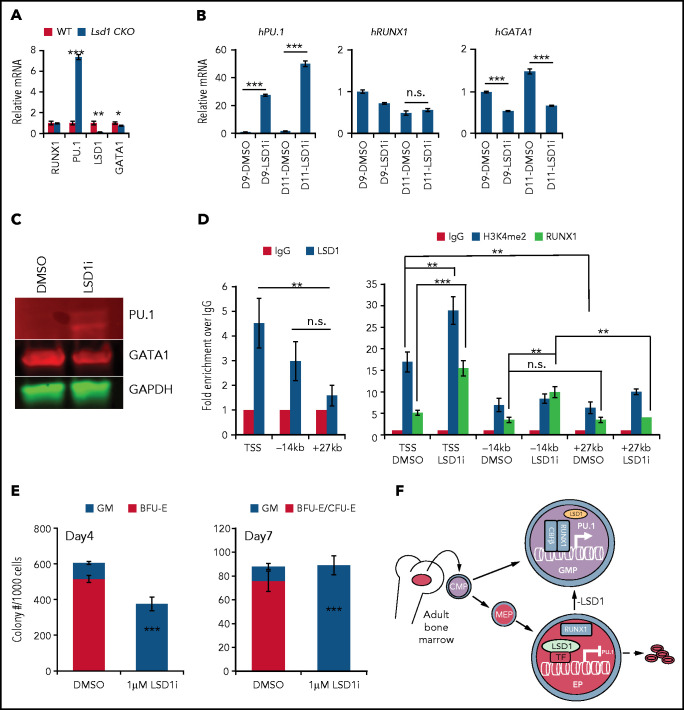
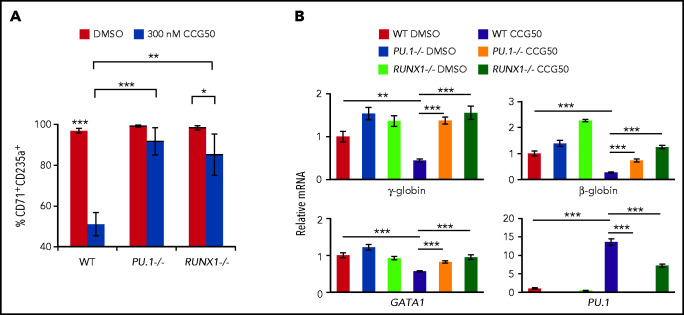
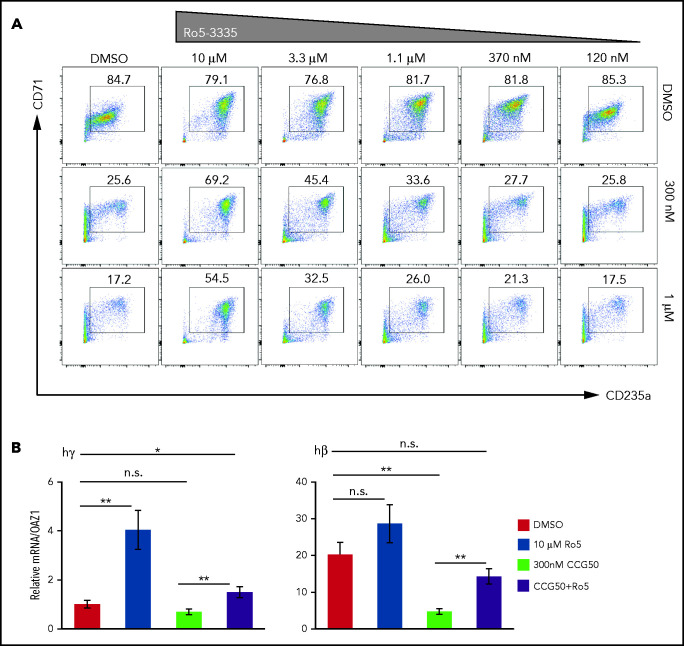
Histone H3 lysine 4 methylation (H3K4Me) is most often associated with chromatin activation, and removing H3K4 methyl groups has been shown to be coincident with gene repression. H3K4Me demethylase KDM1a/LSD1 is a therapeutic target for multiple diseases, including for the potential treatment of β-globinopathies (sickle cell disease and β-thalassemia), because it is a component of γ-globin repressor complexes, and LSD1 inactivation leads to robust induction of the fetal globin genes. The effects of LSD1 inhibition in definitive erythropoiesis are not well characterized, so we examined the consequences of conditional inactivation of Lsd1 in adult red blood cells using a new Gata1creERT2 bacterial artificial chromosome transgene. Erythroid-specific loss of Lsd1 activity in mice led to a block in erythroid progenitor differentiation and to the expansion of granulocyte-monocyte progenitor-like cells, converting hematopoietic differentiation potential from an erythroid fate to a myeloid fate. The analogous phenotype was also observed in human hematopoietic stem and progenitor cells, coincident with the induction of myeloid transcription factors (eg, PU.1 and CEBPα). Finally, blocking the activity of the transcription factor PU.1 or RUNX1 at the same time as LSD1 inhibition rescued myeloid lineage conversion to an erythroid phenotype. These data show that LSD1 promotes erythropoiesis by repressing myeloid cell fate in adult erythroid progenitors and that inhibition of the myeloid-differentiation pathway reverses the lineage switch induced by LSD1 inactivation.


Figures

None
Graphical abstract
Figure 1.
Figure 1.
LSD1 inhibition activates γ-globin transcription but blocks erythroid differentiation. (A) Representative flow cytometry plots of human CD34+ HSPCs undergoing erythroid differentiation after 11, 14, and 18 days (d) in culture. Cells were treated with DMSO or with 1.1 μM, 370 nM, or 120 nM LSD1i (CCG050). Cells were monitored for CD71 and CD235a cell surface markers, whose acquisition reflect maturing erythroid differentiation stages. Numbers in each quadrant indicate the percentage of gated cells. Results are representative of experiments performed using CD34+ HSPCs from 2 healthy adult donors. (B) Representative HPLC chromatograms of day-18 cells cultured or not with CCG050 from panel A. HbF percentages are indicated in parentheses. (C) Percentage of γ-globin transcripts in total β-like (γ+β) globin mRNAs at day 14. (D) mRNA abundance of γ-globin and β-globin (normalized to OAZ1 internal control mRNA) at day 14. The γ-globin transcript abundance in DMSO-treated cells was arbitrarily set at 1. (E) Transcript levels of key erythroid TFs GATA1, KLF1, and TAL1 (normalized to OAZ1 mRNA) were reduced in day-14 cells treated with 370 nM LSD1i CCG050. Transcript levels of each mRNA in DMSO-treated cells were arbitrarily set at 1. Data are mean ± standard deviation from 3 replicates. ***P < .001, unpaired Student t test. h, human.
Figure 2.
Figure 2.
Inducible erythroid-specific G1BCreERT2 expression is initiated at the MEP stage. (A) Representative flow cytometry plots showing gating strategies for the anti-CD71 and anti-Ter119 antibodies used to identify progressively more mature erythroid cells (from stages II to V) among BM cells from untreated R26T:G1BCreERT2 line 259 mice (left panel) or R26T:G1BCreERT2 line 259 mice treated with 2 mg of Tx (2 mg for 5 times every other day; right panel). (B) Representative flow graphs showing TdTomato epifluorescence in cell fractions I through V (gated as in A) from vehicle-treated (blue graphs) or Tx-treated (red graphs) R26T:G1BCreERT2 murine transgenic line L245 (upper panels) or line L259 (lower panels) BM cells. (C) Representative flow graphs showing TdTomato epifluorescence in the BM LSK, CMP (LincKit+Sca1CD34+CD16/32), GMP (LincKit+Sca1CD34+CD16/32+), MEP (LincKit+Sca1CD34CD16/32), and CFU-E (LincKit+Sca1CD16/32CD41CD150CD105+) cell populations in untreated (blue graphs) or Tx-treated (red graphs) R26T:G1BCreERT2 (line 259) cells. More detailed gating strategies are shown in supplemental Figures 5 and 6.
Figure 3.
Figure 3.
Effects of Lsd1 deletion in erythroid cells of CKO mice. Lsd1 CKO and control mice were administered 7 intraperitoneal injections of Tx on alternate days. Total BM cells were harvested and processed for colony assays and flow cytometric analyses. (A) Colony numbers of CFU-GEMM (GEMM), CFU-GM (GM), BFU-E, and CFU-E cells per 105 BM cells from control and Lsd1 CKO mice. (B) Representative micrographs of BFU-E from control or Lsd1 CKO mice taken at low or high (inset) magnification on day 10 of the CFU assay. Scale bars, 200 μM. (C) No statistically significant difference in the spleens (as percentages of body weights [wt.]) was observed between control and Lsd1 CKO mice. (D) Representative flow cytometry plots displaying the gating for CFU-E cells from control and Lsd1 CKO mice. (E) Bar graph showing absolute numbers of CFU-E cells in control and Lsd1 CKO mice (per 2 femurs + 2 tibias). (F) Representative flow cytometric plots showing the gating strategy for defining CD71+Ter119+ erythroid precursor cells (upper panels) that were subsequently gated by CD44 staining vs forward scatter (FSC) to separate BasoEs, PolyEs, and OrthoEs (lower panels). (G) Absolute numbers of BasoEs, PolyEs, and OrthoEs in control and Lsd1 CKO BM. (H) Deletion efficiency of Lsd1 floxed alleles in flow-sorted BasoEs was determined by qPCR. Primer pair P1 detects Lsd1 genomic DNA flanked by the 2 loxP sites, whereas primer pair P2 detects Lsd1 genomic DNA that is unaffected by Cre-mediated deletion. Data are mean ± standard deviation. *P < .05; **P < .01; ***P < .001, unpaired Student t test.
Figure 4.
Figure 4.
LSD1 LOF shifts erythroid differentiation potential to the GM lineage. Representative flow cytometry plots showing the gating strategies for LSK cells, CMPs, GMPs, and MEPs (A) and their absolute cell numbers (B) in Tx-treated Lsd1 CKO or control mouse BM cells. (C) TdTomato epifluorescence was analyzed in individual cell populations of Tx-treated R26T:G1BCreERT2 control mice (blue graphs) or Lsd1 CKOT mice (red graphs). (D) Erythroid progenitors give rise to GM colonies in LSD1-CKO BM. Sorted CFU-E, pre–CFU-E, and pre-MegE cells from Tx-treated control and Lsd1 CKO mice were pooled for seeding in colony-forming unit assays. (E) Colony types (Meg, mixed MegE, GM, and BFU-E per 600 sorted cells) were quantified. (F) Representative flow cytometry plots of pooled GM colonies picked from Lsd1-CKO mice. The cells were stained with anti-Gr1, anti-CD11b, anti-Ter119, or anti-CD71 antibody. (G) Colony numbers of Megs, MegEs, CFU-GM, and BFU-E (per 600 sorted cells) from control mice treated with DMSO or different concentrations of CCG50 LSD1i. Data are mean ± standard deviation from 3 mice. **P < .01, ***P < .001, unpaired Student t test.
Figure 5.
Figure 5.
LSD1 directly inhibits myeloid differentiation genes in erythroid cells. (A) Relative mRNA levels of RUNX1, PU.1, LSD1, and GATA1 (normalized to 18s ribosome RNA) in sorted CFU-E cells from Tx-treated control and Lsd1-CKO mouse BM. (B) Relative mRNA levels of PU.1, RUNX1, or GATA1 (normalized to OAZ115) in day-9 (D9) or day-11 (D11) erythroid-differentiated human CD34+ cells assayed by qRT-PCR. Cells were expanded in the presence of DMSO or 370 nM LSD1i. (C) Protein levels of PU.1 or GATA1 in the same cells as in (B) assayed by western blotting. (D) ChIP-qPCR analysis of LSD1, H3K4me2, and RUNX1 binding at sites in the PU.1 locus in day-11 human CD34 erythroid differentiated cells in the presence of DMSO or 370 nM LSD1i. (E) Colony numbers of CFU-GM and erythroid colony per 1000 CD34+ erythroid differentiated cells from day 4 or day 7 treated with DMSO or 370 nM LSD1i. Data are mean ± standard deviation. (F) LSD1 maintains normal erythropoiesis by repressing PU.1 transcription in erythroid progenitors. LSD1 gene deletion or protein inhibition leads to aberrant activation of PU.1, likely through RUNX1, and shifts the differentiation potential from erythroid to myeloid. *P < .05, **P < .01, ***P < .001, unpaired Student t test. h, human; IgG, immunoglobulin G; n.s., not significant; TSS, PU.1 TSS; WT, wild-type; −14kb, PU.1 enhancer; +27 kb, random sequence control.
Figure 6.
Figure 6.
Pu.1 or Runx1 genetic loss rescues erythroid differentiation inhibition induced by blocking LSD1 activity. (A) CD71 and CD235a flow cytometric analysis of 3 independent nontargeting sgRNA-infected cells (wild-type [WT]), 4 independent PU.1−/− HUDEP2 clones, or 4 HUDEP2 Runx1−/− clones treated with DMSO (control) or 300 nM CCG50. Data are the average percentage of CD71+CD235a+ cells from multiple clones in supplemental Figure 15. Impaired erythroid differentiation (as reflected by the reduced percentage of CD71+CD235a+ cells) in the WT group after CCG50 treatment was rescued by PU.1 or RUNX1 knockout. (B) mRNA levels of γ-globin, β-globin, GATA1, and PU.1 in random sgRNA control cells and P3-18 (PU.1−/−) or R2-47 (RUNX1−/−) LOF clones after treatment with DMSO or 300 nM CCG50. Data are mean ± standard deviation. *P < .05, **P < .01, ***P < .001, unpaired Student t test.
Figure 7.
Figure 7.
RUNX1i cotreatment partially rescues the erythroid-to-myeloid conversion by LSD1i. (A) CD71/CD235a staining of human CD34+ cells showing erythroid differentiation at day 11, after 4 days of treatment with CCG50 alone (300 nM or 1 μM), RUNX1i Ro5-3335 alone (10 μM-120 nM) or both. (B) mRNA abundance of γ-globin and β-globin at day 11 after inhibitor treatments. γ-Globin transcripts in DMSO were arbitrarily set at 1. Data are mean ± standard deviation. *P < .05, **P < .01, unpaired Student t test. h, human; n.s., not significant.

Comment in

References

    1. Murayama M. Molecular mechanism of red cell “sickling”. Science. 1966;153(3732): 145-149. - PubMed
    1. Platt OS, Brambilla DJ, Rosse WF, et al. . Mortality in sickle cell disease. Life expectancy and risk factors for early death. N Engl J Med. 1994;330(23):1639-1644. - PubMed
    1. Origa R. β-Thalassemia. Genet Med. 2017;19(6):609-619. - PubMed
    1. Dedoussis GV, Sinopoulou K, Gyparaki M, Loutradis A.. Fetal hemoglobin expression in the compound heterozygous state for −117 (G→A) Agamma HPFH and IVSII-745 (C→G) beta+ thalassemia: a case study. Am J Hematol. 1999;61(2):139-143. - PubMed
    1. Dedoussis GV, Sinopoulou K, Gyparaki M, Loutradis A.. Fetal hemoglobin expression in the compound heterozygous state for −117 (G→A) Agamma HPFH and IVS-1 nt 110 (G→A) beta+ thalassemia: a case study. Eur J Haematol. 2000;65(2):93-96. - PubMed

Publication types