. 2021 Aug 5;184(16):4154-4167.e12.
doi: 10.1016/j.cell.2021.07.001. Epub 2021 Jul 28.

The microbiota coordinates diurnal rhythms in innate immunity with the circadian clock

Affiliations

The microbiota coordinates diurnal rhythms in innate immunity with the circadian clock

John F Brooks 2nd et al. Cell. .

Abstract

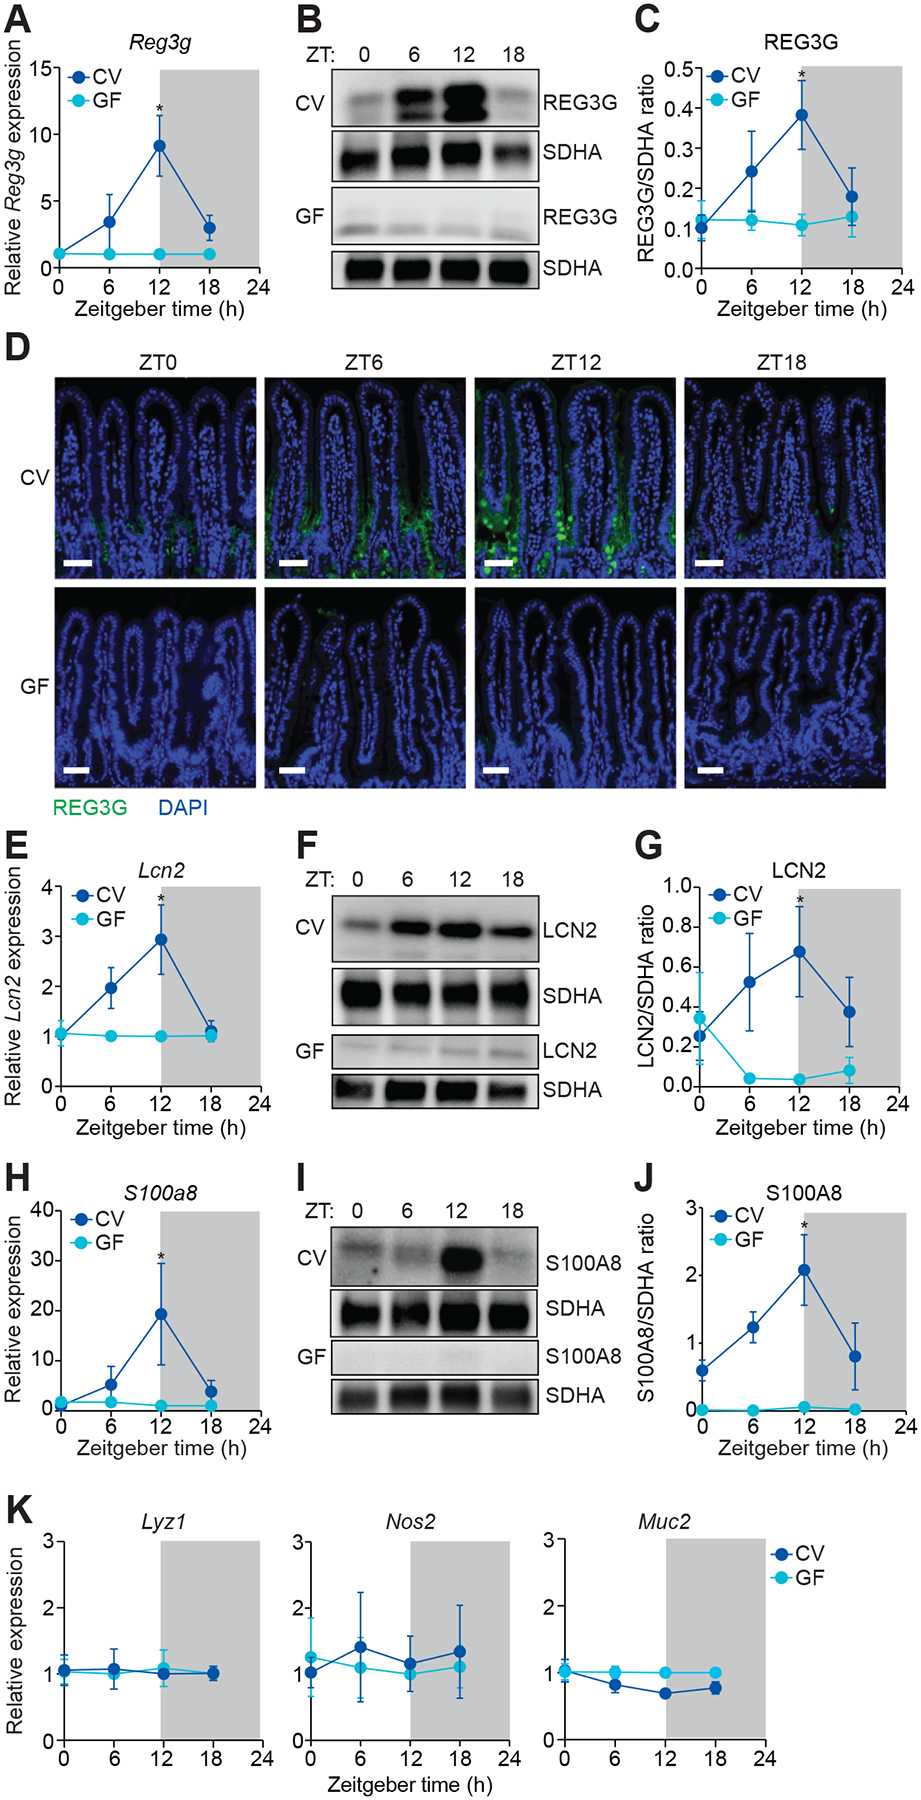
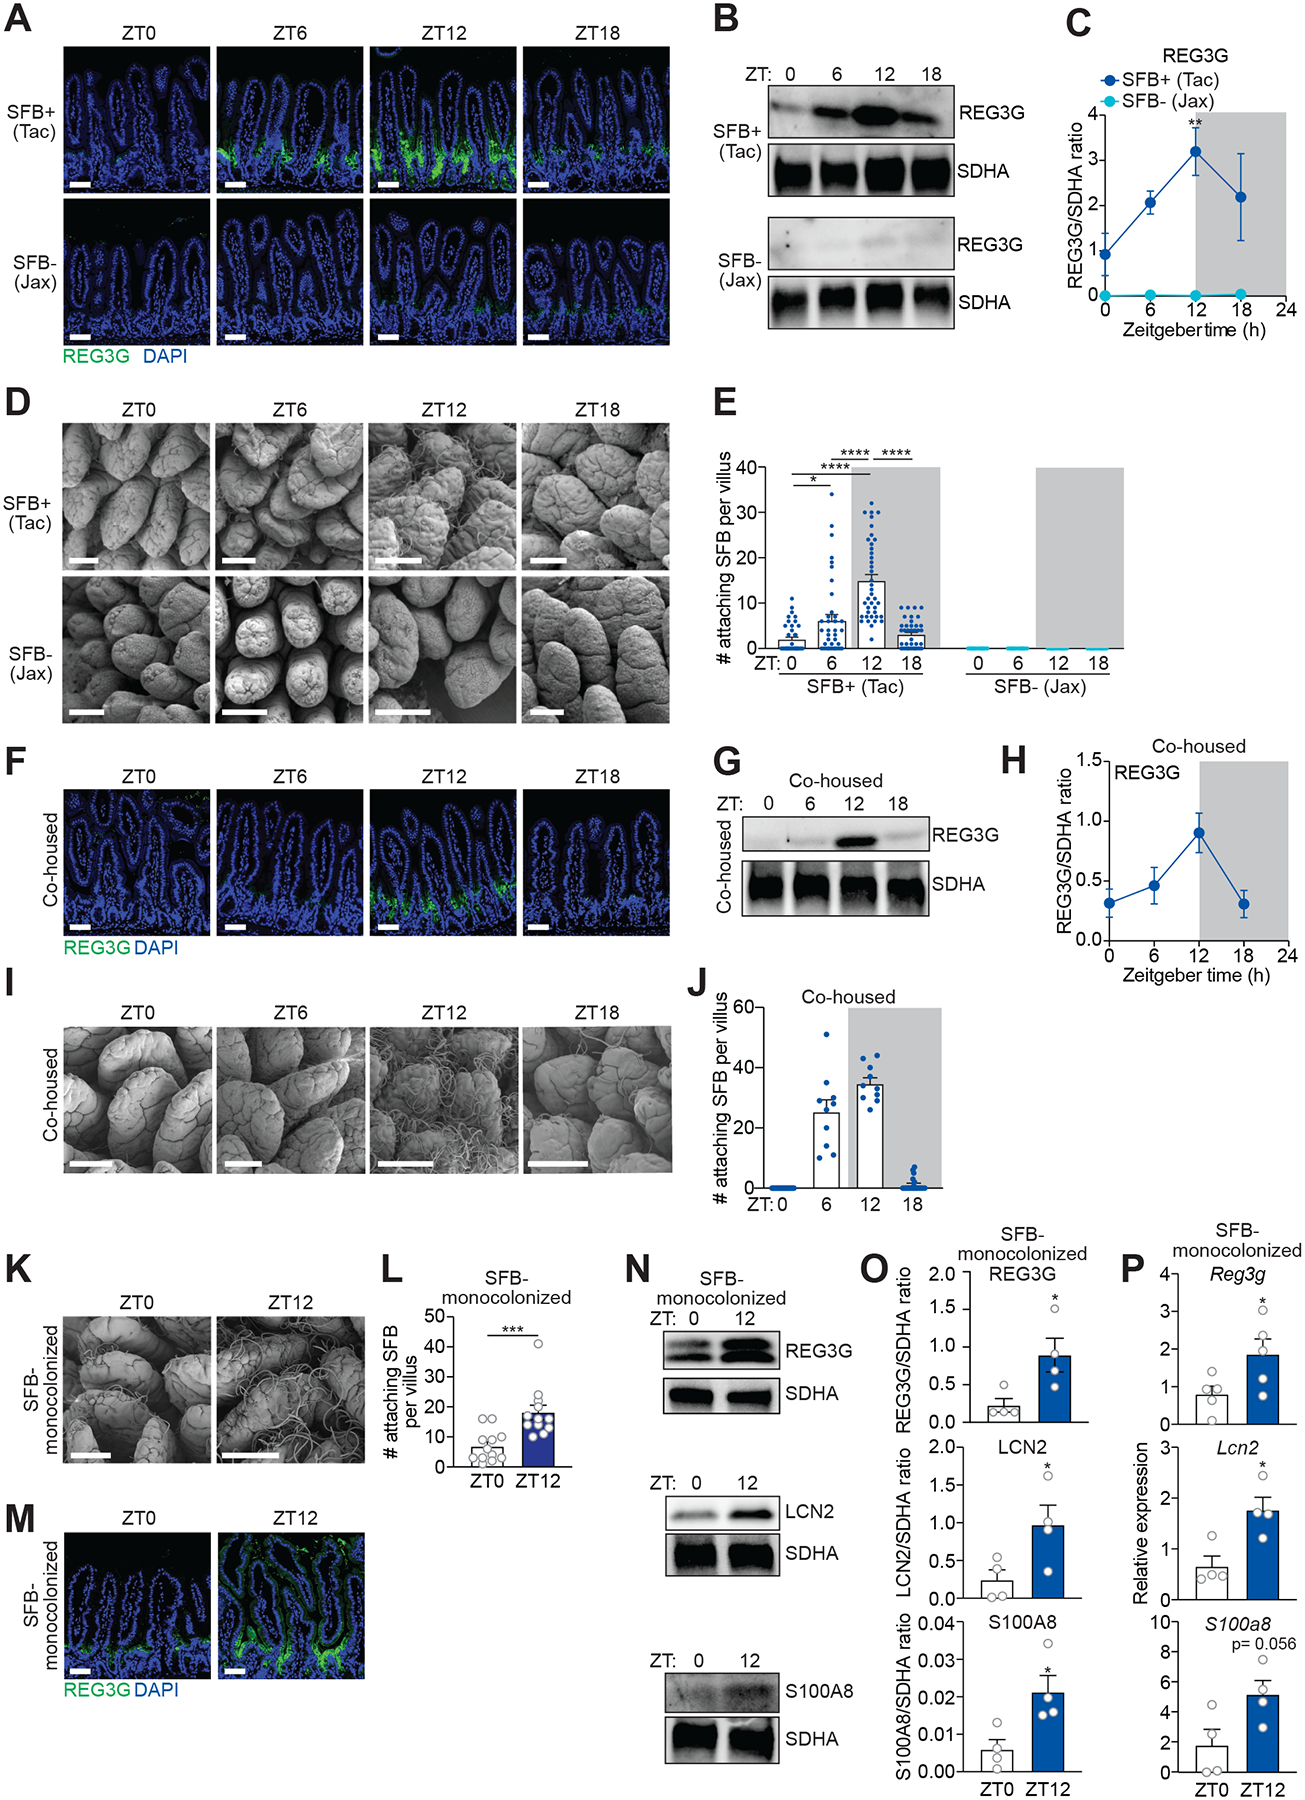
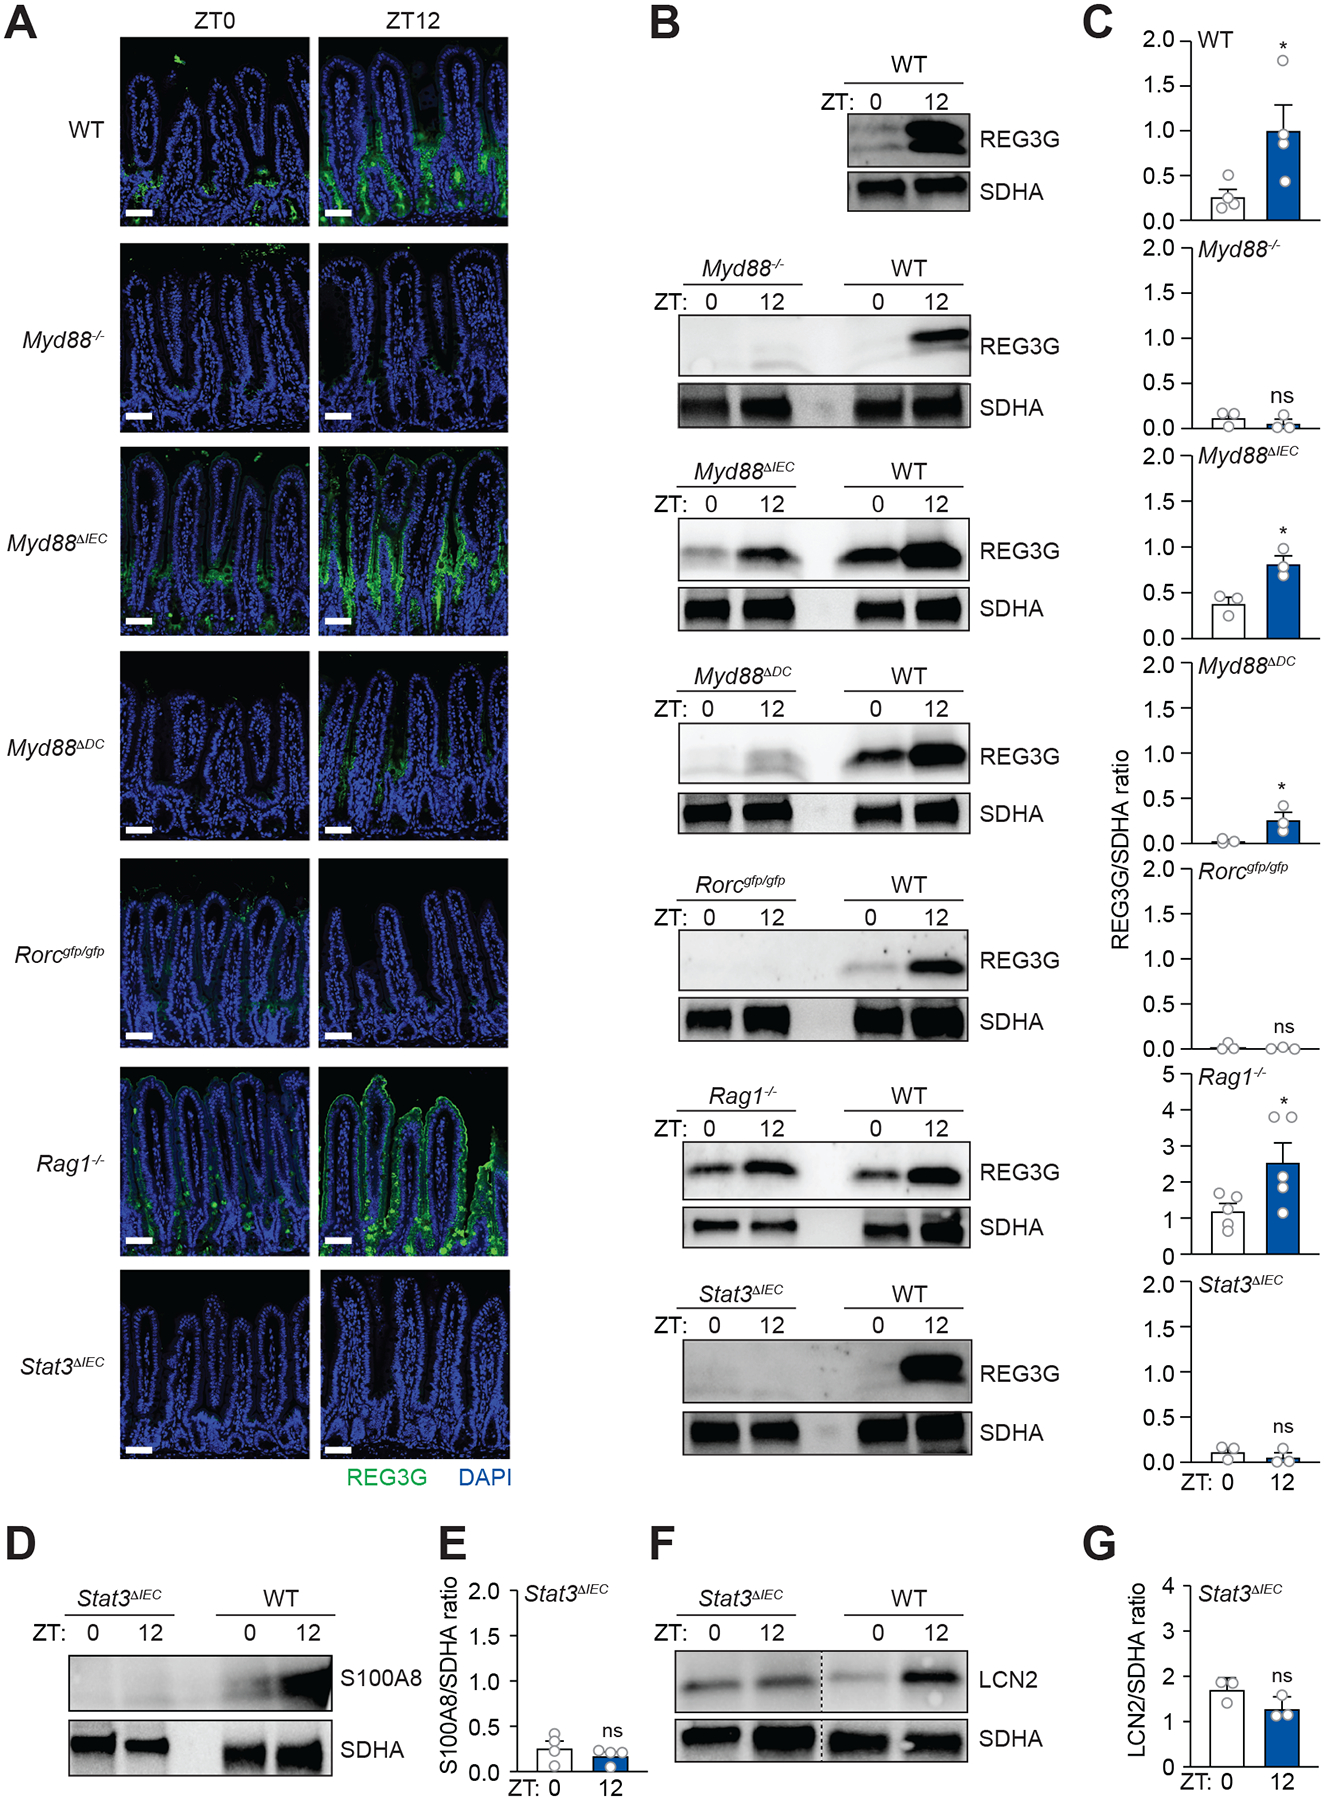
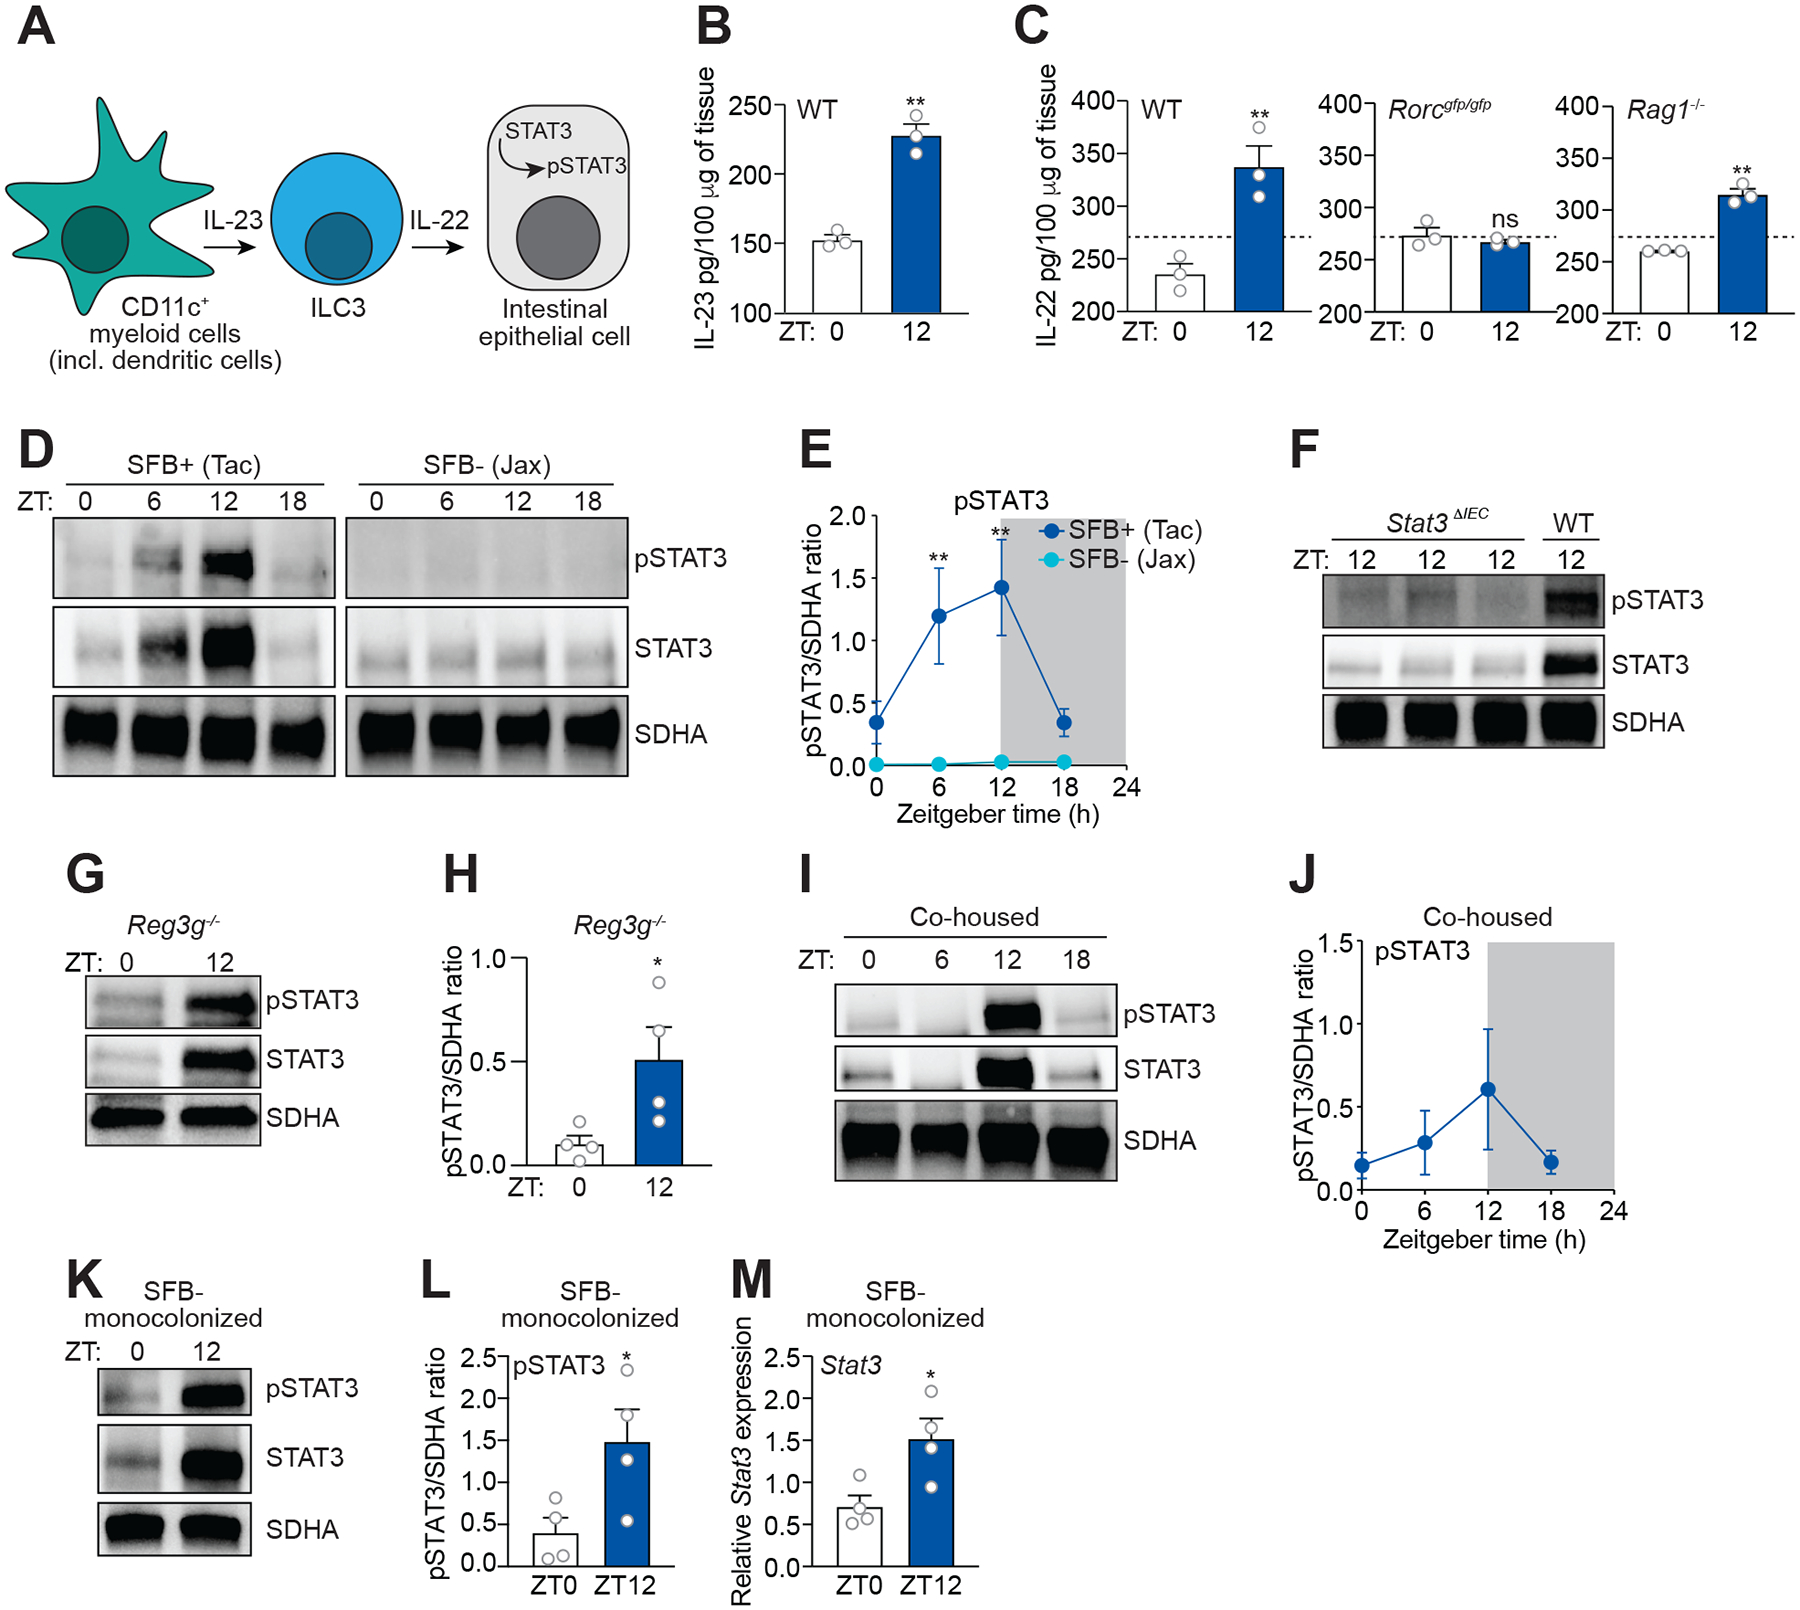
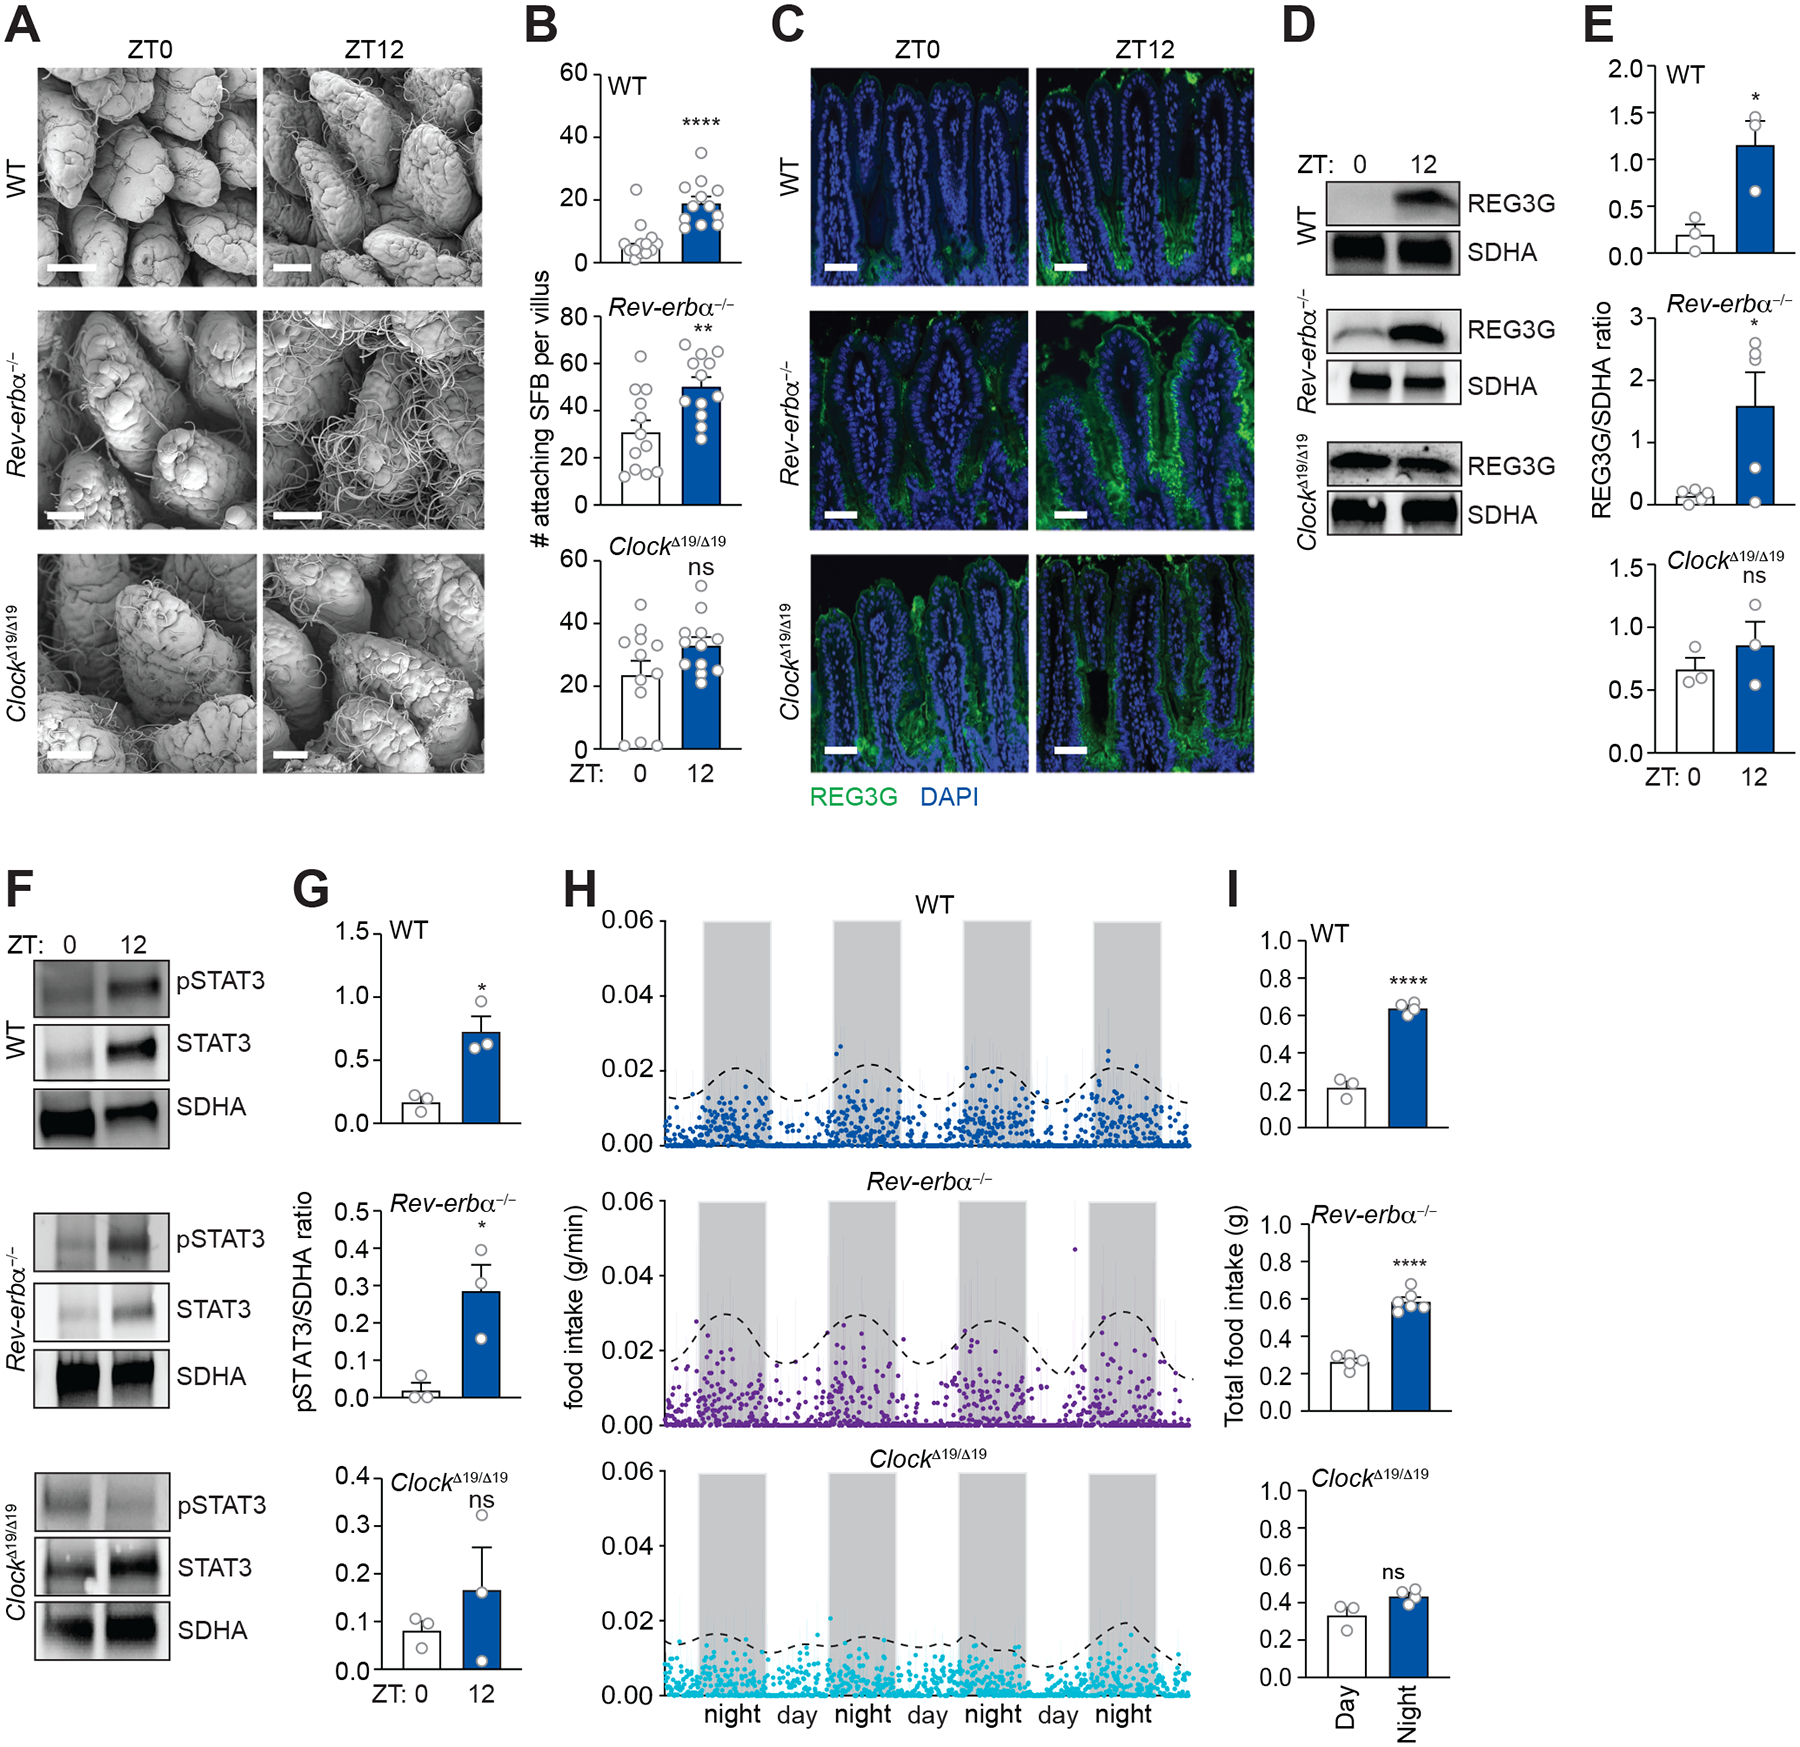
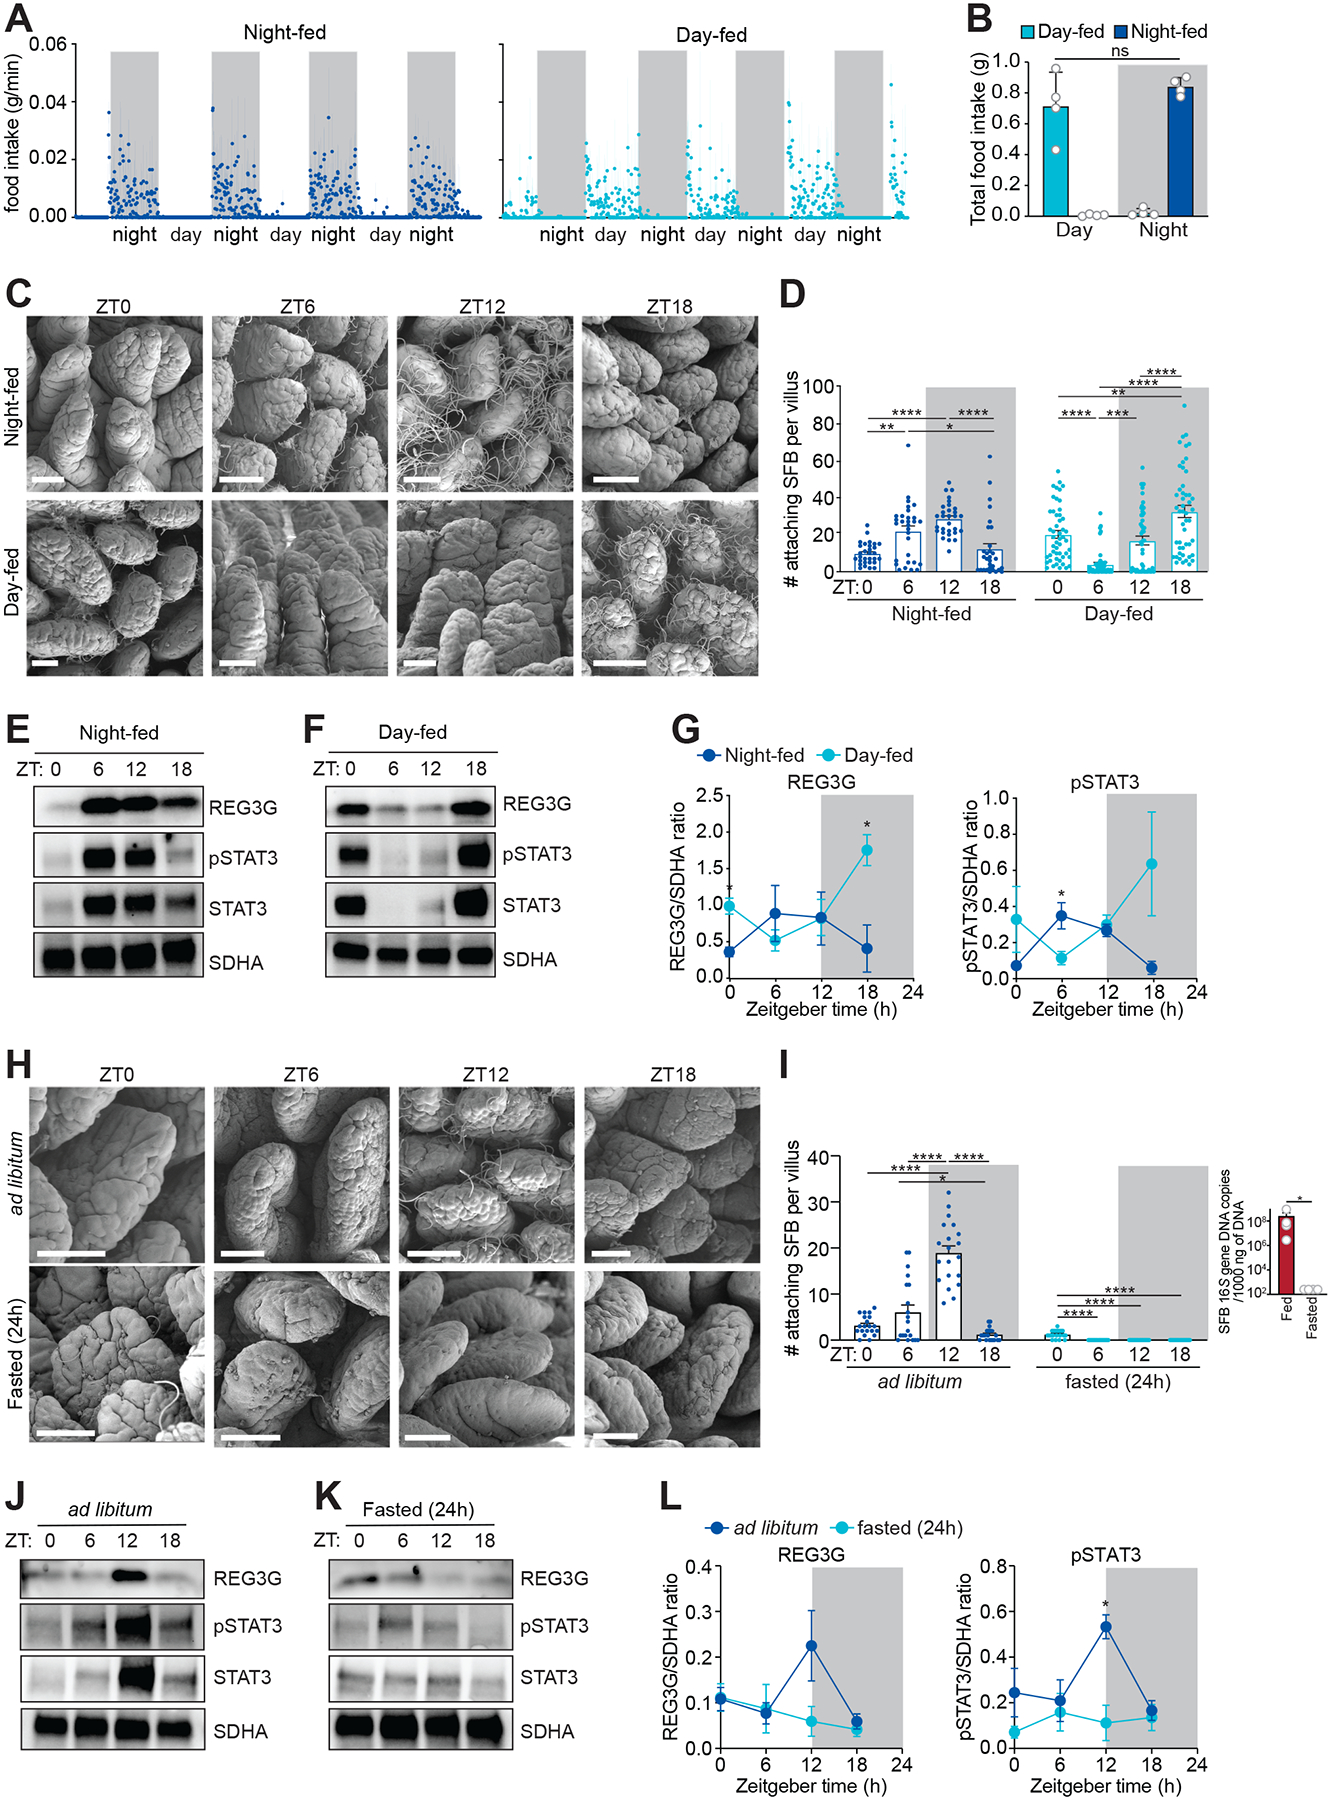
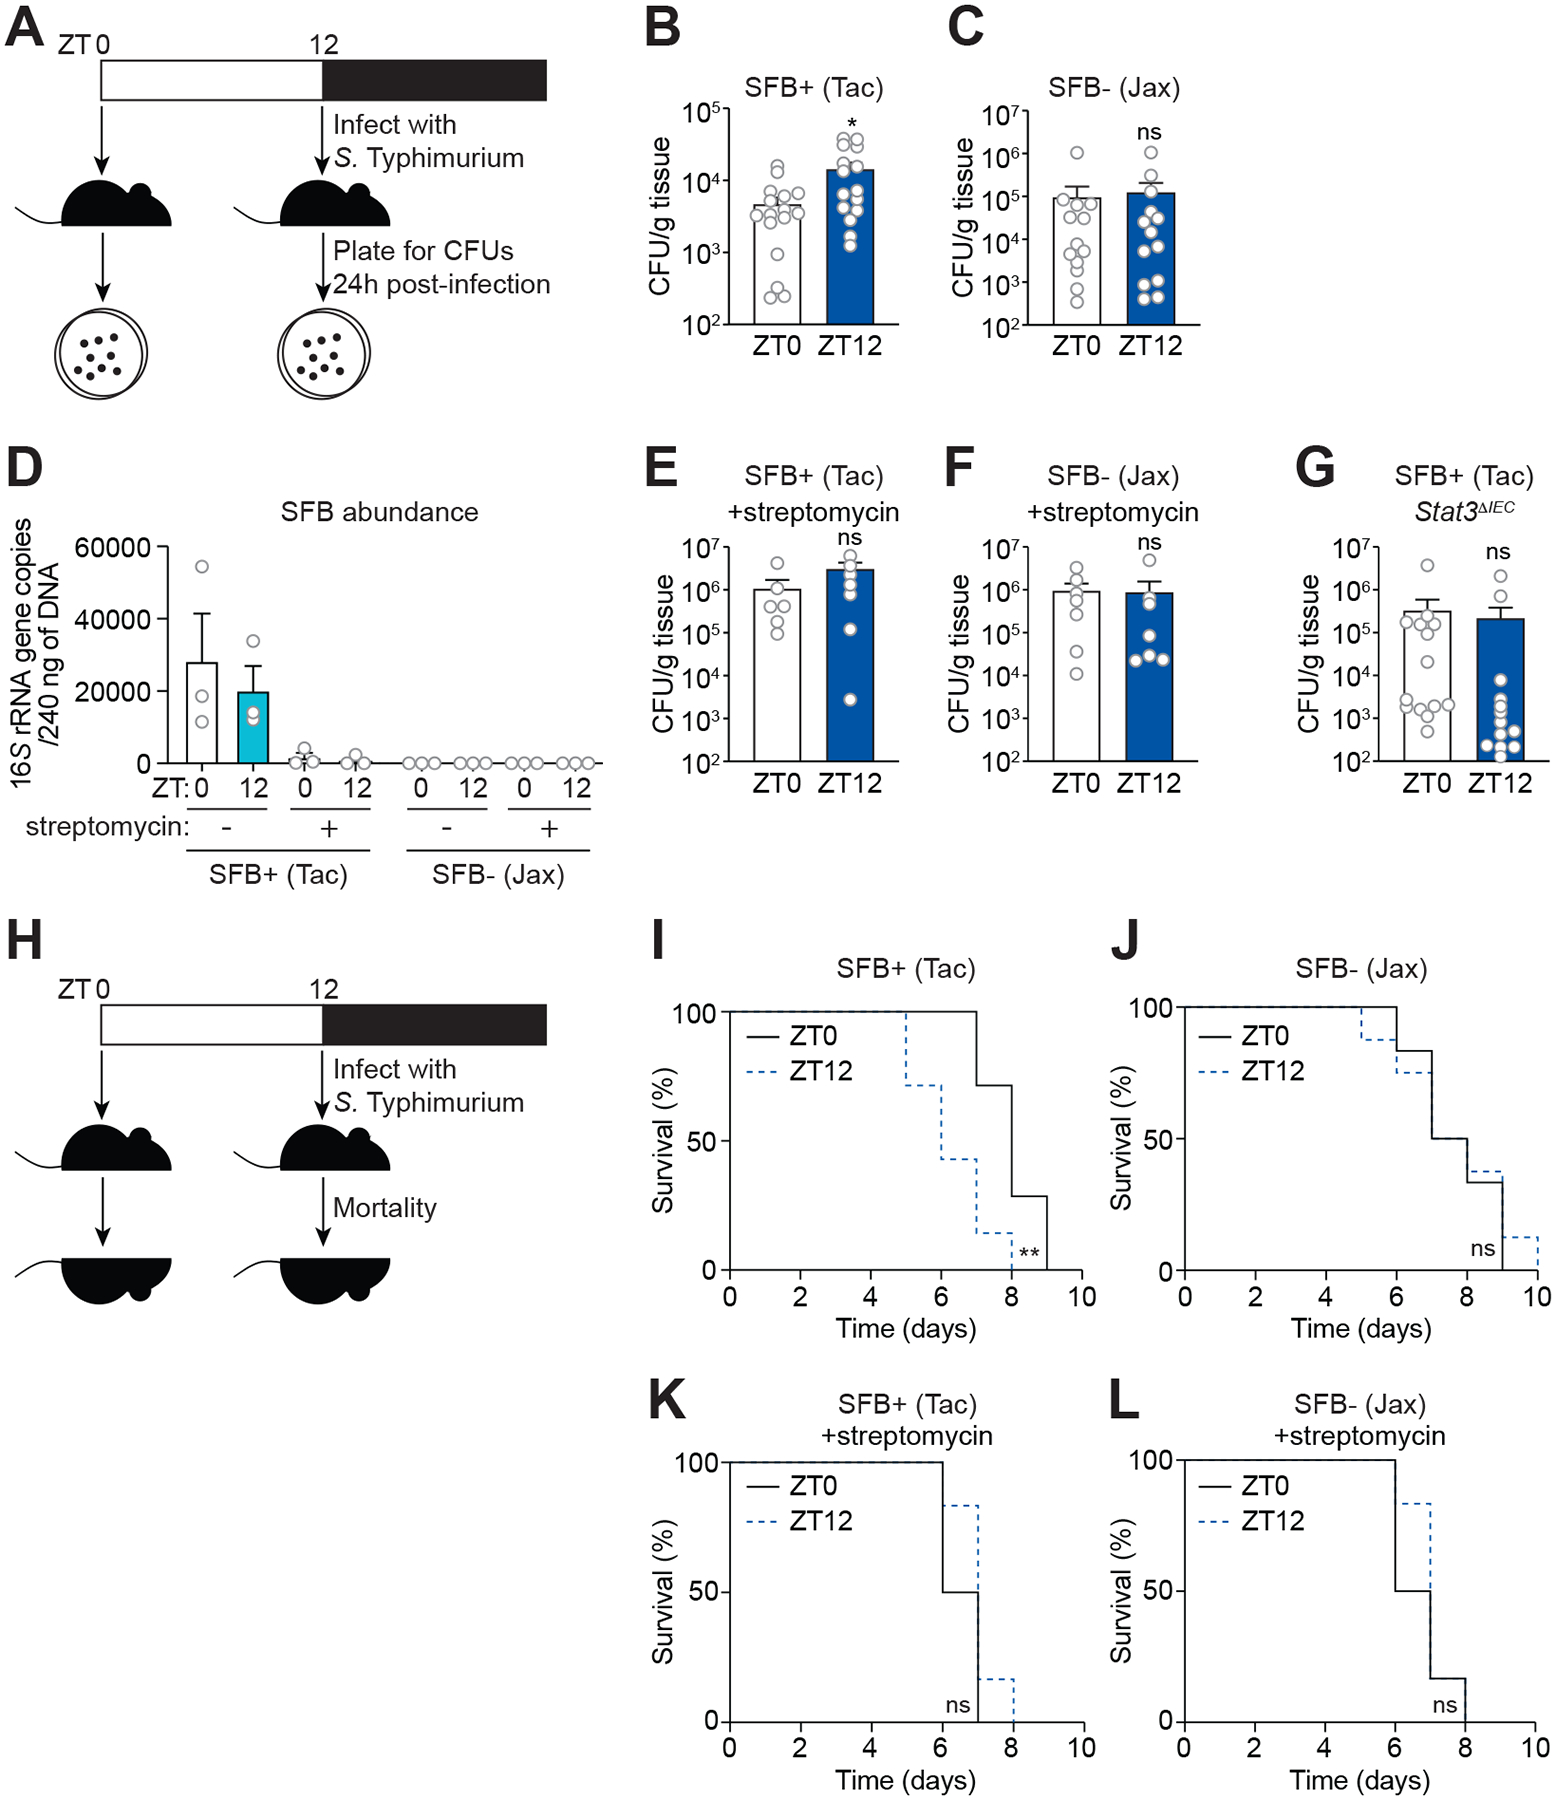
Environmental light cycles entrain circadian feeding behaviors in animals that produce rhythms in exposure to foodborne bacteria. Here, we show that the intestinal microbiota generates diurnal rhythms in innate immunity that synchronize with feeding rhythms to anticipate microbial exposure. Rhythmic expression of antimicrobial proteins was driven by daily rhythms in epithelial attachment by segmented filamentous bacteria (SFB), members of the mouse intestinal microbiota. Rhythmic SFB attachment was driven by the circadian clock through control of feeding rhythms. Mechanistically, rhythmic SFB attachment activated an immunological circuit involving group 3 innate lymphoid cells. This circuit triggered oscillations in epithelial STAT3 expression and activation that produced rhythmic antimicrobial protein expression and caused resistance to Salmonella Typhimurium infection to vary across the day-night cycle. Thus, host feeding rhythms synchronize with the microbiota to promote rhythms in intestinal innate immunity that anticipate exogenous microbial exposure.

Keywords: Antimicrobial proteins; circadian clock; feeding rhythms; foodborne pathogen; innate immunity; innate lymphoid cells; intestine; microbiota.


Conflict of interest statement

Declaration of interests The authors declare no competing interests.

Figures

Figure 1.
Figure 1.. Diurnal rhythms in antimicrobial protein expression depend on the microbiota.
(A) Real-time quantitative PCR (Q-PCR) measurement of Reg3g transcript abundance in small intestines from conventional (CV) and germ-free (GF) mice across the day-night cycle. n=2–3 independent experiments. (B and C) Representative immunoblot of small intestines from CV and GF mice, with detection of REG3G and succinate dehydrogenase subunit A (SDHA) as loading control (B). Band intensities were quantified by densitometry (C). n=3 independent experiments. (D) Immunofluorescence detection of REG3G in the small intestines of CV and GF mice across the day-night cycle. Nuclei were stained with 4´,6-diamidino-2-phenylindole (DAPI). Scale bars, 50 μm. (E) Q-PCR measurement of Lcn2 transcript abundance in small intestines from CV and GF mice across the day-night cycle. n=3 independent experiments. (F and G) Representative immunoblot of small intestines from CV and GF mice, with detection of LCN2 and SDHA (control) (F). Band intensities were quantified by densitometry (G). n=3 independent experiments. (H) Q-PCR measurement of S100a8 transcript abundance in small intestines from CV and GF mice across the day-night cycle. n=2–3 independent experiments. (I and J) Representative immunoblot of small intestines from CV and GF mice, with detection of S100A8 and SDHA (control) (I). Band intensities were quantified by densitometry (J). n=3 independent experiments. (K) Q-PCR analysis of Lyz1, Nos2, and Muc2 transcript abundance in small intestines from CV and GF mice across the day-night cycle. n=2–3 independent experiments. ZT, Zeitgeber time. Means ± SEM are plotted; *p < 0.05 by Student’s t test. See also Figures S1 and S2 and Table S1.
Figure 2.
Figure 2.. Rhythmic epithelial attachment of segmented filamentous bacteria (SFB) drives diurnal rhythms in antimicrobial protein expression.
(A) Immunofluorescence detection of REG3G in the small intestines of SFB+ (Tac) and SFB− (Jax) mice. Nuclei were stained with DAPI. (B and C) Representative immunoblot of small intestines from SFB+ (Tac) and SFB− (Jax) mice, with detection of REG3G and SDHA (control) (B). Band intensities were quantified by densitometry (C); n=3 independent experiments. (D and E) Scanning electron microscopy of small intestinal villi from SFB+ (Tac) and SFB− (Jax) mice (D). Enumeration of attaching bacteria (E). The point of bacterial attachment was counted for 10 randomly selected villi across three visual fields per mouse; n=4 mice per group. (F) Immunofluorescence detection of REG3G in the small intestines of SFB− (Jax) mice that were co-housed with SFB+ (Tac) mice for 14 days. Nuclei were stained with DAPI. (G and H) Representative immunoblot of small intestines from co-housed mice, with detection of REG3G and SDHA (control) (G). Band intensities were quantified by densitometry (H). (I and J) Scanning electron microscopy of intestinal villi from co-housed mice. Enumeration of attaching bacteria (J). The point of bacterial attachment was counted for five randomly selected villi across two visual fields per mouse; n=2 mice per group. (K and L) Scanning electron microscopy of small intestinal villi from SFB-monocolonized mice (K). Enumeration of attaching bacteria (L). The point of bacterial attachment was counted for three randomly selected villi across one visual field per mouse; n=4 mice per group. (M) Immunofluorescence detection of REG3G in the small intestines of SFB-monocolonized mice. Nuclei were stained with DAPI. (N and O) Representative immunoblot of small intestines from SFB-monocolonized mice, with detection of REG3G, LCN2, S100A8, and SDHA (control) (N). Band intensities were quantified by densitometry (O). n=4 independent experiments. (P) Q-PCR analysis of Reg3g, Lcn2, and S100A8 transcript abundance in small intestinal epithelial cells recovered by laser capture microdissection from mice monocolonized with SFB for four weeks. Tissues were collected at two timepoints across the day-night cycle. n=4–5 independent experiments. ZT, Zeitgeber time; SFB, Segmented filamentous bacteria; Tac, Taconic; Jax, Jackson. Scale bars, 50 μm. Means ± SEM are plotted; *p < 0.05, **p < 0.01, ****p < 0.0001, ns, not significant by Student’s t test or one-way ANOVA. See also Figures S3 and S4 and Table S1.
Figure 3.
Figure 3.. An ILC3-STAT3 signaling relay drives diurnal rhythms in REG3G expression.
(A) Immunofluorescence detection of REG3G in the small intestines of wild-type (WT), Myd88−/−, Myd88ΔIEC, Myd88ΔDC, Rorcgfp/gfp, Rag1−/−, and Stat3ΔIEC mice. Scale bars, 50 μm. (B and C) Representative immunoblot of small intestines from WT, Myd88−/−, Myd88ΔIEC, Myd88ΔDC, Rorcgfp/gfp, Rag1−/−, and Stat3ΔIEC mice, with detection of REG3G and SDHA (control) (B). Band intensities were quantified by densitometry (C). (D and E) Representative immunoblot of small intestines from Stat3ΔIEC mice, with detection of S100A8 and SDHA (control) (E). Band intensities were quantified by densitometry (F). (F and G) Representative immunoblot of small intestines from Stat3ΔIEC mice, with detection of LCN2 and SDHA (control) (G). Band intensities were quantified by densitometry (H). ZT, Zeitgeber time. All results are representative of at least three independent experiments. Means ± SEM are plotted; *p < 0.05, **p < 0.01, ns, not significant by Student’s t test. See also Figures S5 and S6.
Figure 4.
Figure 4.. SFB drive diurnal rhythms in STAT3 expression and activation.
(A) Schematic of the small intestinal ILC3-STAT3 pathway. (B) Measurement of IL-23 in mouse small intestine by enzyme-linked immunosorbent assay (ELISA). n=3 mice per group. (C) Measurement of IL-22 in the small intestines of wild-type (WT), Rorcgfp/gfp, and Rag1−/− mice by ELISA. n=3 mice per group. (D and E) Representative immunoblot of small intestines from SFB+ (Tac) and SFB− (Jax) mice, with detection of STAT3, pSTAT3, and SDHA (control) (D). Band intensities were quantified by densitometry (E). n=3 independent experiments. (F) Immunoblot of WT and Stat3ΔIEC mice, with detection of STAT3, pSTAT3, and SDHA (control). Representative of three independent experiments. (G and H) STAT3 and pSTAT3 rhythms are maintained in Reg3−/− mice. (G) Representative immunoblot of small intestines from Reg3g−/− mice, with detection of STAT3, pSTAT3, and SDHA (control). (H) Band intensities were quantified by densitometry. n=4 independent experiments. (I and J) Representative immunoblot of small intestines from SFB− (Jax) mice that were co-housed with SFB+ (Tac) mice for 14 days with detection of STAT3, pSTAT3, and SDHA (control) (F). Band intensities were quantified by densitometry (G). n=3 independent experiments. (K and L) Representative immunoblot of small intestines from SFB-monocolonized mice, with detection of STAT3, pSTAT3, and SDHA (control) (H). Band intensities were quantified by densitometry (I). n=4 independent experiments. (M) Q-PCR measurement of Stat3 transcript abundance in small intestinal epithelial cells recovered by laser capture microdissection from mice monocolonized with SFB for four weeks. Tissues were collected at two timepoints across the day-night cycle. n=4 independent experiments. ZT, Zeitgeber time; SFB, Segmented filamentous bacteria; Tac, Taconic; Jax, Jackson. Means ± SEM are plotted; **p < 0.01, ***p < 0.001 by Student’s t test. See also Figure S6 and Table S1.
Figure 5.
Figure 5.. The circadian clock regulates diurnal rhythms in SFB attachment that drive rhythmic STAT3 and REG3G expression.
(A and B) Scanning electron microscopy of intestinal epithelium from WT, Rev-erbα−/−, and Clock Δ19/Δ19 mice (A). Scale bars, 50 μm. Enumeration of attaching bacteria (B). The point of bacterial attachment was counted for 4 randomly selected villi across two visual fields per mouse. n=3 mice per group. (C) Immunofluorescence detection of REG3G in the small intestines of WT, Rev-erbα−/−, and Clock Δ19/Δ19 mice. Nuclei were stained with DAPI. Scale bars, 50 μm. (D and E) Representative immunoblot of small intestines from WT, Rev-erbα−/−, and Clock Δ19/Δ19 mice, with detection of REG3G and SDHA (control) (D). Band intensities were quantified by densitometry (E); n=3 independent experiments. (F and G) Representative immunoblot of small intestines from WT, Rev-erbα−/−, and Clock Δ19/Δ19 mice, with detection of STAT3, pSTAT3 and SDHA (control). Band intensities were quantified by densitometry (G); n=3 independent experiments. (H and I) Measurement of food intake rate in WT, Rev-erbα−/−, and Clock Δ19/Δ19 mice (H). Total food intake during day and night (I); Each data point represents one mouse. n=3–6 mice per group. ZT, Zeitgeber time. Means ± SEM are plotted; *p < 0.05, ****p < 0.0001; ns, not significant by Student’s t test.
Figure 6.
Figure 6.. The circadian clock entrains host feeding rhythms that regulate rhythmic SFB attachment.
(A and B) Measurement of food intake rate in day- or night-fed mice (A). Total food intake during day and night (B). Each data point represents one mouse. n=4 mice per group. (C and D) Scanning electron microscopy of intestinal epithelium from day- or night-fed mice (C). Scale bars, 50 μm. Enumeration of attaching bacteria (D). Attaching bacteria were counted as described in Figure 2E. n=3–5 mice per group. (E-G) Representative immunoblots of small intestines from night-fed (E) or day-fed (F) mice, with detection of REG3G, STAT3, pSTAT3, and SDHA (control). Band intensities were quantified by densitometry (G). n=4 independent experiments. (H and I) Scanning electron microscopy of intestinal epithelium from ad libitum fed or fasted (24 h) mice (H). Scale bars, 50 μm. Enumeration of attaching bacteria (I). The point of bacterial attachment was counted for 5 randomly selected villi across two visual fields per mouse. n=3–5 mice per group. Overall SFB abundance (I, right panel) was measured by Q-PCR analysis of 16S rRNA gene copy number in the ileum. (J and K) Representative immunoblot of small intestines from ad libitum fed or fasted (24 h) mice, with detection of REG3G, STAT3, pSTAT3, and SDHA (control) (F). Band intensities were quantified by densitometry (G). n=4 independent experiments. ZT, Zeitgeber time. Means ± SEM are plotted. *p < 0.05, **p < 0.01, ****p < 0.0001, ns, not significant by Student’s t test or one-way ANOVA. See also Figure S7 and Table S1.
Figure 7.
Figure 7.. SFB acts through STAT3 to cause diurnal variation in resistance to Salmonella infection.
(A) Oral infection of mice with S. Typhimurium for determination of bacterial burden. (B and C) Bacterial burdens in the ileum of wild-type SFB+ (Tac) mice (B) and SFB− (Jax) mice (C) infected with S. Typhimurium (108 CFU per animal). Each data point represents one mouse. n=13–16 mice per group. (D) Q-PCR analysis of SFB abundance from fecal material derived from SFB+ (Tac) mice and SFB− (Jackson) mice at two timepoints (ZT0 and ZT12) before and after treatment with streptomycin. (E and F) Bacterial burdens in the ileum of wild-type SFB+ (Tac) mice (E), SFB− (Jax) mice (F) infected with S. Typhimurium (108 CFU per animal) 24 hours after streptomycin administration. Each data point represents one mouse. n=6–7 mice per group. (G) Bacterial burdens in the ileum of Stat3ΔIEC mice infected with S. Typhimurium (108 CFU per animal). Each data point represents one mouse. n=13–14 mice per group. (H) Oral infection of mice with S. Typhimurium for determination of lethal morbidity rates. (I and J) Lethal morbidity in wild-type SFB+ (Tac) mice (E) and SFB− (Jax) mice (F) infected with S. Typhimurium (107 CFU per animal). n=6–8 mice per group. (K and L) Lethal morbidity in wild-type SFB+ (Tac) mice (E) and SFB− (Jax) mice (F) infected with S. Typhimurium (107 CFU per animal) 24 h after streptomycin administration. n=6–7 mice per group. ZT, Zeitgeber time; SFB, segmented filamentous bacteria; Tac, Taconic; Jax, Jackson. Means ± SEM are plotted. *p < 0.05, **p < 0.01, ns, not significant by Student’s t test (Figures 7B–G) or log-rank (Mantel-Cox) test (Figures 7I–L). See also Table S1.

Comment in

References

    1. Adachi O, Kawai T, Takeda K, Matsumoto M, Tsutsui H, Sakagami M, Nakanishi K, and Akira S (1998). Targeted disruption of the MyD88 gene results in loss of IL-1-and IL-18-mediated function. Immunity 9, 143–150. - PubMed
    1. Atarashi K, Tanoue T, Ando M, Kamada N, Nagano Y, Narushima S, Suda W, Imaoka A, Setoyama H, Nagamori T, et al. (2015). Th17 cell induction by adhesion of microbes to intestinal epithelial cells. Cell 163, 367–380. - PMC - PubMed
    1. Behnsen J, Jellbauer S, Wong CP, Edwards RA, George MD, Ouyang W, and Raffatellu M (2014). The cytokine IL-22 promotes pathogen colonization by suppressing related commensal bacteria. Immunity 40, 262–273. - PMC - PubMed
    1. Bellet MM, Deriu E, Liu JZ, Grimaldi B, Blaschitz C, Zeller M, Edwards RA, Sahar S, Dandekar S, Baldi P, et al. (2013). Circadian clock regulates the host response to Salmonella. Proc. Natl. Acad. Sci. U.S.A 110, 9897–9902. - PMC - PubMed
    1. Cash HL, Whitham CV, Behrendt CL, and Hooper LV (2006). Symbiotic bacteria direct expression of an intestinal bactericidal lectin. Science 313, 1126–1130. - PMC - PubMed

Publication types

MeSH terms