

The Challenges and Pitfalls of Detecting Sleep Hypopnea Using a Wearable Optical Sensor: Comparative Study
- PMID: 34326039
- PMCID: PMC8367170
- DOI: 10.2196/24171
The Challenges and Pitfalls of Detecting Sleep Hypopnea Using a Wearable Optical Sensor: Comparative Study
Abstract
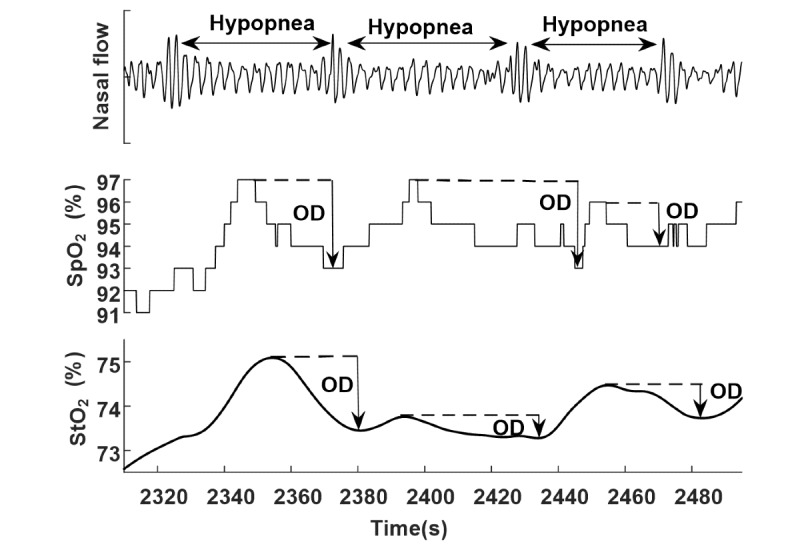
Background: Obstructive sleep apnea (OSA) is the most prevalent respiratory sleep disorder occurring in 9% to 38% of the general population. About 90% of patients with suspected OSA remain undiagnosed due to the lack of sleep laboratories or specialists and the high cost of gold-standard in-lab polysomnography diagnosis, leading to a decreased quality of life and increased health care burden in cardio- and cerebrovascular diseases. Wearable sleep trackers like smartwatches and armbands are booming, creating a hope for cost-efficient at-home OSA diagnosis and assessment of treatment (eg, continuous positive airway pressure [CPAP] therapy) effectiveness. However, such wearables are currently still not available and cannot be used to detect sleep hypopnea. Sleep hypopnea is defined by ≥30% drop in breathing and an at least 3% drop in peripheral capillary oxygen saturation (Spo2) measured at the fingertip. Whether the conventional measures of oxygen desaturation (OD) at the fingertip and at the arm or wrist are identical is essentially unknown.
Objective: We aimed to compare event-by-event arm OD (arm_OD) with fingertip OD (finger_OD) in sleep hypopneas during both naïve sleep and CPAP therapy.
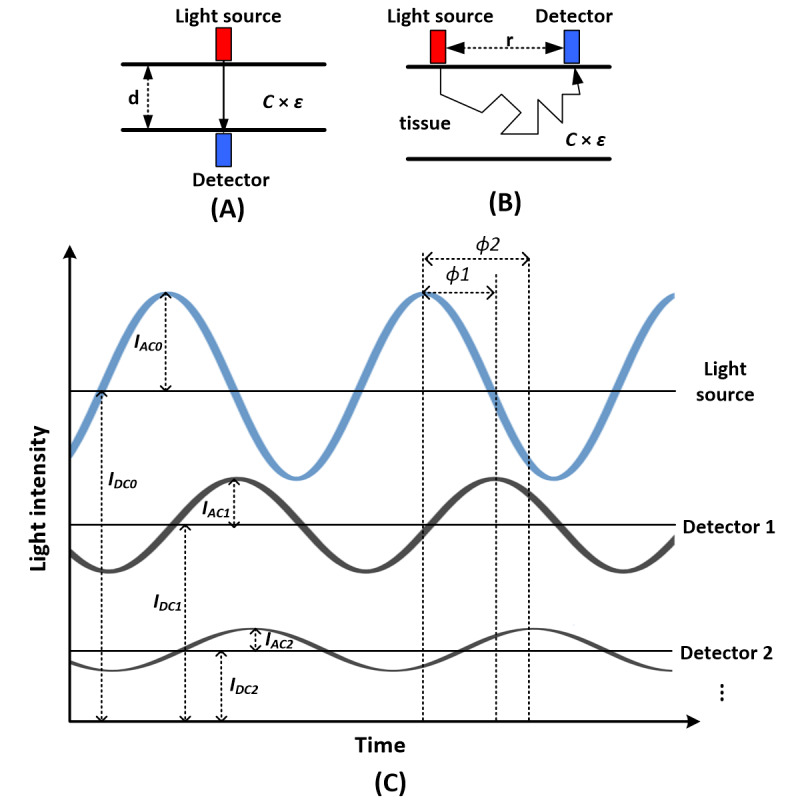
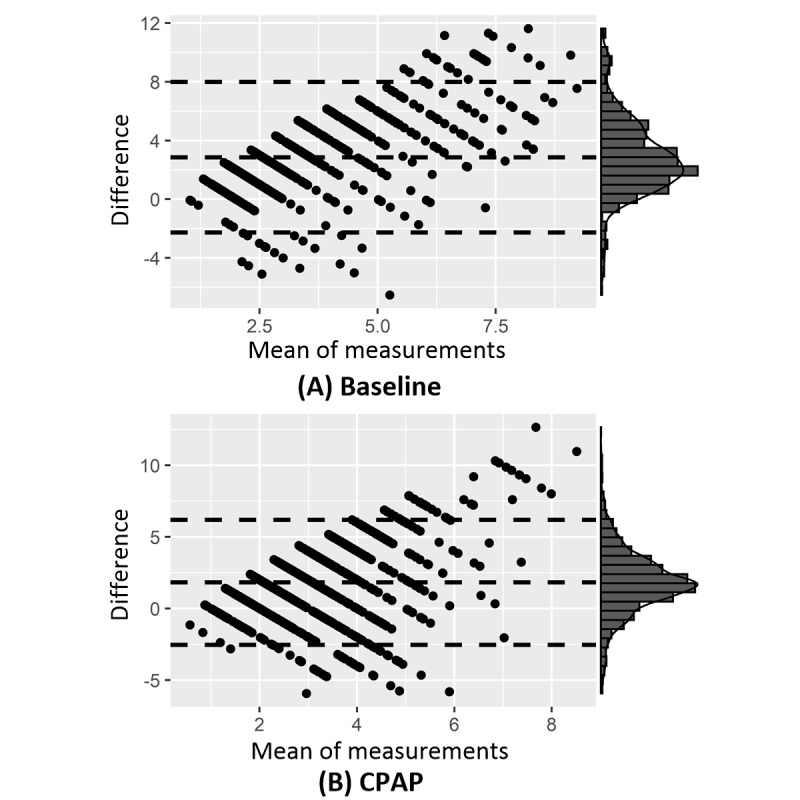
Methods: Thirty patients with OSA underwent an incremental, stepwise CPAP titration protocol during all-night in-lab video-polysomnography monitoring (ie, 1-h baseline sleep without CPAP followed by stepwise increments of 1 cmH2O pressure per hour starting from 5 to 8 cmH2O depending on the individual). Arm_OD of the left biceps muscle and finger_OD of the left index fingertip in sleep hypopneas were simultaneously measured by frequency-domain near-infrared spectroscopy and video-polysomnography photoplethysmography, respectively. Bland-Altman plots were used to illustrate the agreements between arm_OD and finger_OD during baseline sleep and under CPAP. We used t tests to determine whether these measurements significantly differed.
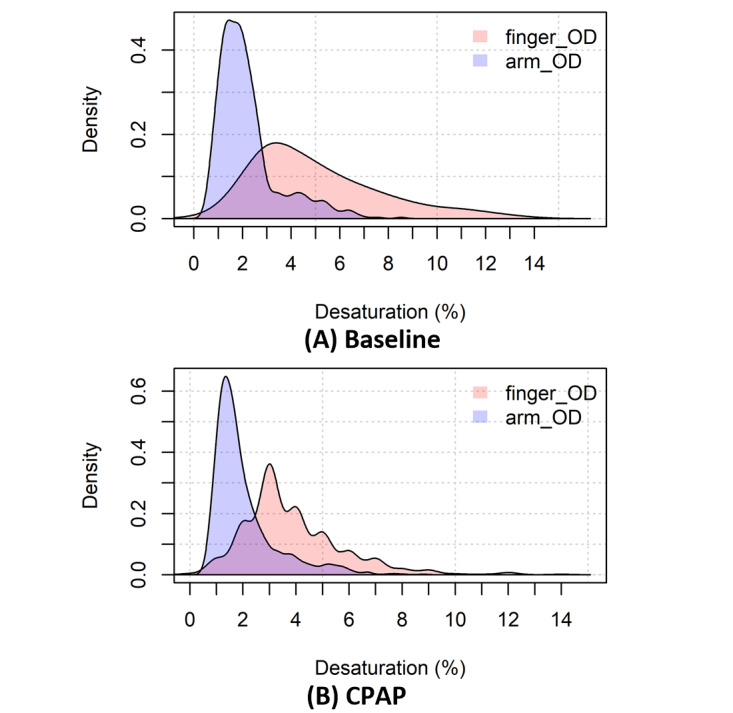
Results: In total, 534 obstructive apneas and 2185 hypopneas were recorded. Of the 2185 hypopneas, 668 (30.57%) were collected during baseline sleep and 1517 (69.43%), during CPAP sleep. The mean difference between finger_OD and arm_OD was 2.86% (95% CI 2.67%-3.06%, t667=28.28; P<.001; 95% limits of agreement [LoA] -2.27%, 8.00%) during baseline sleep and 1.83% (95% CI 1.72%-1.94%, t1516=31.99; P<.001; 95% LoA -2.54%, 6.19%) during CPAP. Using the standard criterion of 3% saturation drop, arm_OD only recognized 16.32% (109/668) and 14.90% (226/1517) of hypopneas at baseline and during CPAP, respectively.
Conclusions: arm_OD is 2% to 3% lower than standard finger_OD in sleep hypopnea, probably because the measured arm_OD originates physiologically from arterioles, venules, and capillaries; thus, the venous blood adversely affects its value. Our findings demonstrate that the standard criterion of ≥3% OD drop at the arm or wrist is not suitable to define hypopnea because it could provide large false-negative results in diagnosing OSA and assessing CPAP treatment effectiveness.
Keywords: continuous positive airway pressure therapy; near-infrared spectroscopy; obstructive sleep apnea; oxygen saturation; photoplethysmography; smartwatch; wearable devices.
©Zhongxing Zhang, Ming Qi, Gordana Hügli, Ramin Khatami. Originally published in the Journal of Medical Internet Research (https://www.jmir.org), 29.07.2021.
Conflict of interest statement
Conflicts of Interest: None declared.
Figures
Similar articles
-
Quantitative Changes in Muscular and Capillary Oxygen Desaturation Measured by Optical Sensors during Continuous Positive Airway Pressure Titration for Obstructive Sleep Apnea.Biosensors (Basel). 2021 Dec 21;12(1):3. doi: 10.3390/bios12010003. Biosensors (Basel). 2021. PMID: 35049631 Free PMC article.
-
Polysomnography in patients with obstructive sleep apnea: an evidence-based analysis.Ont Health Technol Assess Ser. 2006;6(13):1-38. Epub 2006 Jun 1. Ont Health Technol Assess Ser. 2006. PMID: 23074483 Free PMC article.
-
Clinical guidelines for the manual titration of positive airway pressure in patients with obstructive sleep apnea.J Clin Sleep Med. 2008 Apr 15;4(2):157-71. J Clin Sleep Med. 2008. PMID: 18468315 Free PMC article.
-
Montelukast for Sleep Apnea: A Review of the Clinical Effectiveness, Cost Effectiveness, and Guidelines [Internet].Ottawa (ON): Canadian Agency for Drugs and Technologies in Health; 2014 Jan 17. Ottawa (ON): Canadian Agency for Drugs and Technologies in Health; 2014 Jan 17. PMID: 24741731 Free Books & Documents. Review.
-
Detection of Sleep Apnea Using Wearable AI: Systematic Review and Meta-Analysis.J Med Internet Res. 2024 Sep 10;26:e58187. doi: 10.2196/58187. J Med Internet Res. 2024. PMID: 39255014 Free PMC article.
Cited by
-
The Comparison of Early Hemodynamic Response to Single-Pulse Transcranial Magnetic Stimulation following Inhibitory or Excitatory Theta Burst Stimulation on Motor Cortex.Brain Sci. 2023 Nov 20;13(11):1609. doi: 10.3390/brainsci13111609. Brain Sci. 2023. PMID: 38002568 Free PMC article.
-
Highly integrated watch for noninvasive continual glucose monitoring.Microsyst Nanoeng. 2022 Feb 23;8:25. doi: 10.1038/s41378-022-00355-5. eCollection 2022. Microsyst Nanoeng. 2022. PMID: 35310514 Free PMC article.
-
Quantitative Changes in Muscular and Capillary Oxygen Desaturation Measured by Optical Sensors during Continuous Positive Airway Pressure Titration for Obstructive Sleep Apnea.Biosensors (Basel). 2021 Dec 21;12(1):3. doi: 10.3390/bios12010003. Biosensors (Basel). 2021. PMID: 35049631 Free PMC article.
-
Comparison of OPPO Watch Sleep Analyzer and Polysomnography for Obstructive Sleep Apnea Screening.Nat Sci Sleep. 2024 Feb 8;16:125-141. doi: 10.2147/NSS.S438065. eCollection 2024. Nat Sci Sleep. 2024. PMID: 38348055 Free PMC article.
-
The Value of Smartwatches in the Health Care Sector for Monitoring, Nudging, and Predicting: Viewpoint on 25 Years of Research.J Med Internet Res. 2024 Oct 25;26:e58936. doi: 10.2196/58936. J Med Internet Res. 2024. PMID: 39356287 Free PMC article. Review.
References
-
- Depner C, Cheng P, Devine J, Khosla S, de Zambotti Massimiliano, Robillard R, Vakulin A, Drummond Sean P A. Wearable technologies for developing sleep and circadian biomarkers: a summary of workshop discussions. Sleep. 2020 Feb 13;43(2):1–13. doi: 10.1093/sleep/zsz254. http://europepmc.org/abstract/MED/31641776 - DOI - PMC - PubMed
-
- Zhang Z, Cajochen C, Khatami R. social jetlag and chronotypes in the chinese population: analysis of data recorded by wearable devices. J Med Internet Res. 2019 May 11;21(6):e13482. doi: 10.2196/13482. https://www.jmir.org/2019/6/e13482/ - DOI - PMC - PubMed
-
- Perez MV, Mahaffey KW, Hedlin H, Rumsfeld JS, Garcia A, Ferris T, Balasubramanian V, Russo AM, Rajmane A, Cheung L, Hung G, Lee J, Kowey P, Talati N, Nag D, Gummidipundi SE, Beatty A, Hills MT, Desai S, Granger CB, Desai M, Turakhia MP. Large-scale assessment of a smartwatch to identify atrial fibrillation. N Engl J Med. 2019 Nov 14;381(20):1909–1917. doi: 10.1056/nejmoa1901183. - DOI - PMC - PubMed
-
- Wen D, Zhang X, Liu X, Lei J. evaluating the consistency of current mainstream wearable devices in health monitoring: a comparison under free-living conditions. J Med Internet Res. 2017 Mar 07;19(3):e68. doi: 10.2196/jmir.6874. https://www.jmir.org/2017/3/e68/ - DOI - PMC - PubMed
-
- Haghayegh S, Khoshnevis S, Smolensky MH, Diller KR, Castriotta RJ. Accuracy of wristband fitbit models in assessing sleep: systematic review and meta-analysis. J Med Internet Res. 2019 Nov 28;21(11):e16273. doi: 10.2196/16273. https://www.jmir.org/2019/11/e16273/ - DOI - PMC - PubMed
Publication types
MeSH terms
LinkOut - more resources
Full Text Sources
Medical
Miscellaneous
