. 2021 Jul 30;373(6554):eabd2893.
doi: 10.1126/science.abd2893.

Thymic stromal lymphopoietin induces adipose loss through sebum hypersecretion

Affiliations

Thymic stromal lymphopoietin induces adipose loss through sebum hypersecretion

Ruth Choa et al. Science. .

Abstract

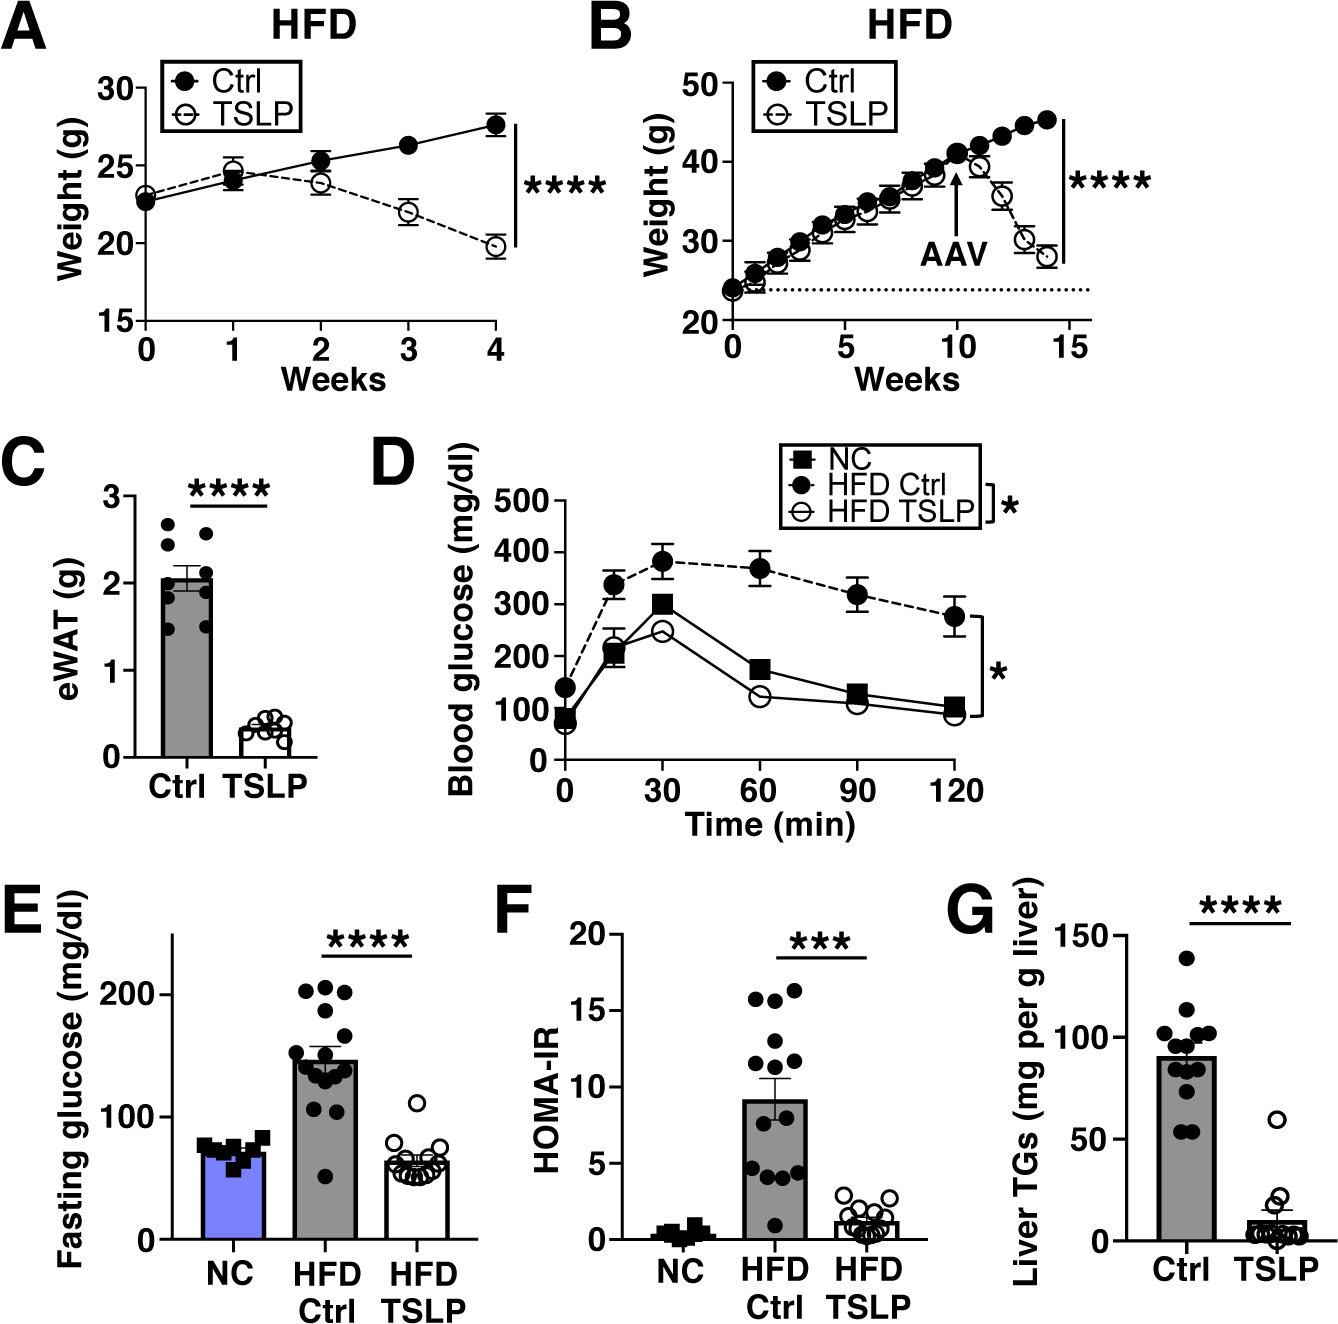
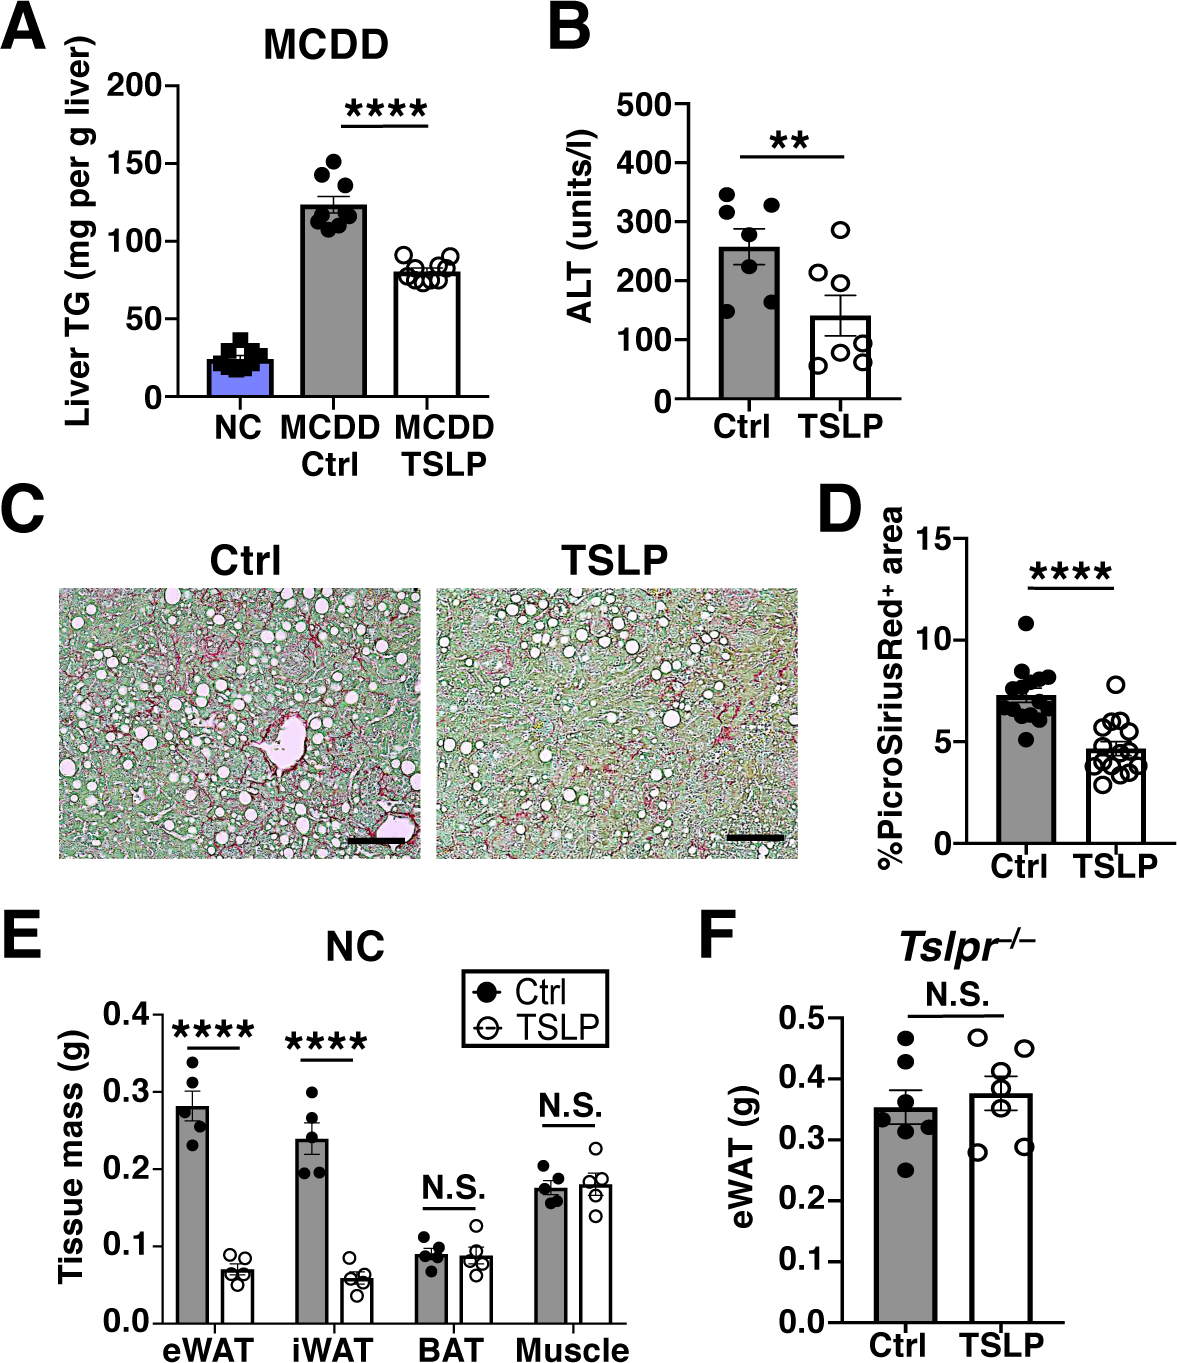
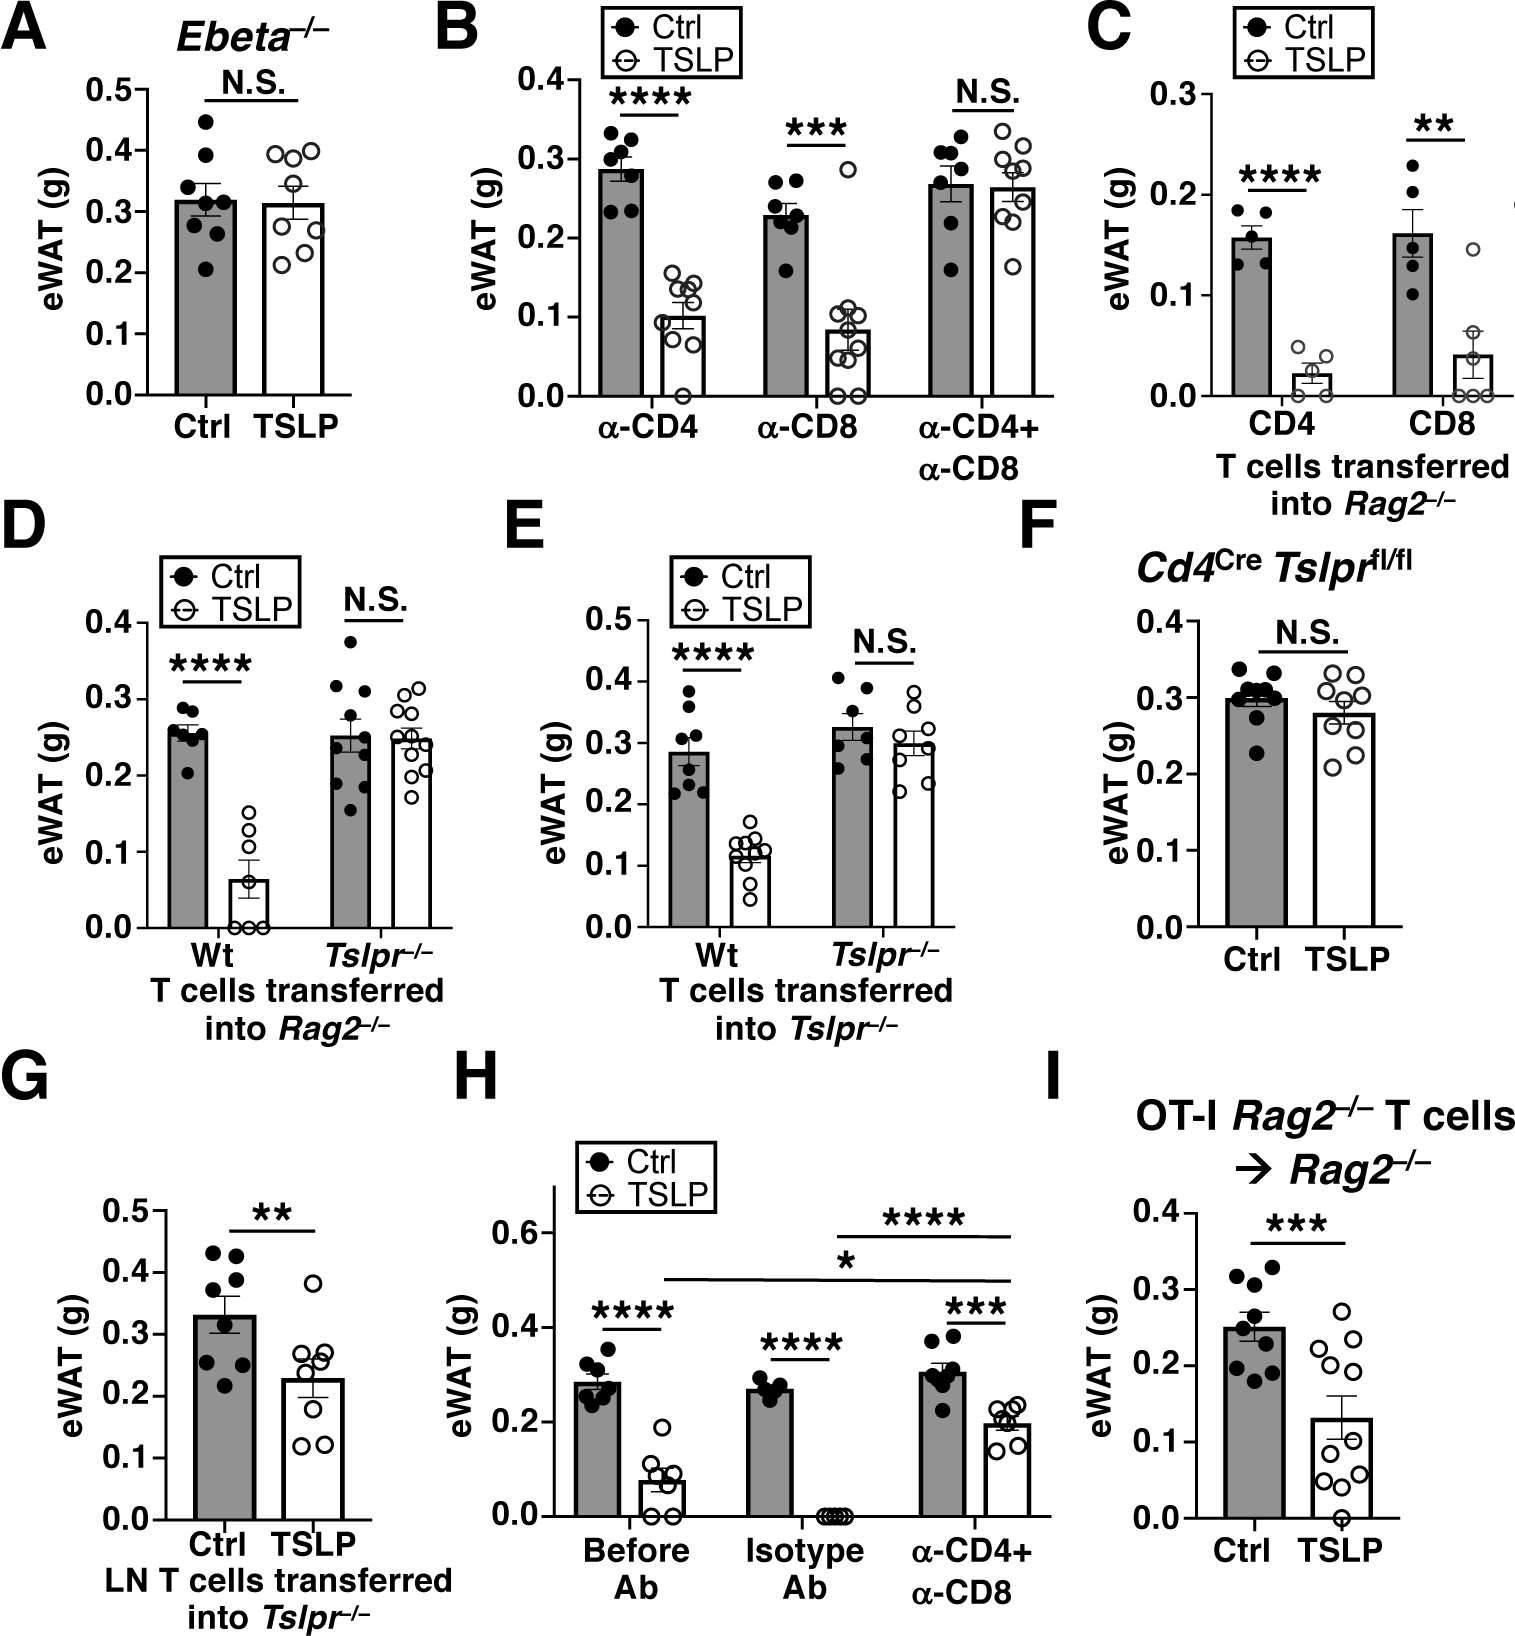
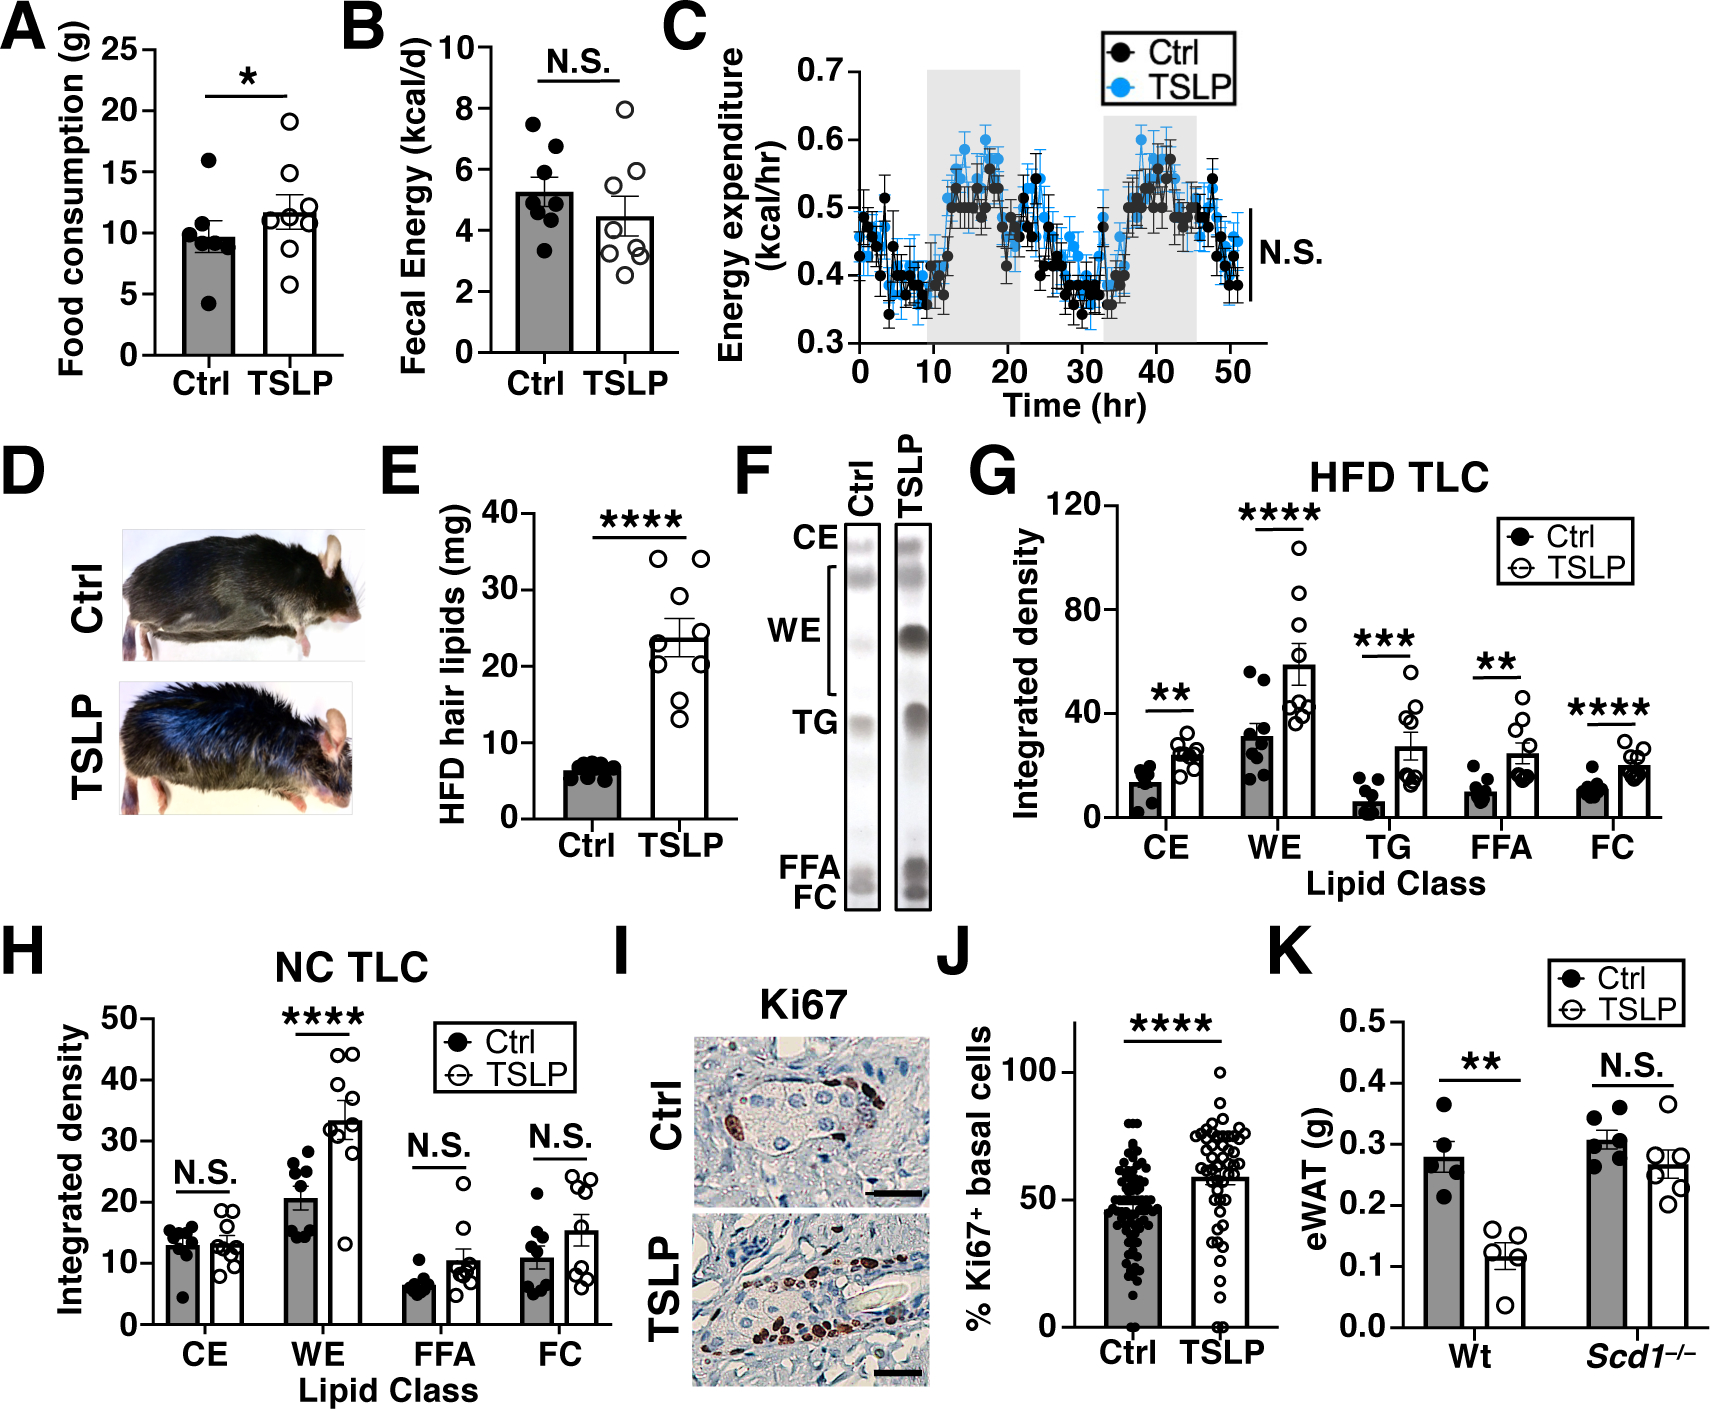
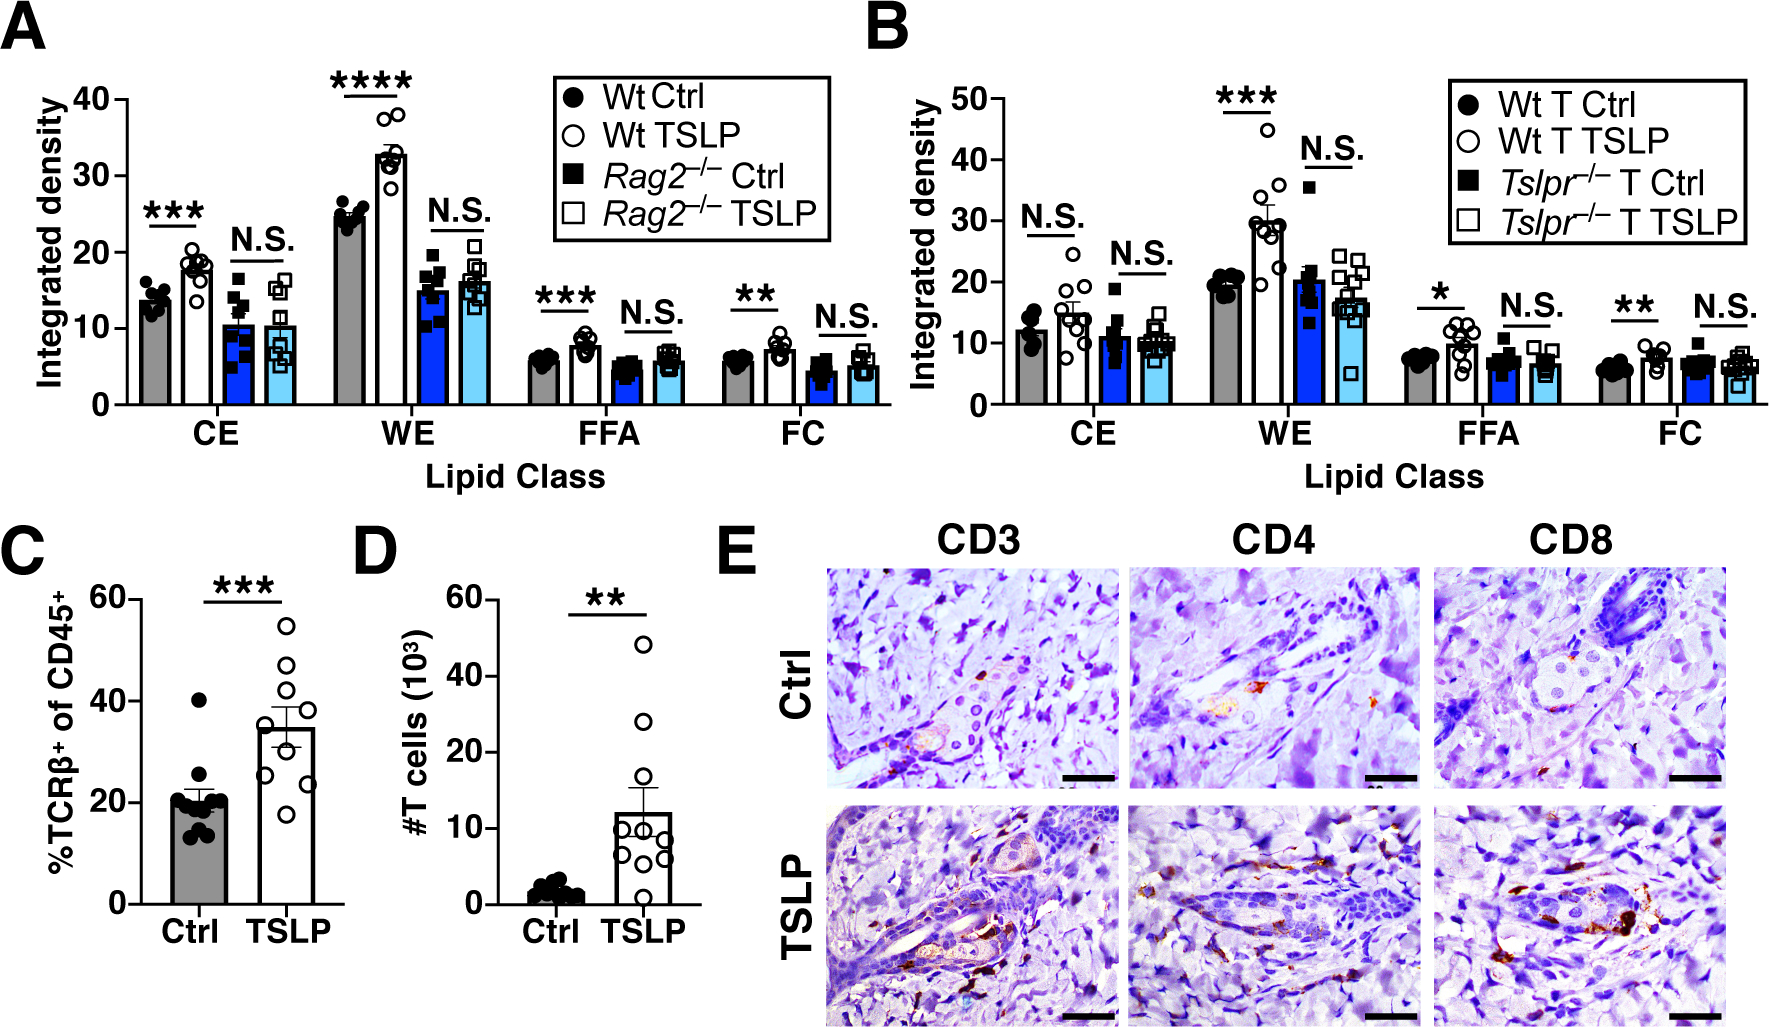
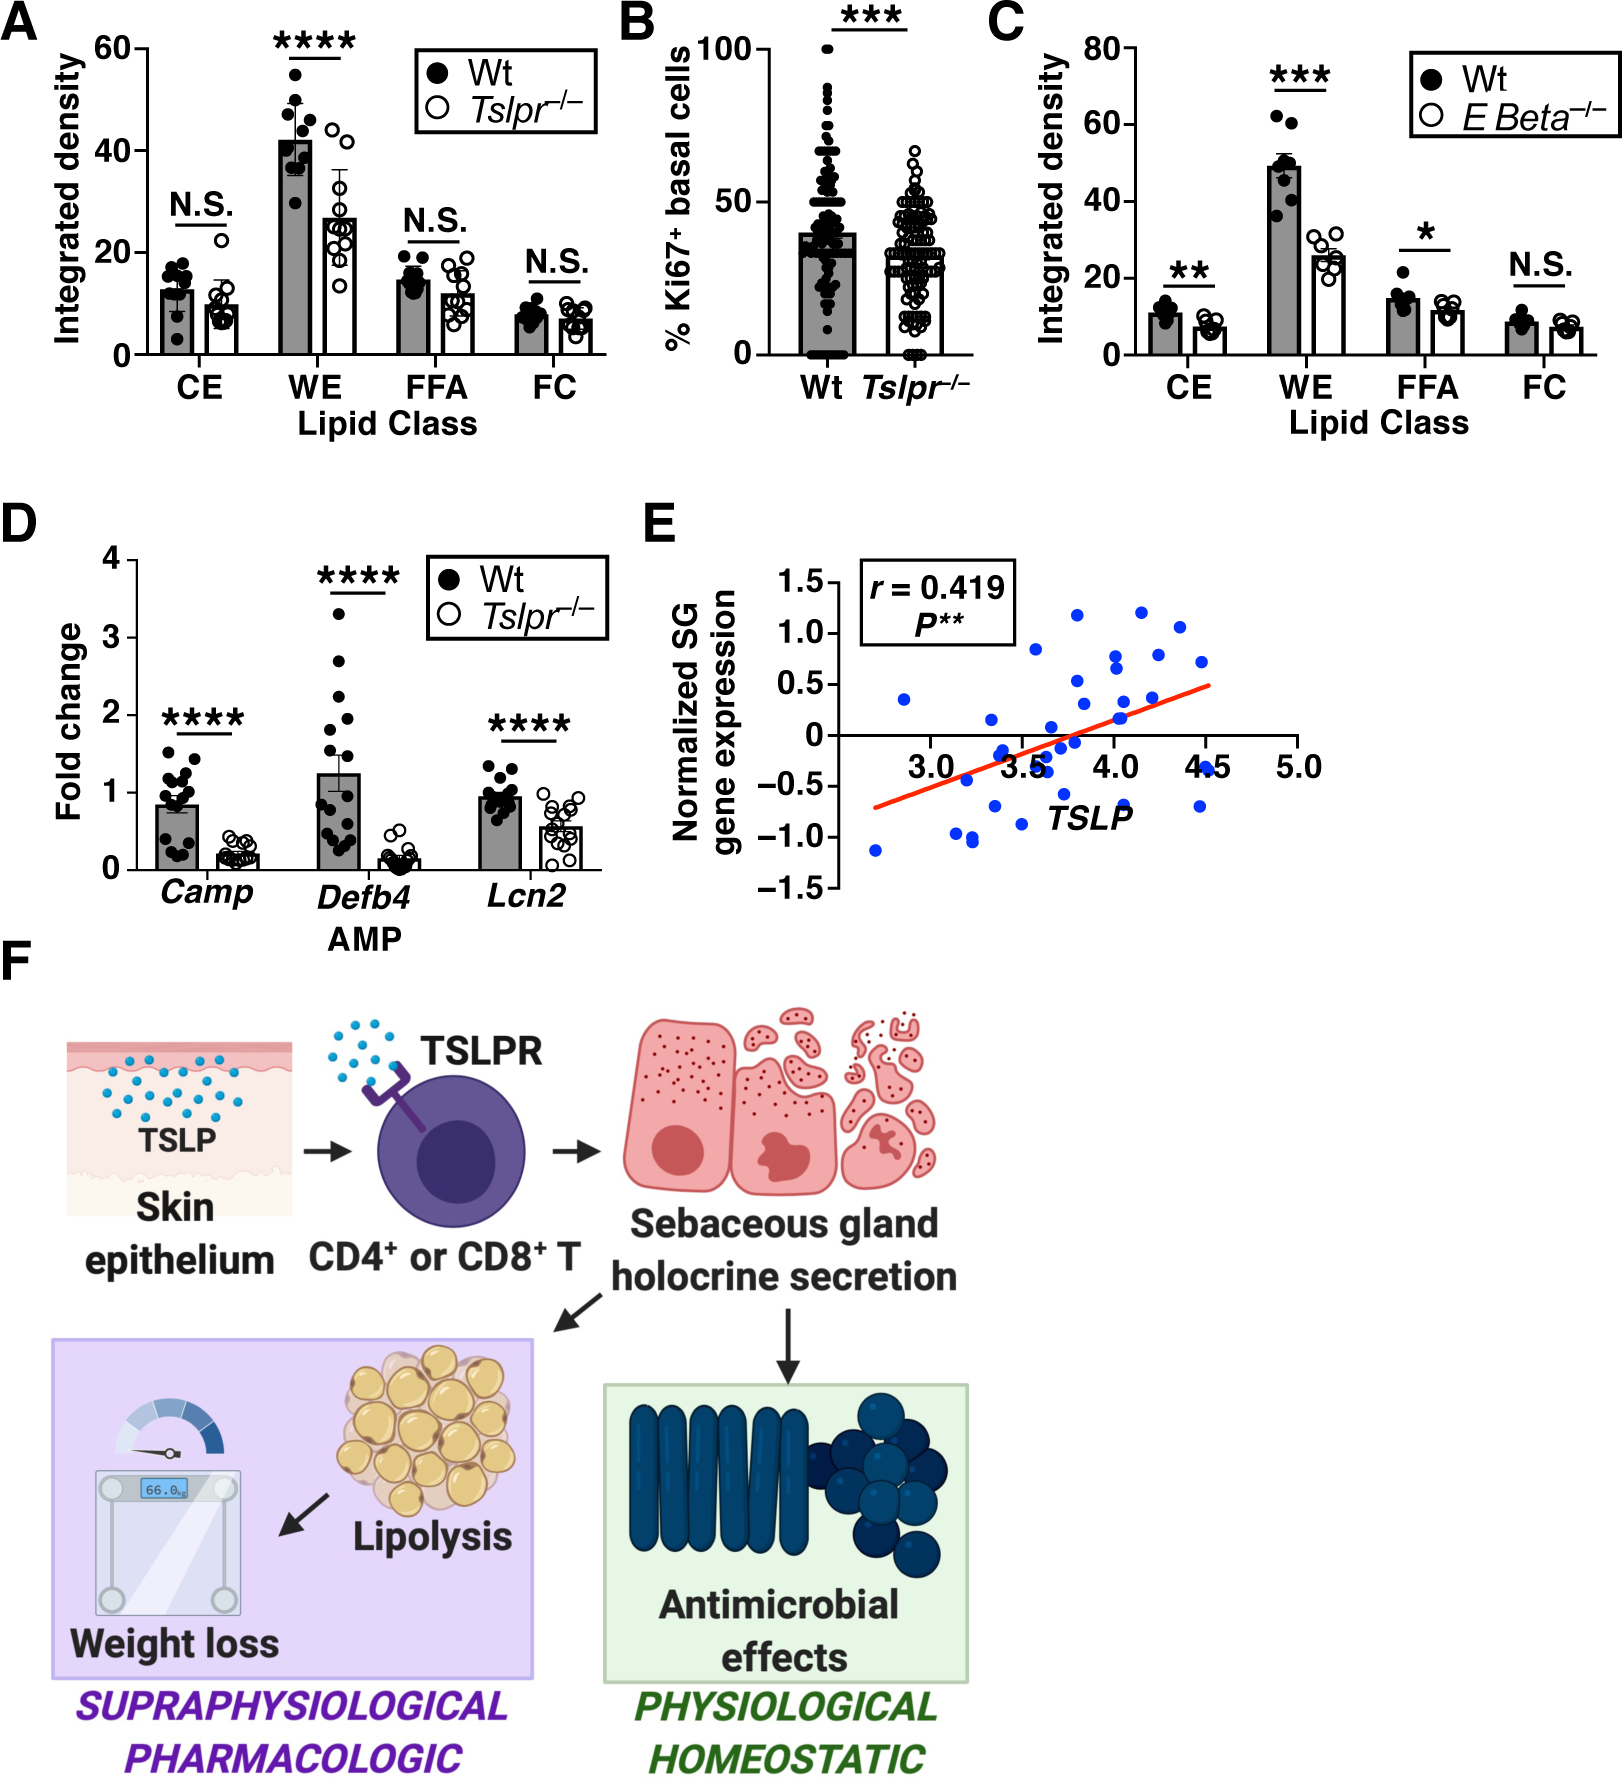
Emerging studies indicate that the immune system can regulate systemic metabolism. Here, we show that thymic stromal lymphopoietin (TSLP) stimulates T cells to induce selective white adipose loss, which protects against obesity, improves glucose metabolism, and mitigates nonalcoholic steatohepatitis. Unexpectedly, adipose loss was not caused by alterations in food intake, absorption, or energy expenditure. Rather, it was induced by the excessive loss of lipids through the skin as sebum. TSLP and T cells regulated sebum release and sebum-associated antimicrobial peptide expression in the steady state. In human skin, TSLP expression correlated directly with sebum-associated gene expression. Thus, we establish a paradigm in which adipose loss can be achieved by means of sebum hypersecretion and uncover a role for adaptive immunity in skin barrier function through sebum secretion.


Conflict of interest statement

Competing interests: U.S. Provisional Patent Application No. 62/972,462 was filed by the University of Pennsylvania. The inventors are Taku Kambayashi and Ruth Choa. The patent application is based on the finding that TSLP induces sebum secretion from the skin and that this can lead to treatment of skin conditions and obesity and its complications.

Figures

Fig. 1.
Fig. 1.. TSLP protects against diet-induced obesity and glucose intolerance.
(A) Weights of HFD-fed mice post AAV (Control-AAV or TSLP-AAV). (n=13 mice/group, pooled from 3 independent experiments). F-test. (B to G) Mice fed HFD for 10 weeks prior to AAV and for another 4 weeks thereafter. (B) Weights (n=9 mice/group, pooled from 3 independent experiments). F-test. (C) eWAT masses (n=8–9 mice/group, pooled from 3 independent experiments). t-test. (D) Blood glucose following glucose tolerance test (GTT, n=8–10 mice/HFD group, pooled from 2 independent experiments, with n=5 NC mice shown for reference). F-test. (E) Fasting blood glucose (n=13–15 mice/HFD group, pooled from 3 independent experiments, with n=8 NC mice shown for reference). F-test. (F) HOMA-IR (n=13–14 mice/HFD group, pooled from 3 independent experiments, with n=8 NC mice shown for reference). t-test. (G) Liver TGs (n=12–13 mice/group, pooled from 3 independent experiments). t-test. N.S.=not significant, P≥0.05, *P<0.05, ***P<0.001, ****P<0.0001. Data are mean ± SEM.
Fig. 2.
Fig. 2.. TSLP ameliorates MCDD-driven liver damage and induces selective white adipose loss in NC-fed mice.
(A to D) Mice fed MCDD for 4 weeks prior to AAV and for another 4 weeks thereafter. (A) Liver TGs (n=9–10 mice/MCDD group, pooled from 2 independent experiments, with n=9 NC mice shown for reference). t-test. (B) Serum ALT levels (n=7 mice/group, pooled from 2 independent experiments). t-test. (C and D) Representative PicroSiriusRed liver staining and quantification (n=15 mice/group, pooled from 3 independent experiments). t-test. Scale bars=100 μm. (E and F) NC-fed mice. (E) eWAT, iWAT, BAT, and quadriceps muscle masses, 2 weeks post AAV (n=5 mice/group, 1 representative of at least 10 independent experiments shown). Student’s t test. (F) eWAT masses of Tslpr−/− mice, 2 weeks post AAV (n=7 mice/group, pooled from 2 independent experiments). t-test. N.S., P≥0.05, **P<0.01, ****P<0.0001. Data are mean ± SEM.
Fig. 3.
Fig. 3.. TSLPR signaling in T cells is required for TSLP-driven adipose loss.
(A) eWAT masses of Ebeta−/− mice, 2 weeks post AAV (n=8 mice/group, pooled from 3 independent experiments). t-test. (B) eWAT masses of Wt mice injected with α-CD4±α-CD8, 2 weeks post AAV (n=7–10 mice/group, pooled from 3 independent experiments). t-test. (C) eWAT masses of Rag2−/− mice reconstituted with CD4+ or CD8+ T cells, 2 weeks post AAV (n=5–6 mice/group, pooled from 2 independent experiments). t-test. (D) eWAT masses of Rag2−/− mice reconstituted with Wt or Tslpr−/− T cells, 2 weeks post AAV (n=7–11 mice/group, pooled from 3 independent experiments). t-test. (E) eWAT masses of Tslpr−/− mice reconstituted with Wt or Tslpr−/− T cells, 2 weeks post AAV (n=7–10 mice/group, pooled from 3 independent experiments). t-test. (F) eWAT masses of Cd4Cre Tslprfl/fl mice, 2 weeks post AAV (n=9 mice/group, pooled from 3 independent experiments). t-test. (G) eWAT masses of Tslpr−/− mice transferred with skin-draining lymph node (LN) T cells from either Ctrl-AAV- or TSLP-AAV- injected Wt mice, 2 weeks post cell transfer (n=8 mice/group, pooled from 2 independent experiments). t-test. (H) eWAT masses of AAV-injected Wt mice before antibody injection (2 weeks post AAV, n=7 mice/group), 2 weeks after isotype antibody injection (4 weeks post AAV, n=5 mice/group), or 2 weeks after α-CD4+α-CD8 antibody injection (4 weeks post AAV, n=7–8 mice/group). Data pooled from 2 independent experiments. t-test. (I) eWAT masses of Rag2−/− mice reconstituted with T cells from OT-I Rag2−/− mice, 2 weeks post AAV (n=9–11 mice/group, pooled from 3 independent experiments). t-test. N.S., P≥0.05, *P<0.05, **P<0.01, ***P<0.001, ****P<0.0001. Data are mean ± SEM.
Fig. 4.
Fig. 4.. TSLP induces adipose loss by promoting sebum secretion.
(A) Food consumption, 9–11 days post AAV (n=7–8 mice/group, 1 representative of 2 independent experiments shown). Student’s t test. (B) Fecal calories, 9–11 days post AAV (n=8 mice/group, pooled from 2 independent experiments). t-test. (C) Energy expenditure, 9–11 days post AAV (n=7–8 mice/group, 1 representative of 2 independent experiments shown). ANOVA. (D to G) Mice fed HFD for 10 weeks prior to AAV and for another 4 weeks thereafter. (D) Gross appearance. (E) Hair lipid mass (n=9 mice/group, pooled from 3 independent experiments). t-test. (F and G) TLC plot and quantification of hair lipids (CE=cholesterol esters, WE=wax esters, TG=triglycerides, FFA=free fatty acids, FC=free cholesterol, n=9 mice/group, pooled from 3 independent experiments). t-test. (H) TLC quantification of hair lipids from NC-fed mice, 10 days post AAV (n=9 mice/group, pooled from 3 independent experiments). t-test. (I and J) Sebaceous gland Ki67 staining and quantification, 10 days post AAV (n=78 Ctrl and 50 TSLP sebaceous glands from three mice/group, pooled from 2 independent experiments). t-test. Scale bars=20 μm. (K) eWAT masses of Wt or Scd1−/− mice, 2 weeks post AAV (n=5–6 mice/group, pooled from 2 independent experiments). t-test. N.S., P≥0.05, *P<0.05, **P<0.01, ***P<0.001, ****P<0.0001. Data are mean ± SEM.
Fig. 5.
Fig. 5.. TSLP stimulates T cells to promote sebum production and increases T cells in the skin.
(A) TLC quantification of hair lipids from Wt and Rag2−/− mice, 2 weeks post AAV (n=8 mice/group, pooled from 3 independent experiments). t-test. (B) TLC quantification of hair lipids from Rag2−/− mice reconstituted with Wt or Tslpr−/− T cells, 2 weeks post AAV (n=6–9 mice/Wt T cell group, pooled from 2 independent experiments, and n=9–11 mice/Tslpr−/− T cell group, pooled from 3 independent experiments). t-test. (C and D) Percentage and number of skin T cells by flow cytometry, 10 days post AAV (n=9–11 mice/group, pooled from 3 independent experiments). t-test. (E) Skin CD3, CD4, and CD8 immunohistochemical staining, 10 days post AAV. Scale bars=40 μm. N.S., P≥0.05, *P<0.05, **P<0.01, ***P<0.001, ****P<0.0001. Data are mean ± SEM.
Fig. 6.
Fig. 6.. TSLP and T cells regulate sebum secretion at homeostasis.
(A) TLC quantification of hair lipids from Wt versus Tslpr−/− mice at baseline (n=11 mice/group, pooled from 3 independent experiments). t-test. (B) Ki67 quantification of sebaceous glands from Wt versus Tslpr−/− mice (n=132 Wt and 109 Tslpr−/− sebaceous glands from three mice/group, pooled from 2 independent experiments). t-test. (C) TLC quantification of hair lipids from Wt versus Ebeta−/− mice at baseline (n=7–8 mice/group, pooled from 3 independent experiments). t-test. (D) Expression of sebum-associated AMPs in the skin (n=16 mice/group, qPCR normalized to Hprt expression, pooled from 3 independent experiments). t-test. (E) Correlation analysis of sebaceous gland (SG) gene expression versus TSLP expression in human skin (n=36 healthy subjects). Pearson correlation and linear regression slope test. (F) Model for pharmacologic and homeostatic roles of TSLP-driven sebum secretion. N.S., P≥0.05, *P<0.05, **P<0.01, ***P<0.001, ****P<0.0001. Data are mean ± SEM.

Comment in

  • Losing fat through the skin.
    Schneider MR. Schneider MR. Science. 2021 Jul 30;373(6554):487-488. doi: 10.1126/science.abg9079. Science. 2021. PMID: 34326221 No abstract available.
  • TSLP uses up fats to coat the skin.
    Bordon Y. Bordon Y. Nat Rev Immunol. 2021 Sep;21(9):545. doi: 10.1038/s41577-021-00612-0. Nat Rev Immunol. 2021. PMID: 34363038 No abstract available.
  • Greasy hair against obesity.
    Nickel S, Christ B. Nickel S, et al. Signal Transduct Target Ther. 2021 Dec 17;6(1):429. doi: 10.1038/s41392-021-00850-7. Signal Transduct Target Ther. 2021. PMID: 34921132 Free PMC article. No abstract available.

References

    1. Hruby A, Hu FB, The Epidemiology of Obesity: A Big Picture. Pharmacoeconomics 33, 673–689 (2015). - PMC - PubMed
    1. Mitchell NS, Catenacci VA, Wyatt HR, Hill JO, Obesity: overview of an epidemic. Psychiatr Clin North Am 34, 717–732 (2011). - PMC - PubMed
    1. Mokdad AH et al., Prevalence of obesity, diabetes, and obesity-related health risk factors, 2001. JAMA 289, 76–79 (2003). - PubMed
    1. Qiu Y et al., Eosinophils and type 2 cytokine signaling in macrophages orchestrate development of functional beige fat. Cell 157, 1292–1308 (2014). - PMC - PubMed
    1. Brestoff JR et al., Group 2 innate lymphoid cells promote beiging of white adipose tissue and limit obesity. Nature 519, 242–246 (2015). - PMC - PubMed

Publication types

MeSH terms

LinkOut - more resources