. 2022 Mar 1;163(3):e432-e452.
doi: 10.1097/j.pain.0000000000002422.

Diversity of inhibitory and excitatory parvalbumin interneuron circuits in the dorsal horn

Affiliations

Diversity of inhibitory and excitatory parvalbumin interneuron circuits in the dorsal horn

Mark A Gradwell et al. Pain. .

Abstract

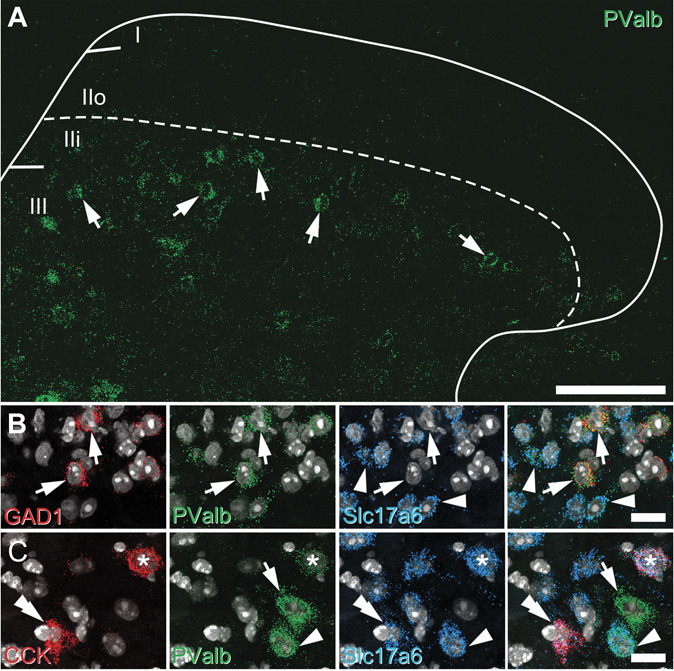
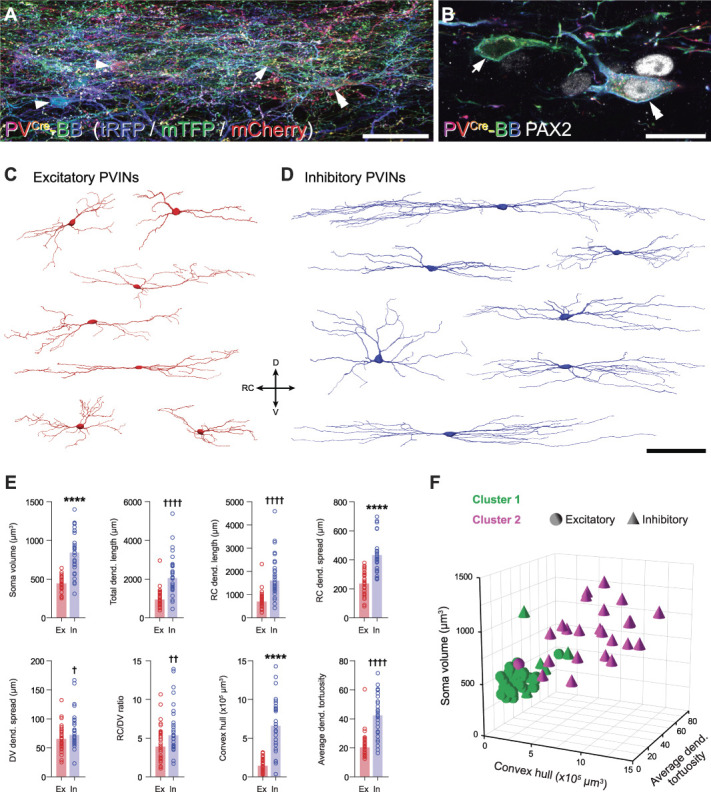
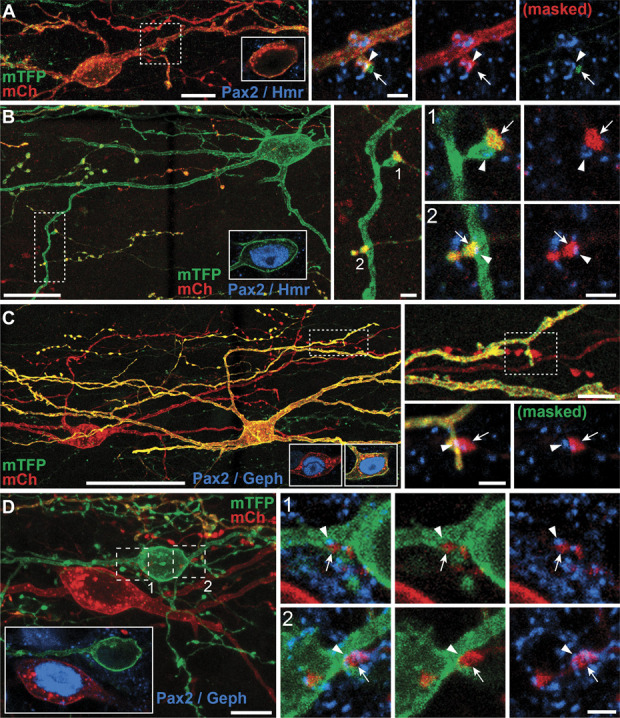
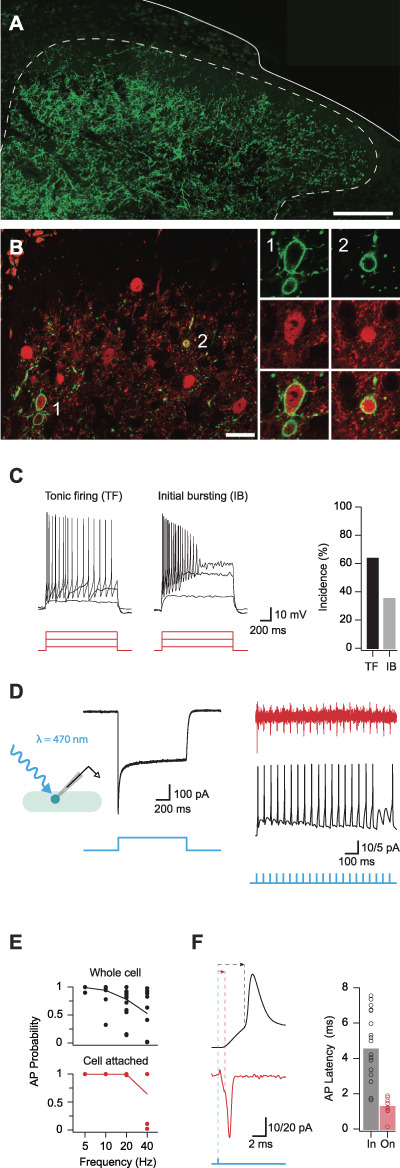
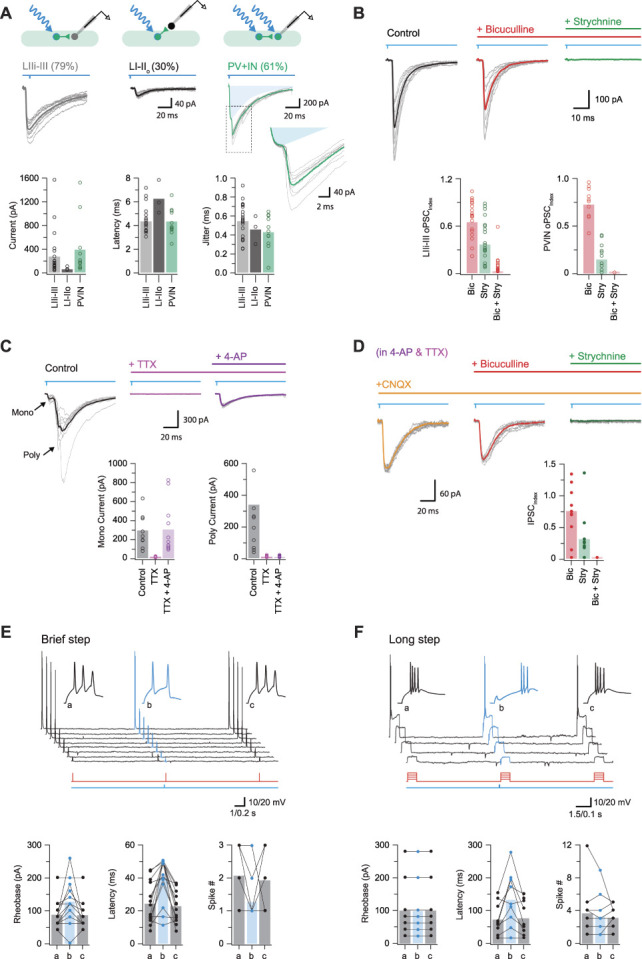
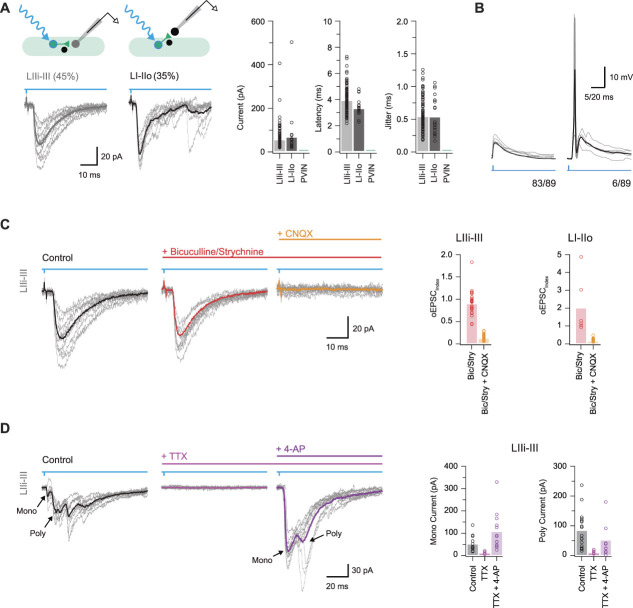
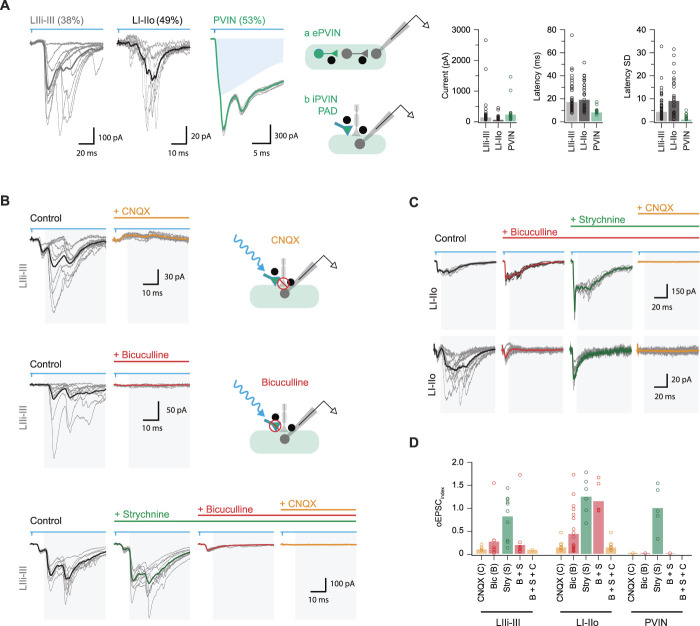
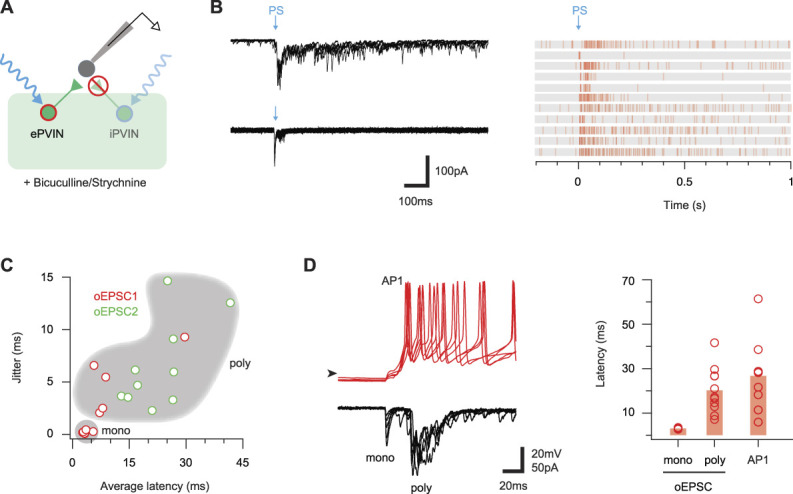
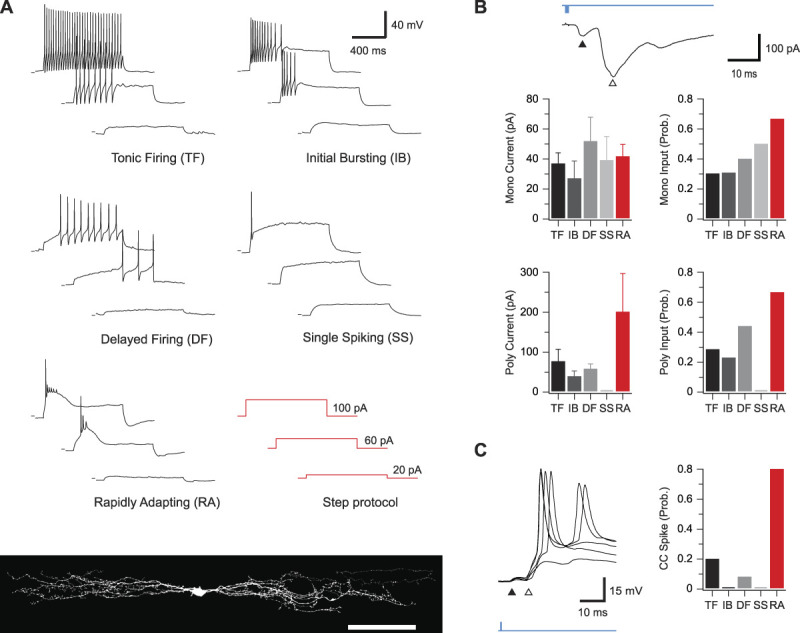
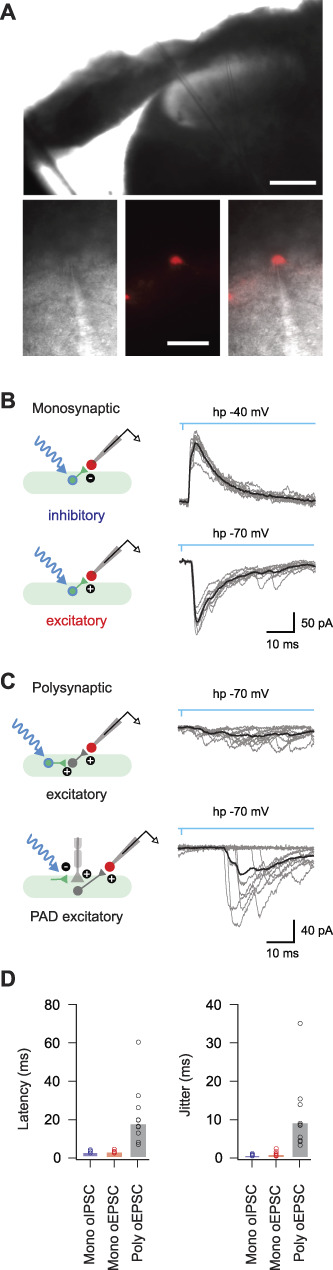
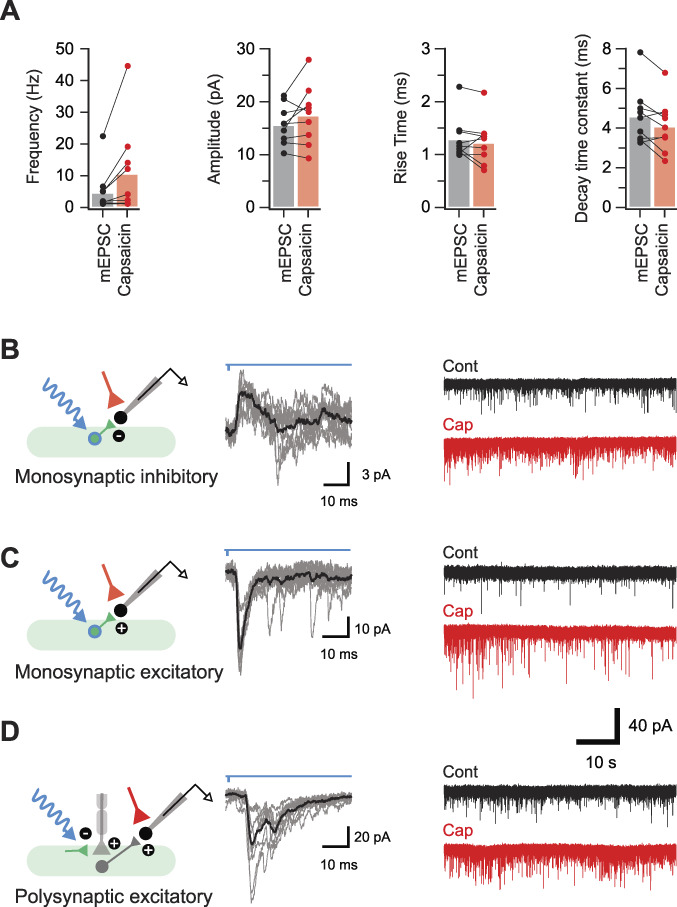
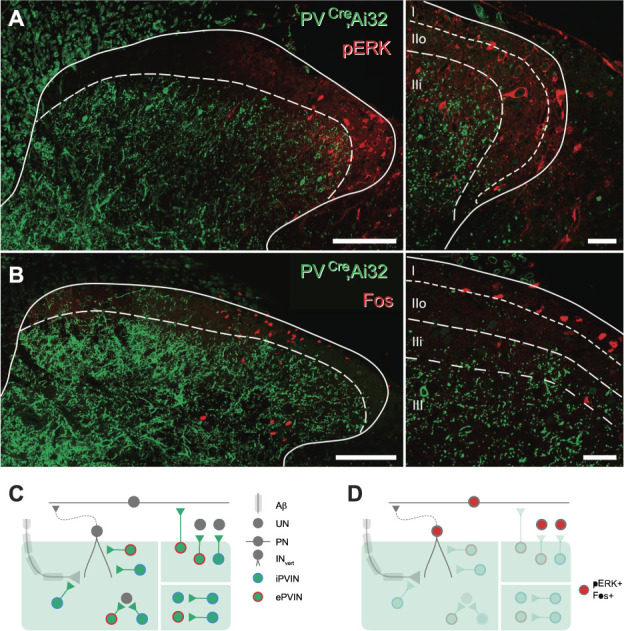
Parvalbumin-expressing interneurons (PVINs) in the spinal dorsal horn are found primarily in laminae II inner and III. Inhibitory PVINs play an important role in segregating innocuous tactile input from pain-processing circuits through presynaptic inhibition of myelinated low-threshold mechanoreceptors and postsynaptic inhibition of distinct spinal circuits. By comparison, relatively little is known of the role of excitatory PVINs (ePVINs) in sensory processing. Here, we use neuroanatomical and optogenetic approaches to show that ePVINs comprise a larger proportion of the PVIN population than previously reported and that both ePVIN and inhibitory PVIN populations form synaptic connections among (and between) themselves. We find that these cells contribute to neuronal networks that influence activity within several functionally distinct circuits and that aberrant activity of ePVINs under pathological conditions is well placed to contribute to the development of mechanical hypersensitivity.


Conflict of interest statement

The authors have no conflicts of interest to declare.

Sponsorships or competing interests that may be relevant to content are disclosed at the end of this article.

Figures

Figure 1.
Figure 1.
Neurochemical characterisation of parvalbumin cells in the spinal dorsal horn using fluorescent in situ hybridisation. (A) Lumbar spinal cord sections processed for fluorescent in situ hybridisation to map parvalbumin expression (PValb; green) showed most cells were concentrated in laminae IIi and III (arrows). (B) Multiple labelling with probes for GAD1 (red; inhibitory interneurons), PValb (green), Slc17a6 (blue; for excitatory interneurons), and NucBlue (gray) was used to show that approximately half of the PVINs in laminae I-III were inhibitory interneurons (arrows), with the remainder being excitatory interneurons (arrowheads). (C) Similar studies using probes to CCK (red), PValb (green), Slc17a6 (blue), and NucBlue (gray) to show that approximately 75% of excitatory PVINs co-express CCK (asterisk), but these account for only ∼25% of CCK population (double arrowhead). This field also shows an ePVIN (arrowhead) and iPVIN (arrow), neither of which co-express CCK. All images are generated from a single optical section. Scale bars (µm): A = 100; B and C = 25. iPVIN, inhibitory parvalbumin-expressing interneuron; PVIN, parvalbumin-expressing interneuron.
Figure 2.
Figure 2.
Morphometric analyses of Brainbow-labelled excitatory and inhibitory PV interneurons. (A) Example of Brainbow labelling in laminae IIi/III of a sagittal section from a PVCre mouse injected with AAV.Brainbow1 and AAV.Brainbow2, showing a dense plexus of Brainbow-labelled PV cells in laminae IIi and III. Examples of individual cell bodies within this plexus are highlighted with arrowheads. The cells highlighted with an arrow and a double arrowhead are shown at higher magnification in (B). This image is a maximum projection of 107 optical sections at 0.5 µm z-spacing. (B) Higher magnification of 2 cells outlined in panel (A) (arrow and double arrowhead), generated from a single optical section. This figure demonstrates the use of immunostaining for Pax2 to identify inhibitory (double arrowhead; Pax2-expressing) and excitatory (arrow; lacking Pax2) Brainbow-labelled PVINs. (C and D) Representative 3D reconstructions of the somatodendritic morphology of excitatory (C, red) and inhibitory (D, blue) Brainbow-labelled PVINs. DV, dorsoventral axis; RC, rostrocaudal axis. (E) Grouped scatterplots of selected morphometric parameters of all reconstructed excitatory (Ex; red; n = 34) and inhibitory (In; blue; n = 30) PVINs. Key to y-axes: Dend, dendritic; RC dend. length, total length of dendrite projecting in the rostrocaudal axis; RC dend. spread and DV dend. spread are the distances between the most distal points in the rostrocaudal and dorsoventral axes, respectively; RC/DV ratio, RC dend. spread/DV dend. spread. ****P < 0.0001 by the unpaired t test for normally distributed data; †P < 0.05, ††P < 0.01, ††††P < 0.0001 by the Mann–Whitney test for nonnormally distributed data. Bars for normally distributed data show mean, and bars for nonnormally distributed data show median. (F) Scatterplot of soma volume (y-axis) vs convex hull volume (x-axis) vs average dendritic tortuosity for all reconstructed PV interneurons (z-axis), grouped by K-means–derived cluster (cluster 1 or cluster 2; green or magenta, respectively) and neurotransmitter phenotype (excitatory or inhibitory; spheres or cones, respectively). Note that these 3 axis variables were selected for this visualisation because they are assumed to be independent of each other. Scale bars (µm): A = 50; B = 20; C and D = 100. AAV, adeno-associated virus; PV, parvalbumin; PVIN, parvalbumin-expressing interneuron.
Figure 3.
Figure 3.
Homotypic and heterotypic synaptic connectivity between PVINs in laminae IIi and III. (A and B) Examples of homotypic synaptic connections made by ePVINs onto other ePVINs (A) and heterotypic synaptic connections onto iPVINs (B). Insets in (A and B) show the presence or absence of Pax2 (blue) in the soma of the target neuron. High-power insets of areas outlined on the target neurons show axon terminals (arrows) forming excitatory synaptic inputs on to the dendrites of excitatory (A) and inhibitory PVINs (B), respectively. Excitatory synapses are verified by the presence of immunolabelling for Homer1 (blue; arrowheads). (C and D) Examples of homotypic synaptic connections made by iPVINs onto other iPVINs (C) and heterotypic synaptic connections onto ePVINs (D). Insets in (C and D) show the presence or absence of Pax2 (blue) in soma of the presynaptic and postsynaptic neurons illustrated. High-power insets of areas outlined on the target neurons show axon terminals (arrows) forming inhibitory synaptic inputs onto the dendrites of inhibitory (C) and excitatory PVINs (D). Inhibitory synapses are verified by the presence of immunolabelling for gephyrin (blue; arrowheads). Lower-power panels are maximum projections of 35, 115, 132, and 47 optical sections for figures (A, B, C, and D), respectively, with a z-separation of 0.5 µm (A and C) or 0.3 µm (B and D). Insets detailing Pax2 immunolabelling in cell bodies are single optical sections. High-power panels detailing synaptic contacts are maximum projections generated from 3 optical sections at 0.3 µm z-steps. Scale bars (µm): A = 10 and 2; B = 20, 2 and 2; C = 50, 5 and 2; D = 10 and 2. ePVIN, excitatory parvalbumin-expressing interneuron; iPVIN, Inhibitory parvalbumin-expressing interneuron; PVIN, parvalbumin-expressing interneuron.
Figure 4.
Figure 4.
ChR2 expression and activation in PVINs. (A) Representative image showing the distribution of ChR2:YFP expression (green) in the lumbar dorsal horn of a PVCre;Ai32 mouse. (B) Left panel compares ChR2:YFP expression (green) and PV-IR profiles (red). Most ChR2:YFP neurons express PV-IR (98%) examples noted (1, 2), although relatively few PV-IR profiles express ChR2:YFP (9%) (double arrow). Right images show neurons labelled “1” and “2” (from left image) at high magnification: ChR2:YFP (upper), PV-IR (middle), and merge (lower). (C) Upper traces show action potential discharge in PVINs recorded during depolarising step current injections (lower, 20, 60, and 100 pA steps shown). PVIN discharge patterns could be reliably classified as either tonic firing or initial bursting. Bar plot (right) shows incidence of PVIN discharge patterns. (D) Trace shows example photocurrent recording from a PVIN. Recorded in voltage clamp, PVINs exhibit large inward photocurrents in response to photostimulation. Inset schematic shows recording arrangement with photostimulation. (E) Traces show 1 ms photostimulation at 20 Hz reliably evokes AP discharge in PVINs in cell-attached voltage-clamp recordings (upper, red) and whole-cell current-clamp recording (lower, black). Blue trace (bottom) indicates the photostimulation protocol for each representative trace. Plots (right) compare the reliability of evoked AP discharge across a range of photostimulation frequencies using whole-cell (upper) and cell-attached (lower) recording configurations. (F) Traces compare photostimulation-evoked action potential spiking using whole-cell (upper) and cell-attached (lower) recording configurations. Note, recruitment latency (time between photostimulation and AP threshold) is shorter in the cell-attached mode. Bar graphs (right) show variability in recruitment latency using whole-cell (black) and cell-attached (red) recording configurations. Short latencies observed in the cell-attached configuration suggest that the ChR2-expressing PVINs require at least ∼2 ms to generate an AP during photostimulation. Scale bar in A = 200 μm. PVIN, parvalbumin-expressing interneuron.
Figure 5.
Figure 5.
Inhibitory parvalbumin-expressing interneurons (iPVINs) provide mixed, glycine-dominant postsynaptic inhibition. (A) Upper schematics show the 3 recording configurations used to study monosynaptic connections: iPVIN to lamina IIi-III neurons, iPVIN to lamina I-IIo neurons, and iPVIN to PVIN. Voltage-clamp recordings (−70 mV) showing optically evoked inhibitory postsynaptic currents (oIPSCs) in lamina I-IIo neurons, lamina IIi-III neurons, and PVINs (10 consecutive sweeps and average overlayed). Blue shading in PVIN trace denotes underlying photocurrent isolated by a pharmacological block of synaptic events. Group data right compare oIPSC amplitude, latency, and latency standard deviation (jitter). (B) Representative oIPSC recording in CNQX (black) and after sequential bath application of bicuculline (red) and strychnine (green). Group data below summarise the effect of these drugs in lamina IIi-III neurons (left) and PVINs (right), highlighting glycine-dominant oIPSCs (ie, the IPSC index is most reduced by strychnine). (C) Representative photostimulation (black) and after sequential bath application of TTX (pink) and 4-AP (purple). Addition of TTX blocks the action potential–dependent oPSCs, which can be recovered by addition of 4-AP. Group data below summarise effects of drug application on monosynaptic currents (bottom left) and longer-latency polysynaptic currents (bottom right), highlighting the drug cocktail's ability to isolate monosynaptic responses. (D) Traces from the same recording in C (in TTX and 4-AP) after sequential addition of CNQX, bicuculline, and strychnine. Bicuculline produced a moderate reduction in the oIPSC amplitude and strychnine abolished the response. Group data below summarise this pharmacology with the oIPSC index reduced to ∼0.75 in bicuculline, ∼0.25 in strychnine, and abolished in both drugs. (E) Top traces show AP discharge responses recorded in a lamina IIi-III neuron during brief (50 ms) depolarizing step injections: (a) pretest step, (b) test step—preceded by a PVIN photostimulation, and (c) posttest step (timing of current steps in red and photostimulation in blue, below). Insets show the AP onset on expanded time. Group data plots below summarise group data showing rheobase, latency, and number of spikes in response to stimulation are all altered by preceding activation of PVINs and the associated inhibition they mediate. (F) Plot shows same general experimental approach as in (D); however, depolarizing current injections were of longer duration (500 ms). Under these conditions only spike latency was altered by preceding PVIN photostimulation, whereas rheobase and spike number were unchanged.
Figure 6.
Figure 6.
Excitatory parvalbumin-expressing interneurons are a source of monosynaptic glutamatergic excitation. (A) Upper schematics show the 2 recording configurations used to study monosynaptic excitatory connections: PVIN to lamina IIi-III neurons and PVIN to lamina I-IIo neurons. Traces below show corresponding voltage-clamp recordings (−70 mV) of optically evoked excitatory postsynaptic currents (oEPSCs, 10 consecutive sweeps and average overlayed). Note, no oEPSC responses were observed in PVIN recordings. Group data (right) compare oEPSC amplitude, latency, and latency standard deviation (jitter). (B) Current-clamp recordings (from −60 mV) showing photostimulation-evoked oEPSCs rarely induce action potential discharge in postsynaptic neurons (only 4/89 recordings featured AP discharge in oEPSP responses). (C) Representative oEPSC recording (black) with subsequent addition of bicuculline and strychnine (red) and then CNQX (orange). Block of GABA and glycine receptors had minimal effects on oEPSCs, whereas the addition of CNQX abolished the response. Group data (right) summarise the effects of this drug application regimen in lamina IIi-III (left) and lamina I-IIo (right) neuron oEPSC responses. (D) Representative oEPSCs recorded recording (black) with subsequent addition of TTX (pink) and 4-AP (purple). Group data (right) summarise the effects of this drug application regimen on monosynaptic current (left) and polysynaptic current (right). Addition of 4-AP in the presence of TTX application recovers monosynaptic oEPSCs, as well as many presumably action potential–independent polysynaptic oEPSCs. PVIN, parvalbumin-expressing interneuron.
Figure 7.
Figure 7.
Parvalbumin-expressing interneuron (PVIN) activation evokes polysynaptic-evoked excitatory postsynaptic currents (EPSCs). (A) Traces show voltage-clamp recordings (−70 mV) of optically evoked excitatory postsynaptic currents (oEPSCs) in lamina I-IIo neurons, lamina IIi-III neurons, and PVINs (10 consecutive sweeps and average overlayed). Note these excitatory responses exhibited long latencies. Blue shading denotes underlying photocurrent in PVIN recording. Schematics (middle) summarise proposed polysynaptic PVIN circuits. Responses could arise from photostimulation of excitatory PVINs that recruit interposed excitatory INs (a, middle upper) or photostimulation may activate an inhibitory PVIN input onto a primary afferent fibre that terminates on the recorded neuron (b, middle lower). Group data (right) summarise oEPSC amplitude, latency, and latency standard deviation (jitter). These characteristics are consistent with polysynaptic oEPSCs. (B) Representative oEPSCs recorded from neurons in laminae IIi-III (black traces) and after addition of CNQX (upper left, orange trace), bicuculline (middle left, red trace), or strychnine (lower, green), bicuculline (lower, red), and then CNQX (lower, orange). Schematics (right) show the postulated circuit and site of drug action for these outcomes. GABA and AMPA receptor block abolished polysynaptic oEPSCs, whereas addition of strychnine had a minimal effect. (C) Representative oEPSCs recorded from neurons in laminae I-IIo (black traces) and after addition of bicuculline (red), strychnine (green), and CNQX (orange). Two series of traces highlight the variability in drug responsiveness of neurons in laminae I-IIo. Addition of bicuculline had a minimal effect in some recordings (upper traces), whereas bicuculline abolished polysynaptic oEPSCs in other recordings (lower traces). (D) Group data summarise the effects of drug application regimens in neurons from laminae IIi-III (left), I-IIo (middle), and PVINs (right). Note CNQX or bicuculline abolished all polysynaptic responses in PVINs and most neurons in lamina IIi-III but responses to bicuculline varied in recordings from lamina I-IIo.
Figure 8.
Figure 8.
Disinhibition unmasks ePVIN-mediated polysynaptic responses. (A) Schematic summarises experimental approach, recording from Lamina I-IIo neurons during brief PVIN photostimulation (1 ms duration) in the presence of bath-applied bicuculline and strychnine. This isolated ePVIN-mediated responses and unmasked connectivity supressed by iPVIN-mediated, or ongoing, inhibition. (B) Example traces (left) show ePVIN poststimulation responses recorded in 2 lamina I-IIo neurons (upper and lower, 5 consecutive overlayed sweeps) under disinhibited conditions (bicuculline/strychnine). Responses typically contained a short-latency oEPSC, followed by varying degrees of longer-latency oEPSC activity. Raster plots (right) summarise ePVIN photostimulation responses recorded from 11 lamina I-IIo neurons. (C) Plot compares latency and jitter of the first and second photostimulation-evoked inputs (oEPSC1 and oEPSC2) from each recording summarised in (B). A cluster of short-latency (∼5 ms) and low jitter (<0.5 ms) oEPSCs exhibited monosynaptic characteristics, and a population of longer-latency, high jitter oEPSCs exhibited polysynaptic characteristics. (D) Example ePVIN photostimulation responses (left) from a lamina I-IIo neuron recorded in current-clamp (upper) and voltage-clamp (lower) modes. Note the monosynaptic and polysynaptic oEPSC responses are clear on this expanded time scale (lower), and AP discharge produced by these inputs (upper) corresponds to the polysynaptic component. Plot compares the average latency for the onset of monosynaptic oEPSCs, polysynaptic oEPSCs, and APs after ePVIN photostimulation. AP latency corresponds to the timing of polysynaptic oEPSCs in most recordings. ePVIN, excitatory parvalbumin-expressing interneuron; iPVIN, inhibitory parvalbumin-expressing interneuron; oEPSC, optically evoked excitatory postsynaptic current; PVIN, parvalbumin-expressing interneuron.
Figure 9.
Figure 9.
Action potential discharge responses of neurons receiving PVIN-mediated glutamatergic inputs. (A) Example traces of the 4 characteristic action potential discharge types after depolarizing current injection (bottom right): tonic firing, initial bursting, delayed firing, and single spiking, as well as another, previously unidentified, population of rapidly adapting neurons. Rapidly adapting neurons all exhibited islet cell morphology (bottom), suggesting an inhibitory phenotype. (B) Top trace is an example voltage-clamp recording from a neuron receiving monosynaptic (black arrow) as well as polysynaptic (white arrow) oEPSC input. Group data graphs (below) show the incidence of monosynaptic (top right) and polysynaptic (bottom right) oEPSCs in neurons with each type of discharge response. These data highlight the higher incidence of polysynaptic oEPSCs in the rapidly adapting population. Similarly, the amplitude of monosynaptic (top left) and polysynaptic (bottom left) oEPSCs is compared for responses recorded in each AP discharge category. Only the amplitude of polysynaptic oEPSCs differed where rapidly adapting neurons received larger amplitude inputs. (C) Trace is an example current-clamp recording from a rapidly adapting neuron receiving monosynaptic (black arrow) as well as polysynaptic (white arrow) oEPSC input. Note the polysynaptic component of the oEPSC reaches AP threshold and evokes a spike. Group data (right) highlight the increased incidence of oEPSC-evoked AP discharge in the rapidly adapting population vs all other discharge categories. oEPSC, optically evoked excitatory postsynaptic current; PVIN, parvalbumin-expressing interneuron.
Figure 10.
Figure 10.
Parvalbumin-expressing interneuron (PVIN)-mediated input to lamina I projection neurons. (A) Low-magnification image (upper) shows a transverse spinal cord slice with recording pipette in place to record from a lamina I projection neuron (PN), with higher-magnification images showing the targeted recording configuration between the recording electrode and retrogradely labelled PN (brightfield left, mCherry fluorescence centre, and overlay right). (B) Photostimulation responses recorded in PNs showing characteristics of monosynaptic inhibitory (upper) and excitatory (lower) connections. Overlayed traces (gray) show 10 photostimulation (blue) trials on an expanded times scale with averaged responses (black) superimposed. Schematics (left) summarise the postulated underlying circuits between PVINs (green) and PNs (red). (C) Photostimulation responses recorded in PNs showing characteristics of polysynaptic connections. Overlayed traces (gray) show 10 photostimulation (blue) trials on an expanded times scale with averaged responses (black) superimposed. Schematics (left) summarise the postulated underlying circuits between PVINs (green) and PNs (red). Polysynaptic responses could be further differentiated into those that arose from excitatory circuits evoked by photostimulation of ePVINs (upper) and those that arose from photostimulation of iPVINs causing primary afferent depolarisation (PAD) and subsequent excitatory signalling from these terminals (lower). (D) Group data plots compare latency and jitter of photostimulation responses in monosynaptic excitatory, polysynaptic excitatory, and monosynaptic inhibitory connections. Scale bars in A (μm) = 100 upper; 40 lower. ePVIN, excitatory parvalbumin-expressing interneuron; iPVIN, inhibitory parvalbumin-expressing interneuron.
Figure 11.
Figure 11.
Parvalbumin-expressing interneurons modulate nociceptive circuits. (A) Plots show group data demonstrating the increase in mEPSC frequency after bath-applied capsaicin. Neurons were deemed to be capsaicin sensitive if capsaicin application increased mEPSC frequency by 3 standard deviations or more above the mean baseline rate. Miniature excitatory postsynaptic current amplitude and rise time remained unchanged, whereas decay time constant was reduced after capsaicin application. (B and C) Schematics (left) summarise the microcircuits producing photostimulation-evoked postsynaptic currents (oPSCs, 10 consecutive sweeps and average overlayed) in neurons from laminae I-IIo (middle). Continuous traces (right) show mEPSC recordings (TTX 1 μM, bicuculline 10 μM, and strychnine 1 μM) from corresponding neurons before (black) and after (red) bath application of capsaicin (2 μM). Capsaicin application increases mEPSC frequency without altering amplitude, confirming these neurons received nociceptive input. These recordings identified some neurons that received monosynaptic oIPSCs (B, short-latency outward currents during voltage clamp at −40 mV) presumably arising from photostimulation of iPVINs, neurons that received monosynaptic oEPSCs (C, short-latency inward currents during voltage clamp at −70 mV) arising from photostimulation of an ePVIN population, or neurons that received polysynaptic oEPSCs (D, longer-latency inward currents during voltage clamp at −70 mV) arising from photostimulation of iPVIN terminals that cause primary afferent depolarisation (PAD) and synaptic transmission at those terminals. ePVIN, excitatory parvalbumin-expressing interneuron; iPVIN, inhibitory parvalbumin-expressing interneuron; mEPSC, miniature excitatory postsynaptic current; oEPSC, optically evoked excitatory postsynaptic current; oIPSC, optically inhibitory postsynaptic current.
Figure 12.
Figure 12.
Spinal activation patterns after in vivo photostimulation of PVINs. (A) Image (left) shows maximum intensity projection of a spinal cord section taken from a PVCre; Ai32 mouse that underwent unilateral in vivo spinal photostimulation under anaesthesia. Immunolabelling for the activity marker pERK (red) and GFP to locate PVIN cells and processes (green) shows pERK expression in cells predominantly located in laminae I and IIo, with only scattered pERK-positive cells in deeper laminae. Note the absence of pERK expression in the PVIN plexus. Higher-magnification single optical section (right) from left image with lamina boundaries superimposed shows strong pERK-expressing profiles located in laminae I and IIo, implicating these cells in nociceptive processing. (B) Images show sections from an identical experiment to A, except tissue is immunolabelled for an alternative activity marker, Fos. Maximum intensity projection (left) shows Fos expression in cells predominantly located in laminae I and IIo, with only scattered Fos-positive cells in deeper laminae. Note the absence of Fos expression in the PVIN plexus. Higher-magnification single optical section (right) from left image shows strong Fos-expressing profiles located in lamina I, implicating these cells in nociceptive processing. (C) Schematic summarises identified iPVIN and ePVIN connections from channelrhodopsin-2–assisted circuit mapping experiments. Excitatory PVINs and iPVINs provide input to interneurons in LIIi-LIII including vertical cells, and iPVINs also provide presynaptic input to myelinated primary afferents (left). Inhibitory PVINs provide strong inhibition to neighbouring PVINs in LIIi-LIII (lower right). Excitatory PVINs and iPVINs provide input to interneurons and projection neurons located in LI-LIIo (upper right). (D) Schematic summarises activation of dorsal horn neurons after in vivo photostimulation of PVINs. Circuits inhibited by PVINs in LIIi-LIII and therefore unlikely to reach threshold for pERK/Fos expression are faded. By contrast, pERK/Fos expression is most pronounced in circuits in LI-LIIo, where ePVIN outputs are more likely to excite cells (including projection neurons). Scale bar (µm): A and B = 100; B = 20. ePVIN, excitatory parvalbumin-expressing interneuron; iPVIN, inhibitory parvalbumin-expressing interneuron; PVIN, parvalbumin-expressing interneuron.

References

    1. Abraira VE, Kuehn ED, Chirila AM, Springel MW, Toliver AA, Zimmerman AL, Orefice LL, Boyle KA, Bai L, Song BJ, Bashista KA, O'Neill TG, Zhuo J, Tsan C, Hoynoski J, Rutlin M, Kus L, Niederkofler V, Watanabe M, Dymecki SM, Nelson SB, Heintz N, Hughes DI, Ginty DD. The cellular and synaptic architecture of the mechanosensory dorsal horn. Cell 2017;168:295–310.e19. - PMC - PubMed
    1. Anderson WB, Graham BA, Beveridge NJ, Tooney PA, Brichta AM, Callister RJ. Different forms of glycine- and GABA(A)-receptor mediated inhibitory synaptic transmission in mouse superficial and deep dorsal horn neurons. Mol Pain 2009;5:65. - PMC - PubMed
    1. Anelli R, Heckman CJ. The calcium binding proteins calbindin, parvalbumin, and calretinin have specific patterns of expression in the gray matter of cat spinal cord. J Neurocytol 2005;34:369–85. - PubMed
    1. Antal M, Freund TF, Polgár E. Calcium-binding proteins, parvalbumin- and calbindin-D 28k-immunoreactive neurons in the rat spinal cord and dorsal root ganglia: a light and electron microscopic study. J Comp Neurol 1990;295:467–84. - PubMed
    1. Antal M, Polgár E, Chalmers J, Minson JB, Llewellyn-Smith I, Heizmann CW, Somogyi P. Different populations of parvalbumin- and calbindin-D28k-immunoreactive neurons contain GABA and accumulate 3H-D-aspartate in the dorsal horn of the rat spinal cord. J Comp Neurol 1991;314:114–24. - PubMed

Publication types