Clinical Trial
. 2021 Jul 29;6(1):289.
doi: 10.1038/s41392-021-00703-3.

Differential immune responses in pregnant patients recovered from COVID-19

Affiliations
Clinical Trial

Differential immune responses in pregnant patients recovered from COVID-19

Ge Chen et al. Signal Transduct Target Ther. .

Abstract

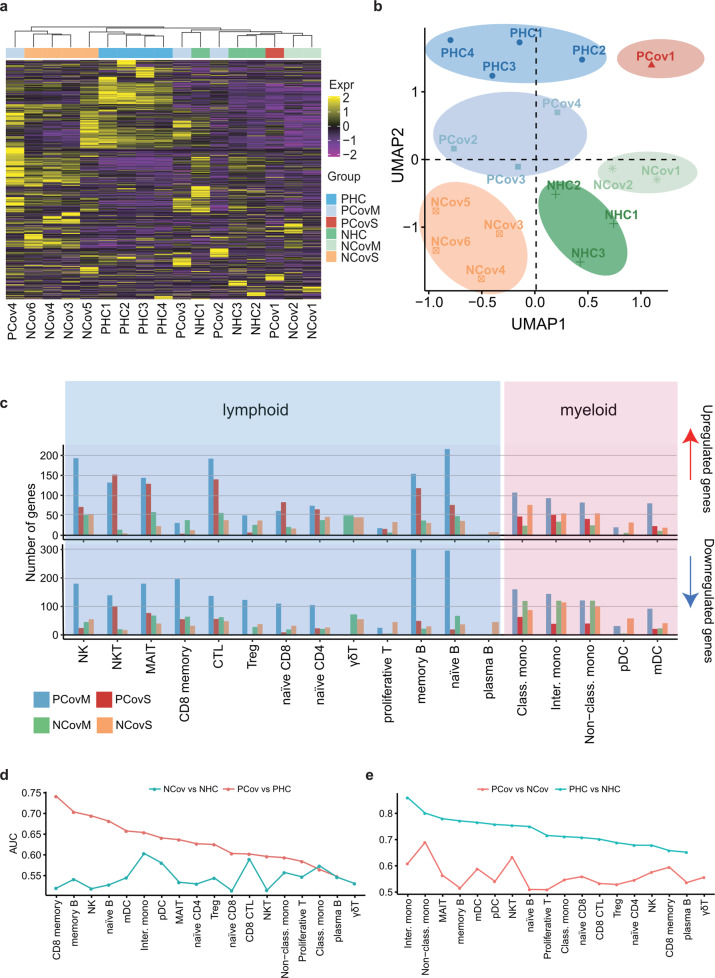
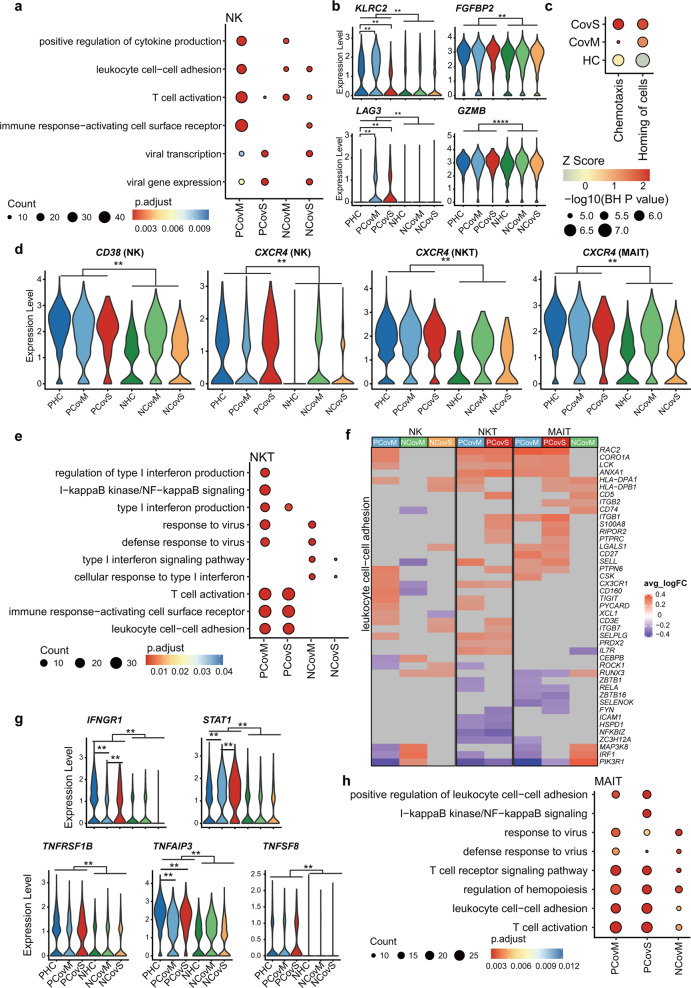
Pregnant women are generally more susceptible to viral infection. Although the impact of SARS-CoV-2 in pregnancy remains to be determined, evidence indicates that the risk factors for severe COVID-19 are similar in pregnancy to the general population. Here we systemically analyzed the clinical characteristics of pregnant and non-pregnant female COVID-19 patients who were hospitalized during the same period and found that pregnant patients developed marked lymphopenia and higher inflammation evident by higher C-reactive protein and IL-6. To elucidate the pathways that might contribute to immunopathology or protective immunity against COVID-19 during pregnancy, we applied single-cell mRNA sequencing to profile peripheral blood mononuclear cells from four pregnant and six non-pregnant female patients after recovery along with four pregnant and three non-pregnant healthy donors. We found normal clonal expansion of T cells in the pregnant patients, heightened activation and chemotaxis in NK, NKT, and MAIT cells, and differential interferon responses in the monocyte compartment. Our data present a unique feature in both innate and adaptive immune responses in pregnant patients recovered from COVID-19.


Conflict of interest statement

The authors declare no competing interests.

Figures

Fig. 1
Fig. 1
Single-cell atlas and cell composition of recovered COVID-19 patients and healthy controls. a Sample collection time for four pregnant patients and six non-pregnant patients recovered from SARA-CoV-2 infection and the overall study design. Onset indicates the onset of COVID-19-related symptoms; RT-qPCR+ indicates days when subject’s PCR tested positive for SARS-CoV-2 in nasopharyngeal or sputum samples, while RT-qPCR− indicates the days when subjects tested negative for infection. Sampling indicates the days when the blood samples were collected for single-cell sequencing. SARS-CoV-2 antibody indicates the days when the donors tested positive for SARS-CoV-2-specific IgM and IgG. b Integrated UMAP graph of 172,988 cells derived from our study, color-coded by cell types. c Dot plot showing expression level of canonical cell markers used to assign cell identities. The color scale indicates the expression levels and the size of dots is proportional to the fraction of cells. d UMAP projection of the pregnant or non-pregnant donors. PHC pregnant healthy controls (blue), PCov pregnant COVID-19 patients (red), NHC non-pregnant healthy controls (green), NCov non-pregnant COVID-19 patients (orange). e Percentages of myeloid cells and lymphoid in PHC (n = 4), PCov (n = 4), NHC (n = 3), and NCov (n = 6), color-coded by groups. f Fraction of eight cell types in the sequenced cells. Box plots show median, interquartile range (IQR), and the whiskers corresponding to the highest and lowest points within 1.5 times of IQR. Each dot represents an individual. *p < 0.05, **p < 0.01. Wilcoxon rank-sum test, adjusted for Bonferroni post hoc
Fig. 2
Fig. 2
Pregnancy-associated immunity impact on anti-SARS-CoV-2 responses. a Heatmap of differentially expressed genes identified from pseudo-bulk gene analysis. The color scale indicates Z score-transformed expression level. b The UMAP projection of 17 donors based on the pseudo-bulk gene expression matrix presented in a. Samples were colored and shaded according to their assigned groups. Blue, pregnant patients who developed mild symptoms (PCovM); red, pregnant patient who developed severe symptoms (PCovS); green, non-pregnant patients who developed mild symptoms (NCovM); orange, non-pregnant patients who developed severe symptoms or had prolonged viral shedding (NCovS). c Upregulated or downregulated differentially expressed genes (DEGs) in each cell type of recovered COVID-19 patients compared to their corresponding healthy controls (PCovM and PCovS compared to PHC; NCovM and NCovS compared to NHC). Prioritizing the most affected cell types in response to COVID-19 (d) or pregnancy (e) by ranking the AUC scores derived from Augur algorithm
Fig. 3
Fig. 3
Enhanced activation in the lymphoid cells of pregnant COVID-19 patients. a Percentages of B cell subtypes from the PHC, PCovM, PCovS, NHC, NCovM, and NCovS groups. Violin plots showing the expression of genes involved in BCR signaling in memory B cell (b) or TCR signaling in CD8 CTL (e). *p < 0.05, **p < 0.01, Wilcoxon rank-sum test, adjusted for Bonferroni post hoc test. Top GO terms and pathways enriched for DEGs in naive B, memory B (c), or CD8 CTL (f) cells. Color scale indicates adjusted p values, which was derived from a hypergeometric test. The size of symbols is in proportion to gene counts enriched in the corresponding GO terms. d Heatmaps of DEGs enriched in “B cell activation” pathway for memory B and naive B cell cells. The color scale indicates the average log (fold change over the healthy controls) of representative genes
Fig. 4
Fig. 4
T cell clonality in response to COVID-19. a The frequency of TCR repertoires in all donors. The severity level is also shown. The frequencies of the expanded clones (clone ≥2) were compared among all the groups, Wilcoxon rank-sum test. b The clonal diversities differ between PHC and NHC while similar between PCov and NCov. The diversities were evaluated using the ACE and Chao indices (Borcherding et al.). p Values of Wilcoxon rank-sum test are shown. PHC pregnant healthy controls (blue), PCov pregnant COVID-19 patients (red), NHC non-pregnant healthy controls (green), NCov non-pregnant COVID-19 patients (orange). c UMAP projection of TCR repertoires. d Percentages of TCR repertoires identified in the T cell subtypes
Fig. 5
Fig. 5
Pregnancy influences NK, NKT, and MAIT cells’ response in COVID-19. Top GO terms and pathways enriched for DEGs in NK (a), NKT (e), and MAIT (h) cells (PCovM and PCovS compared to PHC, NCovM and NCovS compared to NHC). Color scale indicates adjusted p values, which were derived from a hypergeometric test. The size of symbols is in proportion to gene counts enriched in the corresponding GO terms. b Violin plots showing the expression of representative markers for NK cells. c Representative pathways enriched for DEGs compared between pregnant and non-pregnant patients (PCovM vs NCovM and PCovS vs NCovS). Color scale indicates activation Z score provided by Ingenuity Pathway Analysis and the sizes of symbols were proportional to –log10 (p value adjusted by Benjamini and Hochberg correction). d Violin plots showing the expression of CD38 in NK cells and CXCR4 in NK, NKT, and MAIT by violin plot. f Heatmaps of DEGs enriched in “leukocyte cell–cell adhesion” pathway for NK, NKT, and MAIT cells. The color scale indicates the average log (fold change over healthy controls) of representative genes. g Violin plots showing representative gene expression in MAIT cells. **p < 0.01, ****p < 0.0001, Wilcoxon rank-sum test, adjusted for Bonferroni post hoc test
Fig. 6
Fig. 6
Pregnant COVID-19 patients have elevated monocytic response. a Top GO terms and pathways enriched for DEGs in classical, intermediate, and non-classical monocyte from recovered COVID-19 patients compared to respective healthy controls. The color scale indicates adjusted p values derived from a hypergeometric test. The size of symbols is in proportion to gene counts enriched in the corresponding GO terms. Heatmaps of DEGs enriched in “response to interferon-gamma” (b) and “response to type I interferon” (c). d Box plots showing the levels of IFN-α, IFN-β, and IFN-γ in the plasma of patients and healthy donors. Box plots show median, interquartile range (IQR), and the whiskers corresponding to the highest and lowest points within 1.5 times of IQR. Each dot represents an individual. *p < 0.05, **p < 0.01, ****p < 0.0001, one-way ANOVA test, adjusted for Bonferroni post hoc test. e Expression level of FCGR3A in non-classical monocytes. *p < 0.05, ****p < 0.0001, Wilcoxon rank-sum test, adjusted for Bonferroni post hoc test. f Phagocytosis-related pathways enriched for DEGs from non-classical monocytes. The color scale indicates activation Z score (compared to related healthy controls) provided by Ingenuity Pathway Analysis and the sizes of symbols were proportional to –log10 (p value adjusted by Benjamini and Hochberg correction)
Fig. 7
Fig. 7
Validation of inflammatory features combined with IFN response of pregnant women by in vitro experiment. ac Comparison of the MFI (mean fluorescence intensity) HLA-DR in intermediate, classical, and non-classical monocyte in stimulated compared to unstimulated blood samples by box plot and histogram. Freshly isolated blood samples withdrawn from pregnant (n = 6) and non-pregnant healthy controls (n = 6) were incubated with 1000 U/mL IFN-β, 1000 U/mL IFN-γ, or 25 ng/mL SARS-CoV-2 spike protein for 24 h. unsti unstimulated samples, sti stimulated samples. Barchart show median and interquartile range (IQR). Each dot represents an individual. Wilcoxon rank-sum test, adjusted for Bonferroni post hoc. *p < 0.05, **p < 0.01, ***p < 0.001

Similar articles

Cited by

References

    1. WHO. Coronavirus disease (COVID-19) pandemic. https://www.who.int/emergencies/diseases/novel-coronavirus-2019 (2021).
    1. Huang C, et al. Clinical features of patients infected with 2019 novel coronavirus in Wuhan, China. Lancet. 2020;395:497–506. doi: 10.1016/S0140-6736(20)30183-5. - DOI - PMC - PubMed
    1. Xu Z, et al. Pathological findings of COVID-19 associated with acute respiratory distress syndrome. Lancet Respir. Med. 2020;8:420–422. doi: 10.1016/S2213-2600(20)30076-X. - DOI - PMC - PubMed
    1. Mathew, D. et al. Deep immune profiling of COVID-19 patients reveals distinct immunotypes with therapeutic implications. Science10.1126/science.abc8511 (2020). - PMC - PubMed
    1. Kuri-Cervantes, L. et al. Comprehensive mapping of immune perturbations associated with severe COVID-19. Sci. Immunol.10.1126/sciimmunol.abd7114 (2020). - PMC - PubMed

Publication types