. 2021 Jul 29;12(1):4467.
doi: 10.1038/s41467-021-24487-w.

The mortality cost of carbon

Affiliations

The mortality cost of carbon

R Daniel Bressler. Nat Commun. .

Abstract

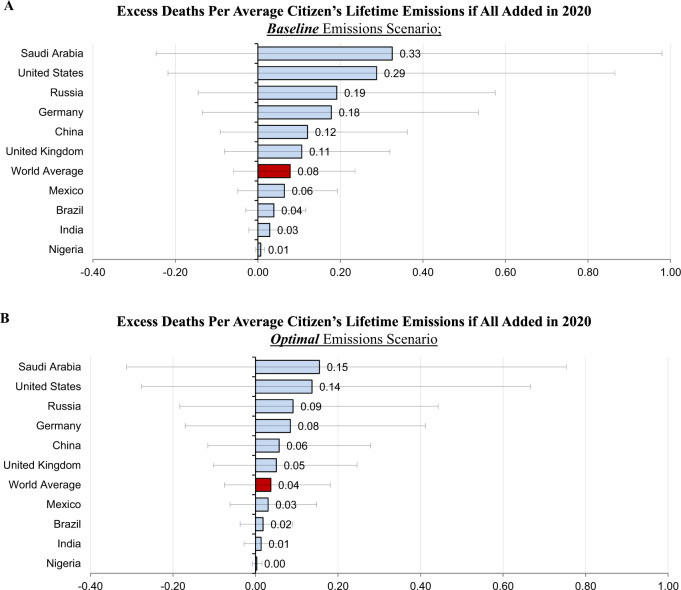
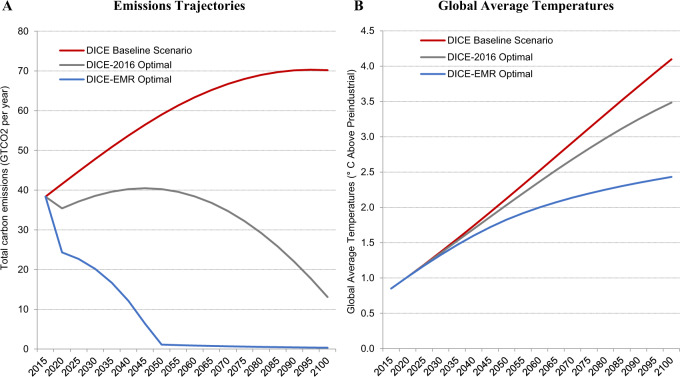
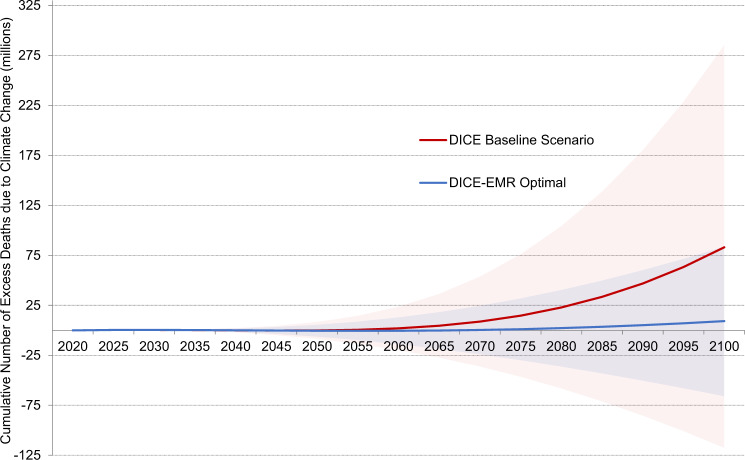
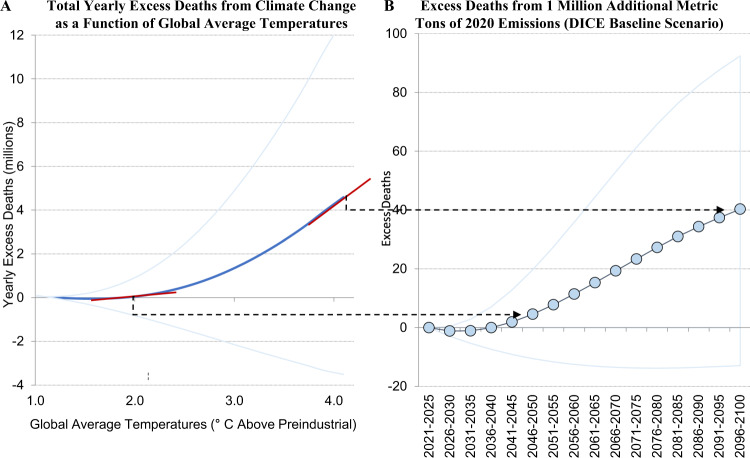
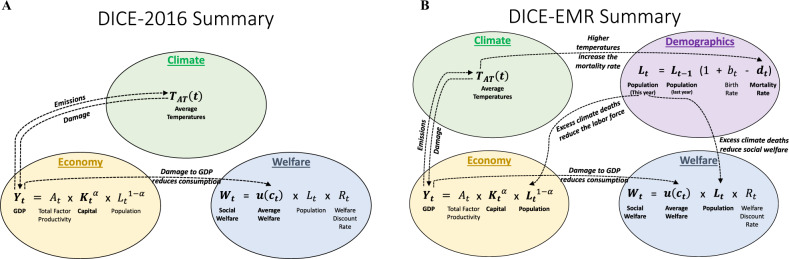
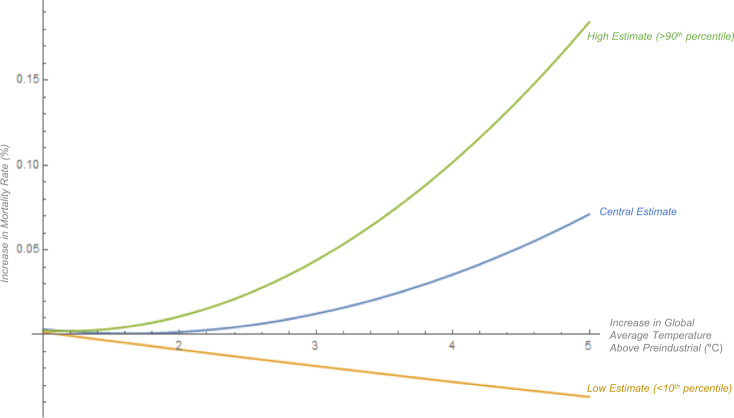
Many studies project that climate change can cause a significant number of excess deaths. Yet, in integrated assessment models (IAMs) that determine the social cost of carbon (SCC) and prescribe optimal climate policy, human mortality impacts are limited and not updated to the latest scientific understanding. This study extends the DICE-2016 IAM to explicitly include temperature-related mortality impacts by estimating a climate-mortality damage function. We introduce a metric, the mortality cost of carbon (MCC), that estimates the number of deaths caused by the emissions of one additional metric ton of CO2. In the baseline emissions scenario, the 2020 MCC is 2.26 × 10‒4 [low to high estimate -1.71× 10‒4 to 6.78 × 10‒4] excess deaths per metric ton of 2020 emissions. This implies that adding 4,434 metric tons of carbon dioxide in 2020-equivalent to the lifetime emissions of 3.5 average Americans-causes one excess death globally in expectation between 2020-2100. Incorporating mortality costs increases the 2020 SCC from $37 to $258 [-$69 to $545] per metric ton in the baseline emissions scenario. Optimal climate policy changes from gradual emissions reductions starting in 2050 to full decarbonization by 2050 when mortality is considered.


Conflict of interest statement

The author declares no competing interests.

Figures

Fig. 1
Fig. 1. Implications of the 2020 mortality cost of carbon.
Average lifetime emissions are calculated as 2017 carbon dioxide emissions production per capita multiplied by 2017 life expectancy at birth. The error bars show the low (<10th percentile) and high (>90th percentile) mortality estimates (see “Methods” section for more details on uncertainty). A The 2020 MCC in the baseline emissions scenario is 2.26 × 10−4 excess deaths per metric ton of 2020 emissions in the central estimate. This implies that the lifetime emissions of an average American (1,276 metric tons) causes 0.29 excess deaths in expectation if all added in 2020, the lifetime emissions of an average Indian (127 metric tons) causes 0.03 excess deaths in expectation if all added in 2020, and the lifetime emissions of an average person in the world (347 metric tons) causes 0.08 excess deaths if all added in 2020. B The 2020 MCC in the optimal emissions scenario is 1.07 × 10−4 excess deaths per metric ton of 2020 emissions in the central estimate. This implies that the lifetime emissions of an average American (1,276 metric tons) causes 0.15 excess deaths in expectation if all added in 2020, the lifetime emissions of an average Indian (127 metric tons) causes 0.01 excess deaths in expectation if all added in 2020, and the lifetime emissions of an average person in the world (347 metric tons) causes 0.04 excess deaths if all added in 2020.
Fig. 2
Fig. 2. Optimal Climate Policy.
Integrated assessment models (IAMs) assess the cost of reducing emissions and the damages from climate change in a dynamic general equilibrium model that includes coupled interactions between the economy and the climate. They can be used normatively to determine optimal climate policy. They do this by using optimal control to determine a path of emissions trajectories that optimizes the net present value of social welfare. A Optimal climate policy in DICE-2016 involves gradual emissions reductions starting in 2050 while optimal climate policy in DICE-EMR involves immediate emissions reductions and full decarbonization by 2050. B Optimal climate policy in DICE-2016 results in 3.5 °C warming by 2100 while optimal climate policy in DICE-EMR results in 2.4 °C warming by 2100.
Fig. 3
Fig. 3. Cumulative number of excess deaths from climate change in DICE-EMR.
The DICE baseline emissions scenario results in 83 million cumulative excess deaths by 2100 in the central estimate. Seventy-four million of these deaths can be averted by pursuing the DICE-EMR optimal emissions path, which results in 2.4 °C of warming and nine million deaths by the end of the century. The red shaded region shows the range between the high (>90th percentile) and low (<10th percentile) projections for excess deaths in the DICE baseline emissions scenario. The blue shaded region shows the range between high and low projections for excess deaths in the DICE-EMR optimal emissions path.
Fig. 4
Fig. 4. The mortality cost of carbon is driven by the convexity of the mortality response.
In both graphs, the high and low lines represent uncertainty with high (>90th percentile) and low (<10th percentile) estimates. A Below 2 °C, projected yearly excess deaths from climate change are relatively constant at around 100,000 per year in the central estimate. Above 2 °C, projected yearly excess deaths from climate change increase at an increasing rate in global average temperatures, rising to over four million excess deaths at 4 °C. This implies that the number of excess deaths from a marginal increase in temperatures (the first derivative—represented by the red tangent lines on the graph at 2 and 4 °C) is initially relatively modest but increases substantially with increasing temperatures. B Because a significant portion of carbon dioxide emissions remain in the atmosphere for centuries after they are emitted, adding one million metric tons of carbon-dioxide-equivalent emissions in 2020 marginally increases global average temperatures through 2100. The magnitude of excess deaths from marginal 2020 emissions shown in panel B is driven by the steepness of the mortality response curve shown in panel A, which becomes progressively steeper with increasing temperatures. In the 5 years between 2046 and 2050 (when global average temperatures are 2.0 °C above preindustrial in the baseline emissions scenario), the mortality response curve is comparatively shallow, and one million marginal metric tons of carbon-dioxide-equivalent emissions in 2020 are projected to cause five excess deaths in this timespan. In the 5 years between 2096 and 2100 (when global average temperatures are 4.0 °C above preindustrial in the baseline emissions scenario), the mortality response curve is comparatively steep, and these marginal 2020 emissions are projected to cause 40 excess deaths in this timespan. In total, one million additional metric tons of carbon-dioxide-equivalent emissions in 2020 are projected to cause 226 excess deaths in the 80 years between 2020 and 2100 in the baseline emissions scenario. These are concentrated at the end of the century when global average temperatures are highest and marginal changes to temperatures are most damaging.
Fig. 5
Fig. 5. A summary of the DICE-2016 and DICE-EMR integrated assessment models (IAMs).
Endogenous components (determined by the model) are in bold. Exogenous components (inputs to the model) are not bold. A is a summary of the DICE-2016 model. In this model, the economy affects the climate through emissions and climate only affects society through the damage function that reduces GDP. Our review of—the review study that constructs the DICE-2016 damage function—concludes that mortality costs account for <5% of the damages in the damage function. B is a summary of the DICE-EMR model. DICE-EMR takes the rest of DICE-2016 as given and adds a fourth system: demographics. The climate affects the mortality rate through the mortality damage function, which is estimated by a systematic research synthesis of the scholarly literature. This directly reduces welfare due to the welfare cost of these excess deaths, and this effect is calibrated to estimates for value of a statistical life year.
Fig. 6
Fig. 6
Mortality damage function derived from systematic research synthesis estimates the mortality damage function: δ(Tt)=β1Tt+β2Tt2 where Tt is the increase in global average atmospheric temperatures above preindustrial, βi{β1,β2} are the estimated coefficients, and δ(Tt) is the % increase in the mortality rate (where for instance 0.05 represents a 5% increase in the mortality rate). See Supplementary Materials for detailed explanation of methods.

References

    1. Nordhaus WD. Revisiting the social cost of carbon. Proc. Natl Acad. Sci. USA. 2017;114:1518–1523. doi: 10.1073/pnas.1609244114. - DOI - PMC - PubMed
    1. Auffhammer M. Quantifying economic damages from climate change. J. Econ. Perspect. 2018;32:33–52. doi: 10.1257/jep.32.4.33. - DOI
    1. Nordhaus, W. D. The Climate Casino: Risk, Uncertainty, and Economics for a Warming World (Yale University Press, 2013).
    1. Weyant, J. et al. Integrated Assessment of Climate Change: An Overview and Comparison of Approaches and Results (Cambridge University Press, 1996).
    1. Committee on Assessing Approaches to Updating the Social Cost of Carbon, Board on Environmental Change and Society, Division of Behavioral and Social Sciences and Education, & National Academies of Sciences, Engineering, and Medicine. Valuing Climate Changes: Updating Estimation of the Social Cost of Carbon Dioxide. (National Academies Press, 2017).

Publication types