. 2021 Jul 29;12(1):4611.
doi: 10.1038/s41467-021-24819-w.

SLITRK5 is a negative regulator of hedgehog signaling in osteoblasts

Affiliations

SLITRK5 is a negative regulator of hedgehog signaling in osteoblasts

Jun Sun et al. Nat Commun. .

Abstract

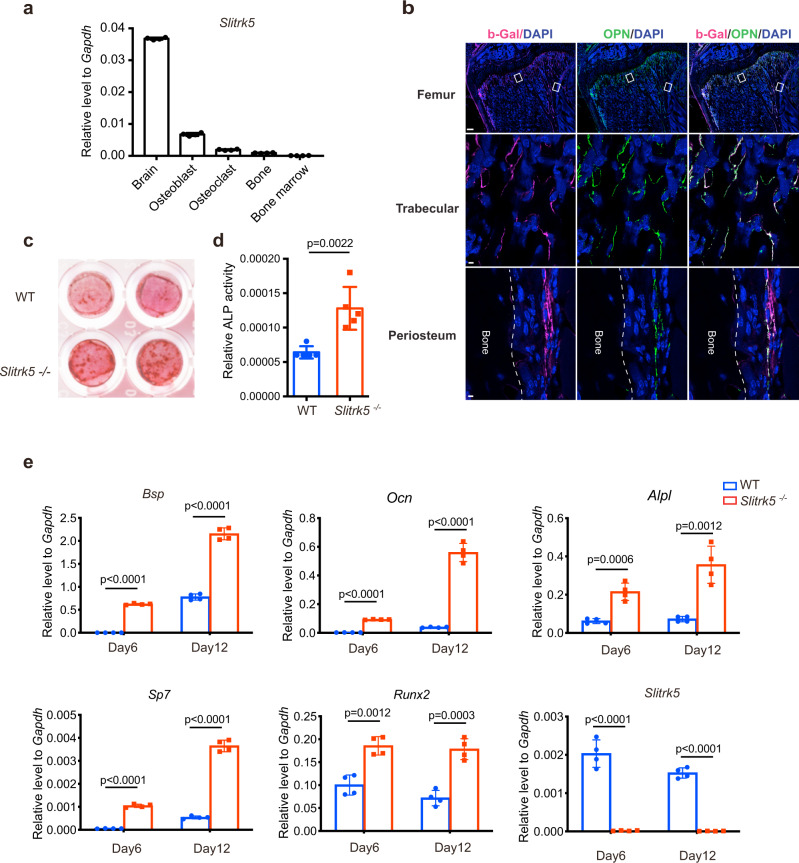
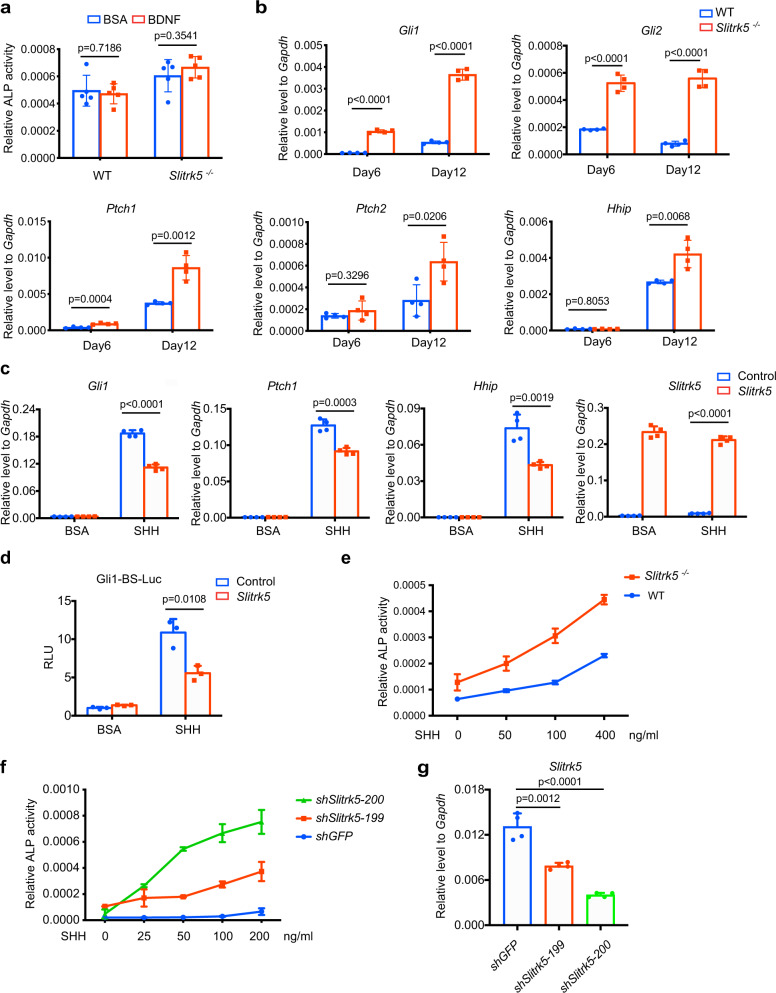
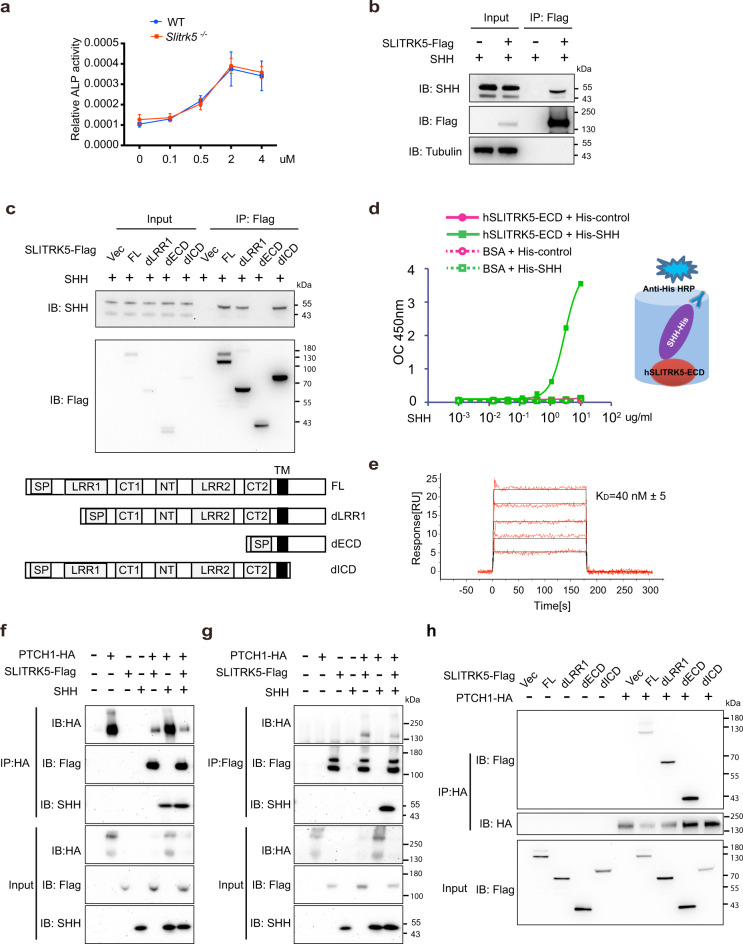
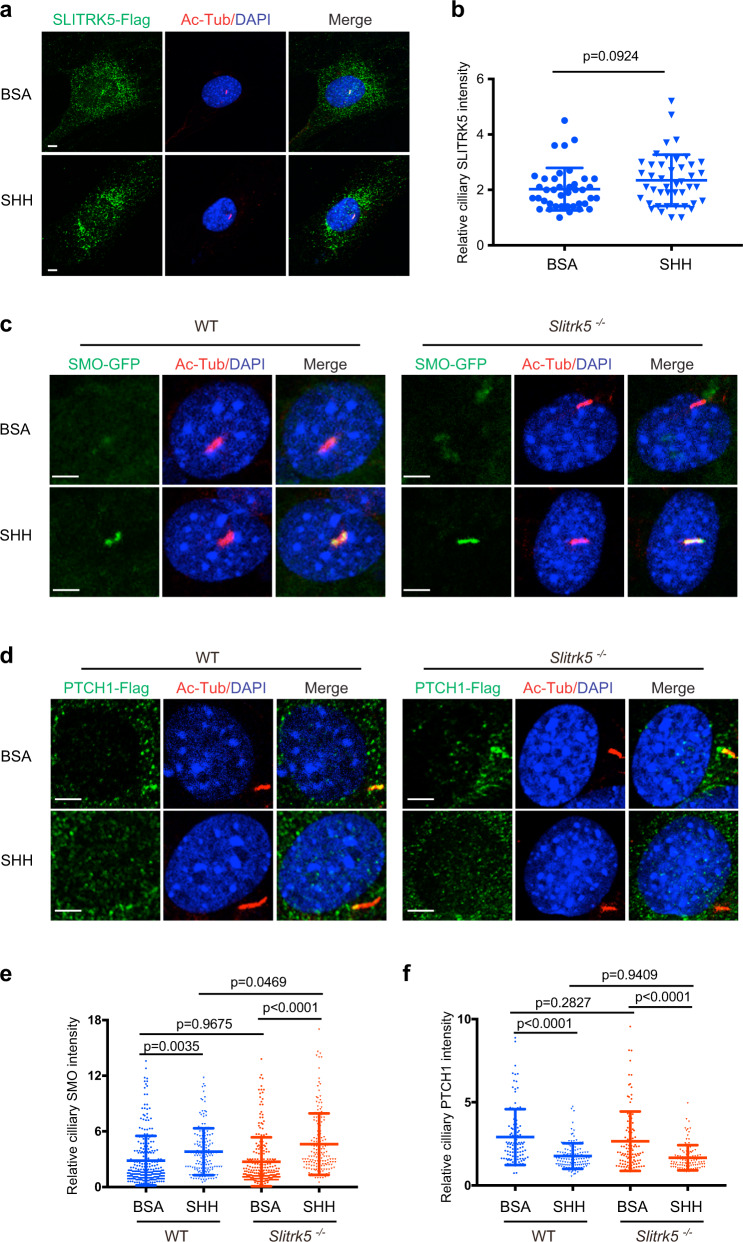
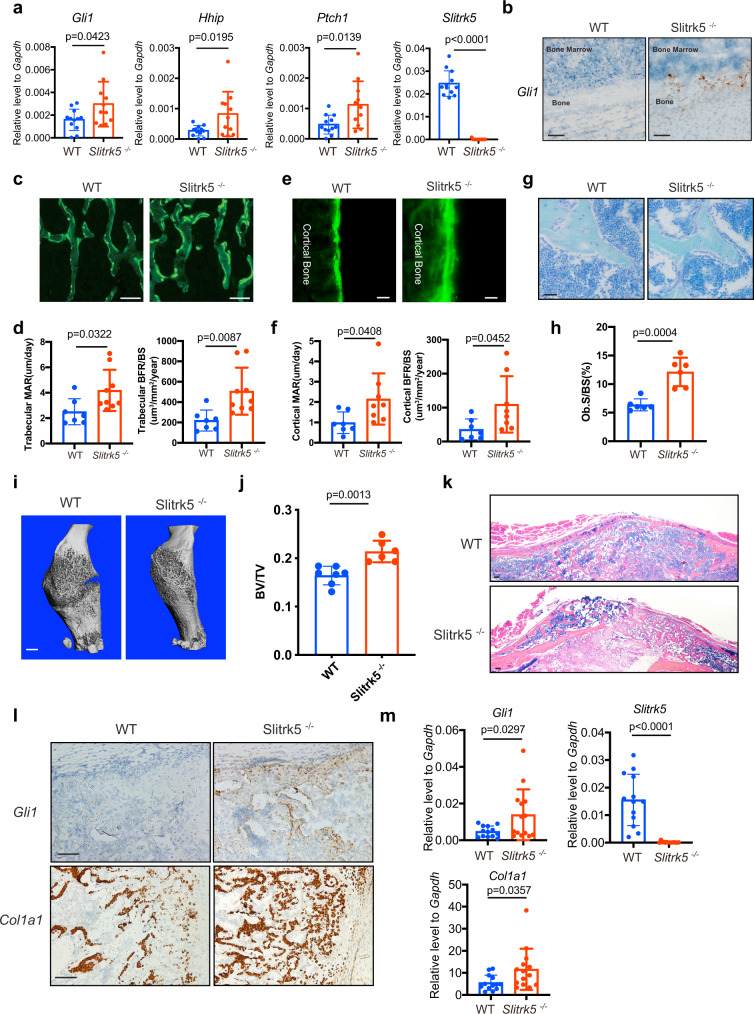
Hedgehog signaling is essential for bone formation, including functioning as a means for the growth plate to drive skeletal mineralization. However, the mechanisms regulating hedgehog signaling specifically in bone-forming osteoblasts are largely unknown. Here, we identified SLIT and NTRK-like protein-5(Slitrk5), a transmembrane protein with few identified functions, as a negative regulator of hedgehog signaling in osteoblasts. Slitrk5 is selectively expressed in osteoblasts and loss of Slitrk5 enhanced osteoblast differentiation in vitro and in vivo. Loss of SLITRK5 in vitro leads to increased hedgehog signaling and overexpression of SLITRK5 in osteoblasts inhibits the induction of targets downstream of hedgehog signaling. Mechanistically, SLITRK5 binds to hedgehog ligands via its extracellular domain and interacts with PTCH1 via its intracellular domain. SLITRK5 is present in the primary cilium, and loss of SLITRK5 enhances SMO ciliary enrichment upon SHH stimulation. Thus, SLITRK5 is a negative regulator of hedgehog signaling in osteoblasts that may be attractive as a therapeutic target to enhance bone formation.


Conflict of interest statement

J.H.S. is a scientific co-founder of AAVAA therapeutics and holds equity in this company. The remaining authors declare no competing interests.

Figures

Fig. 1
Fig. 1. Slitrk5 is expressed in osteoblasts and negatively regulates osteoblastogenesis.
a Expression of Slitrk5 mRNA in indicated cells or tissues. Data are presented as mean ± s.d. n = 4 biologically independent samples. b Immunofluorescence staining of mouse femur sections with anti-beta-galactosidase and OPN antibodies, demonstrating the expression of Slitrk5 in osteoblasts. Data are representative of two independent experiments, scale bar = 200/10/10 µm. c, d Primary osteoblasts from WT and Slitrk5−/− mice were cultured in osteoblast differentiation medium. Mineralization activity was assessed by alizarin red staining (c) at day 14 of differentiation. Alkaline phosphatase (ALP) activity was measured at day 8 of differentiation (d). Data in (d) are presented as mean ± s.d. n = 5 biologically independent samples, two-tailed unpaired t test. e RT-PCR analysis of Slitrk5 and osteoblast marker genes expression at day 6 and day 12 of differentiation in WT and Slitrk5−/− osteoblasts during differentiation. n = 4 biologically independent samples, two-tailed unpaired t test. Data are presented as mean ± s.d.
Fig. 2
Fig. 2. Slitrk5 is a negative regulator of hedgehog signaling in osteoblasts.
a Primary osteoblasts from WT and Slitrk5−/− mice were treated with BSA control or 40 ng/ml BDNF and cultured in osteoblast differentiation medium. ALP activity was measured at day 6 of osteoblast differentiation. Data are presented as mean ± s.d. n = 5 biologically independent samples, two-tailed unpaired t test. b RT-PCR analysis of hedgehog signaling related gene expression at day 6 and day 12 of differentiation in WT and Slitrk5−/− osteoblasts. n = 4 biologically independent samples, two-tailed unpaired t test. c C3H10T1/2 cells transfected with either control or Slitrk5 overexpression vectors were treated with BSA or 100 ng/ml SHH in serum-free medium for 48 h. Gli1, Ptch1, Hhip, and Slitrk5 mRNA levels were measured by RT-PCR. n = 4 biologically independent samples, two-tailed unpaired t test. d C3H10T1/2 cells transfected with GLI1-luc/Renilla together with either control vector or Slitrk5 overexpression vector were treated with BSA or 100 ng/ml SHH in serum-free medium for 36 h. Luciferase activity was measured to assess Hh signaling. n = 3 biologically independent samples, two-tailed unpaired t test. e Primary osteoblasts from WT and Slitrk5−/− mice were treated with different doses of SHH and cultured in osteoblast differentiation medium. ALP activity was measured at day 8 of differentiation. Data are presented as mean ± s.d. n = 5 biologically independent samples. f Primary osteoblasts transduced with Slitrk5 or Gfp shRNAs were treated with the indicated doses of SHH and cultured in osteoblast differentiation medium. ALP activity was measured at day 8 of osteoblast differentiation. Data are presented as mean ± s.d. n = 2 biologically independent samples. g Knockdown efficiency of Slitrk5 was validated by qRT-PCR. n = 4 biologically independent samples, two-tailed unpaired t test.
Fig. 3
Fig. 3. SLITRK5 interacts with SHH and PTCH1.
a Primary osteoblasts from WT and Slitrk5−/− mice were treated with the indicated doses of Purmorphamine and cultured in osteoblast differentiation medium. ALP activity was measured at day 3 of differentiation. Data are presented as mean ± s.d. n = 6 biologically independent samples. b Co-immunoprecipitation of Flag-SLITRK5 and SHH in HEK293T cells. Data are representative of four independent experiments. c Co-immunoprecipitation of SHH and Flag-tagged SLITRK5 truncation mutants in HEK293T cells. Data are representative of three independent experiments. d ELISA assay showing the interaction of hSLITRK5-ECD and SHH. e Surface Plasmon Resonance analysis of the binding of SHH to SLITRK5. SHH was injected over a SLITRK5 surface at 125, 62.5, 31.25, 15.625, and 7.8125 nM. f, g Co-immunoprecipitation of Flag-SLITRK5 and HA-PTCH1 in HEK293T cells with BSA or SHH treatment. Data are representative of two independent experiments. h Co-immunoprecipitation of PTCH1 and Flag-tagged SLITRK5 truncation mutants in HEK293T cells. Data are representative of three independent experiments.
Fig. 4
Fig. 4. SLITRK5 regulates SMO ciliary enrichment upon SHH stimulation.
a Immunostaining for SLITRK5 (anti-Flag antibody, Green) and acetylated tubulin (Red) in osteoblasts treated with BSA or SHH for 4 h. Data are representative of three independent experiments, scale bar = 5 µm. b Quantification of the relative fluorescence intensity of ciliary SLITRK5-flag. n = 40–50 cells per group. Data are presented as mean ± s.d, two-tailed unpaired t test. c, d Ciliary localization of SMO-GFP (c) and PTCH1- Flag (d) in WT and Slitrk5−/− osteoblasts treated with BSA or SHH for 4 h. Data are representative of three independent experiments, Scale bar = 5 µm. e, f Quantification of the relative fluorescence intensity of ciliary SMO-GFP (e) and PTCH1-Flag (f) in WT and Slitrk5−/− osteoblasts treated with BSA or SHH for 4 h. n = 100–300 cells per group. Data are presented as mean ± s.d, One-way ANOVA (P < 0.0001) followed by a Tukey’s post hoc test.
Fig. 5
Fig. 5. Slitrk5 deficient mice display increased bone formation.
a RT-PCR analysis of hedgehog signaling related gene expression in the tibias of 8-week-old WT and Slitrk5−/. n = 11 or 12 per group. Two-tailed unpaired t test. b RNA in situ hybridization analysis using Gli1 probe in the tibias of WT and Slitrk5−/ mice at 4 day old. Data are representative of two independent experiments, scale bar = 200 µm. c–f Calcein double labeling (c, e) and quantification of histomorphometric parameters (d, f) of the L3 vertebrae trabecular bone (c, d) and cortical bone (e, f) in 7-week-old WT and Slitrk5−/− female mice. Mineral apposition rate (MAR, µm/day), bone formation rate/bone surface (BFR/BS) (mm3/mm2/year). N = 7–9 per group. Data are presented as mean ± s.d, two-tailed unpaired t test, data in (c, e) are representative of 7 (WT) or 9 (Slitrk5−/−) independent samples. Scale bar = 250 µm (c) and 25 µm (e). g, h Toluidine blue staining (g) and quantification of Ob.S/BS (h) of the L3 vertebrae in WT and Slitrk5−/− female mice at 7 week old. Osteoblast surface/bone surface (Ob.S/BS), n = 6 per group. Data are presented as mean ± s.d, two-tailed unpaired t test, data in (g) are representative of six independent samples, scale bar = 100 µm. i Representative μCT 3D images of mouse femurs at 21 days after open femoral midshaft fracture, scale bar = 1 mm. j μCT measurement of BV/TV in callus area in WT and Slitrk5−/− mice at 21 days post-surgery. N = 6 or 7 per group. Data are presented as mean ± s.d, two-tailed unpaired t test. k Representative H&E staining images of fracture callus from in WT and Slitrk5−/ mice at 21 days after an open femoral midshaft fracture. Data are representative of three independent experiments, scale bar = 100 µm. l RNA in situ hybridization analysis using Gli1 and Col1a1 probes in the callus area of WT and Slitrk5−/ mice at 12 days post-surgery. Data are representative of two independent experiments, scale bar = 100 µm. m RT-PCR analysis of Gli1, Col1a1, and Slitrk5 expression in the fracture callus from WT and Slitrk5−/ mice at 12 days after open femoral midshaft fracture, n = 13 or 14 per group. Two-tailed unpaired t test.

References

    1. Ganesan K., Jandu J. S., Roane D. Osteoporosis (Secondary). In StatPearls (2020). - PubMed
    1. Pak E, Segal RA. Hedgehog signal transduction: key players, oncogenic drivers, and cancer therapy. Dev. Cell. 2016;38:333–344. doi: 10.1016/j.devcel.2016.07.026. - DOI - PMC - PubMed
    1. Briscoe J, Therond PP. The mechanisms of Hedgehog signalling and its roles in development and disease. Nat. Rev. Mol. Cell Biol. 2013;14:416–429. doi: 10.1038/nrm3598. - DOI - PubMed
    1. St-Jacques B, Hammerschmidt M, McMahon AP. Indian hedgehog signaling regulates proliferation and differentiation of chondrocytes and is essential for bone formation. Genes Dev. 1999;13:2072–2086. doi: 10.1101/gad.13.16.2072. - DOI - PMC - PubMed
    1. Ohba S, et al. Patched1 haploinsufficiency increases adult bone mass and modulates Gli3 repressor activity. Dev. Cell. 2008;14:689–699. doi: 10.1016/j.devcel.2008.03.007. - DOI - PubMed

Publication types