. 2021 Jul 29;12(1):4677.
doi: 10.1038/s41467-021-24940-w.

Endogenous control of inflammation characterizes pregnant women with asymptomatic or paucisymptomatic SARS-CoV-2 infection

Affiliations

Endogenous control of inflammation characterizes pregnant women with asymptomatic or paucisymptomatic SARS-CoV-2 infection

Sara De Biasi et al. Nat Commun. .

Erratum in

Abstract

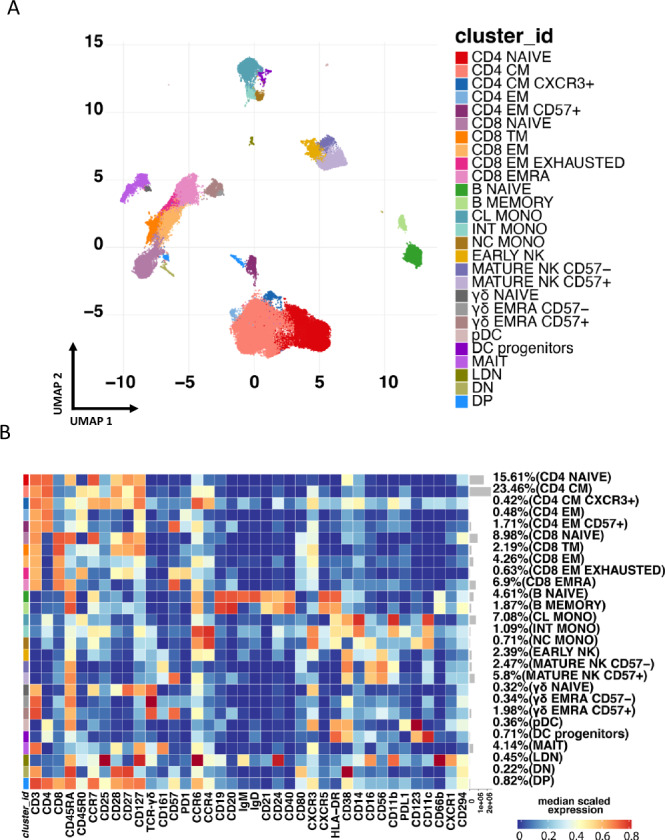
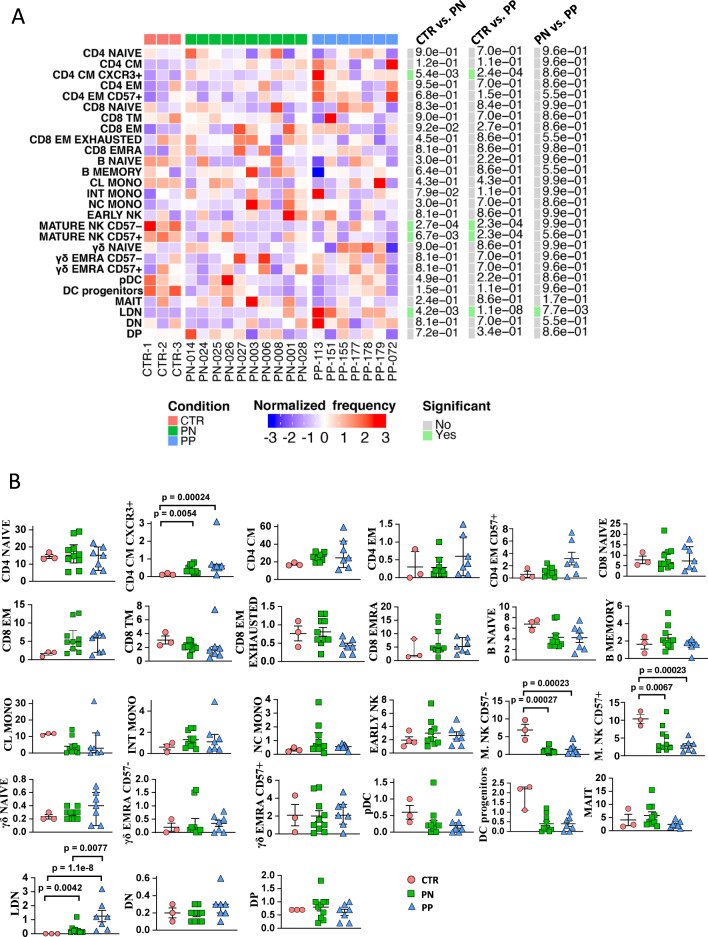
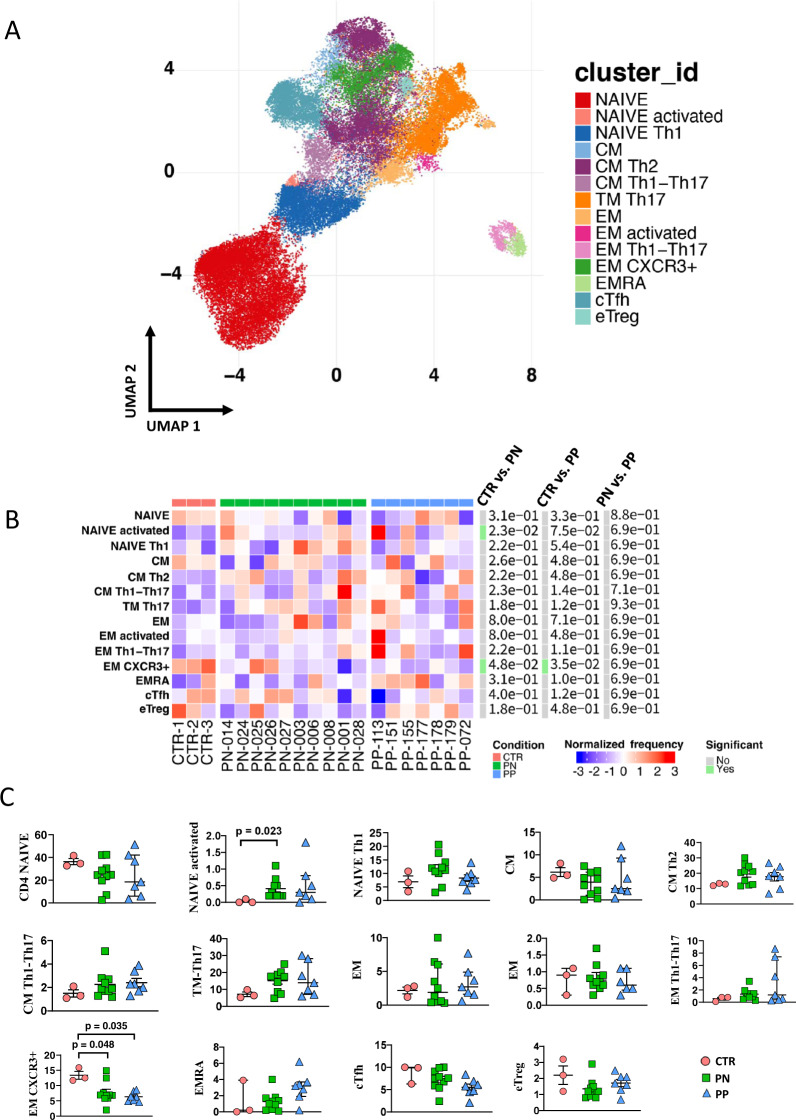
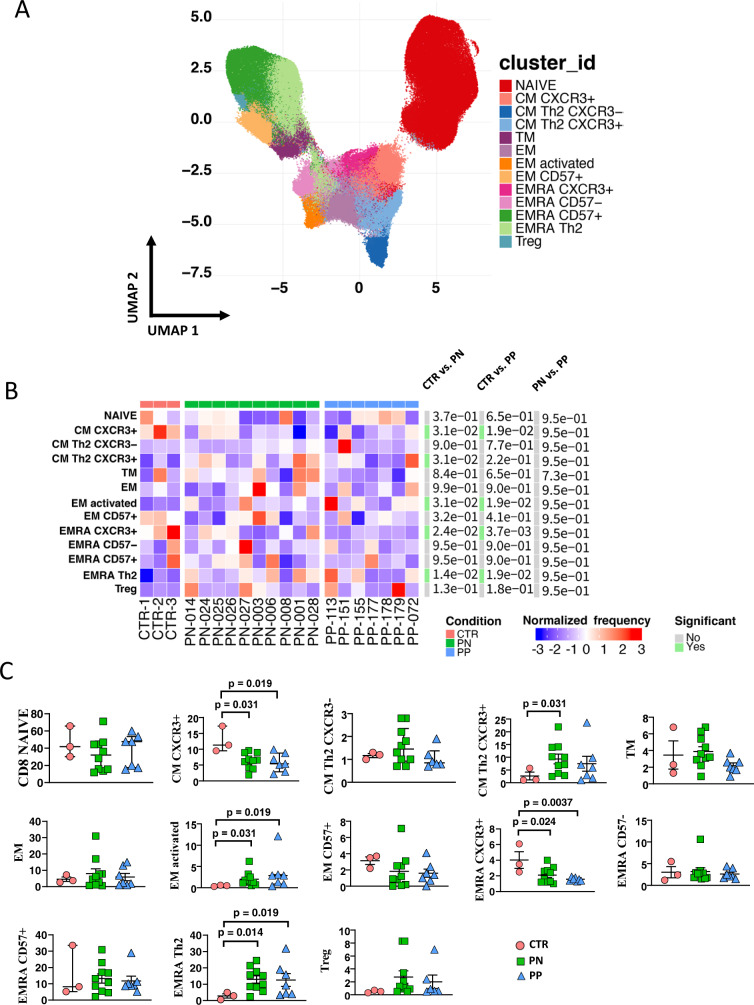
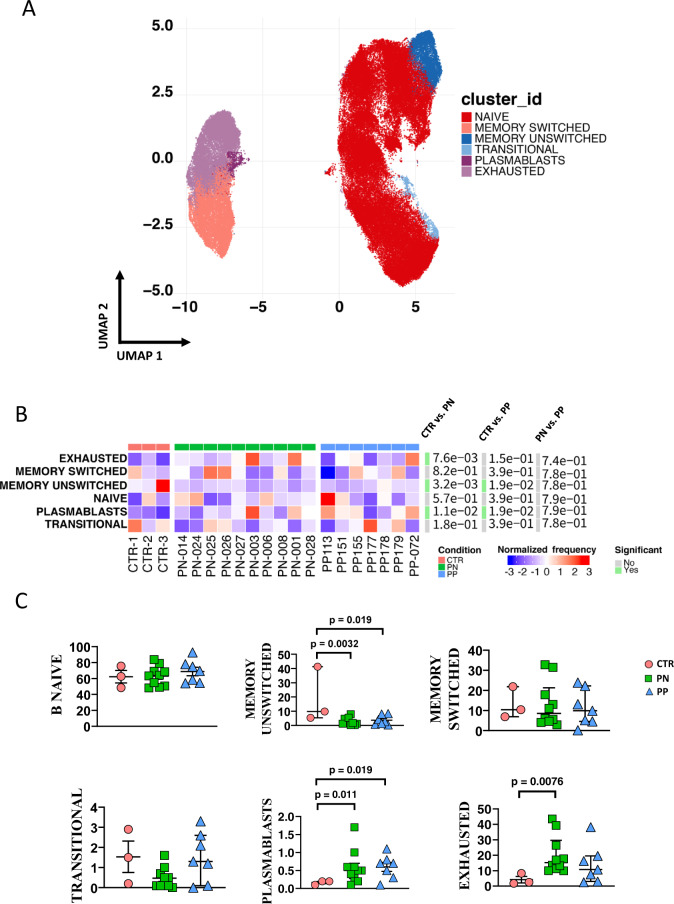
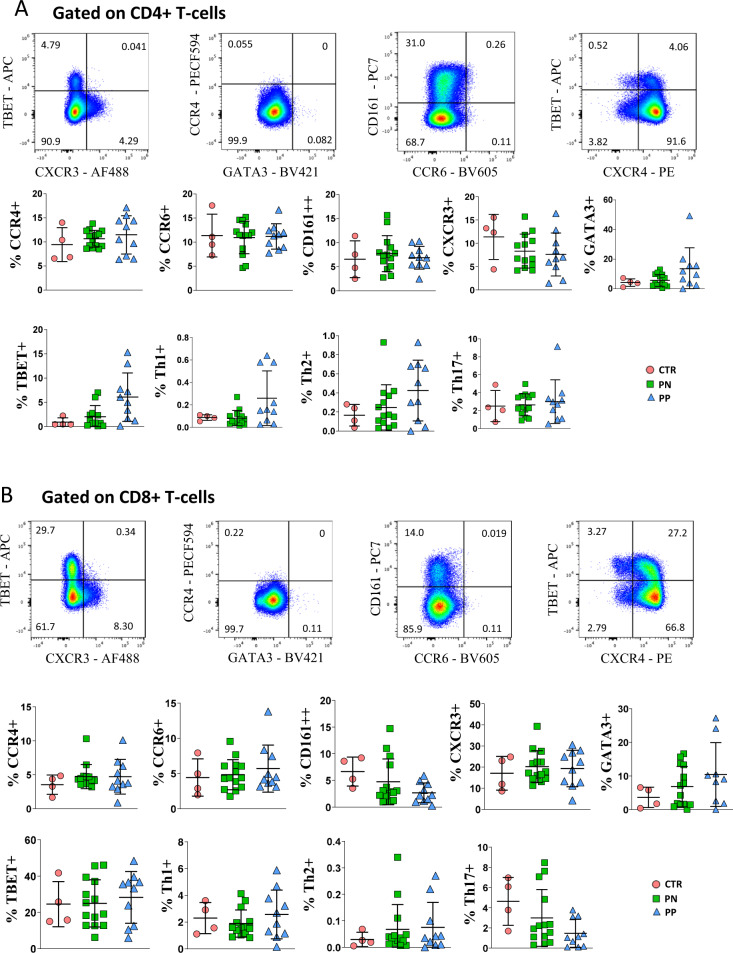
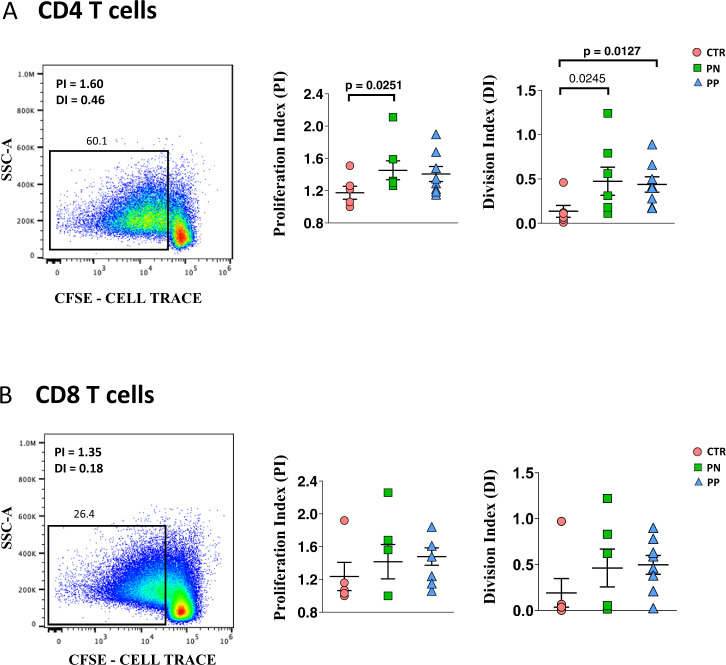
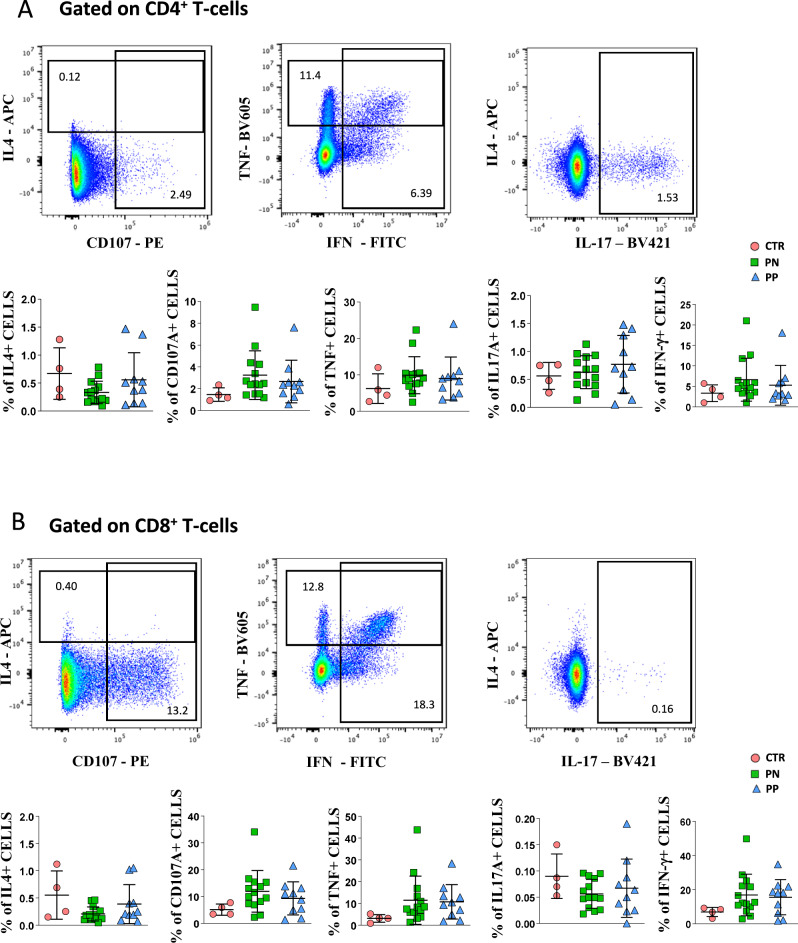
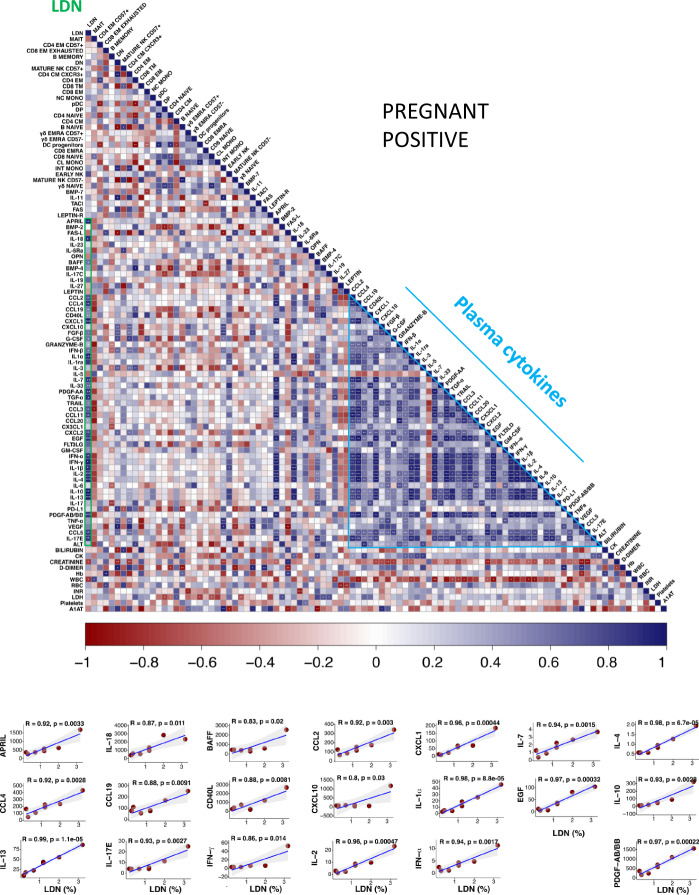
SARS-CoV-2 infection can affect all human beings, including pregnant women. Thus, understanding the immunological changes induced by the virus during pregnancy is nowadays of pivotal importance. Here, using peripheral blood from 14 pregnant women with asymptomatic or mild SARS-CoV-2 infection, we investigate cell proliferation and cytokine production, measure plasma levels of 62 cytokines, and perform a 38-parameter mass cytometry analysis. Our results show an increase in low density neutrophils but no lymphopenia or gross alterations of white blood cells, which display normal levels of differentiation, activation or exhaustion markers and show well preserved functionality. Meanwhile, the plasma levels of anti-inflammatory cytokines such as interleukin (IL)-1RA, IL-10 and IL-19 are increased, those of IL-17, PD-L1 and D-dimer are decreased, but IL-6 and other inflammatory molecules remain unchanged. Our profiling of antiviral immune responses may thus help develop therapeutic strategies to avoid virus-induced damages during pregnancy.


Conflict of interest statement

AQ, CP, GA, SD, DL, and JN are employers of Fluidigm Corporation; LC is the CEO at Labospace. All other authors declare no competing interest.

Figures

Fig. 1
Fig. 1. Unsupervised analysis of mononuclear cells in peripheral blood and their characterization.
A Uniform Manifold Approximation and Projection (UMAP) representation of PBMC landscape. Each color indicates a different cell population. CM, central memory; EM, effector memory; TM, transitional memory; CL, classical monocytes; INT, intermediate monocytes; NC, nonclassical monocytes; NK, natural killer cells; γδ, T cells expressing the γδ T-cell receptor; DC, dendritic cells; MAIT, mucosal-associated invariant T cells; LDN, low-density neutrophils; DN, CD4-, CD8- T lymphocytes; DP, CD4+, CD8+ T lymphocytes. B Heatmap representing different clusters identified by FlowSOM, with relative identity and percentages in all groups of subjects. The color in the heatmap represents the median of the arcsinh, 0–1 transformed marker expression calculated over cells from all the samples, varying from blue for lower expression to red for higher expression.
Fig. 2
Fig. 2. Detailed statistical analysis of PBMC landscape.
A Differential analysis performed using generalized linear mixed model (GLMM) between nonpregnant women (CTR; bar color: salmon; n = 3), uninfected pregnant women (PN; green, n = 10) and infected pregnant women (PP; azure, n = 7). The heat represents arcsine-square-root-transformed cell frequencies that were subsequently normalized per cluster (rows) to mean of zero and standard deviation of one. The color of the heat varies from blue indicating relative underrepresentation to red indicating relative overrepresentation. Bar and numbers at the right indicate significant differentially abundant clusters (green) and Bonferroni-adjusted p-values obtained from GLMM statistical test. B Analysis of the different cell populations identified as in panel A. A significant difference was observed in the percentage of low-density neutrophils (LDN), in infected pregnant women (PP) vs. uninfected pregnant (PN) or vs. healthy donors (CTR). The dot plots show the relative abundancies of 27 populations found within precleaned CD45+ live cells. Values (dots) for the three conditions are matched with the color used in A. Data represent individual percentage values (dots), median (center bar), and SEM (upper and lower bars). Generalized linear mixed model (GLMM) with Bonferroni correction has been used. The exact p-value is indicated in the figure. Source data are provided as a Source Data file.
Fig. 3
Fig. 3. Reclustering of CD4+ T cells reveals similar distribution of cells between infected or noninfected pregnant women and donors.
A Uniform manifold approximation and projection (UMAP) representation of CD4 T-cell landscape. Each color indicates one of the 14 different clusters. CM central memory, TM transitional memory, EM effector memory, EMRA terminally differentiated T cells, cTfh circulating follicular T helper cells, eTREG effector-regulatory T cells. B Differential analysis performed using generalized linear mixed model (GLMM) between nonpregnant women (CTR; bar color: salmon; n = 3), uninfected pregnant women (PN; green, n =10), and infected pregnant women (PP; azure, n = 7). The heat represents arcsine-square-root-transformed cell frequencies that were subsequently normalized per cluster (rows) to mean of zero and standard deviation of one. The color of the heat varies from blue indicating relative underrepresentation to red indicating relative overrepresentation. Bar and numbers at the right indicate significant differentially abundant clusters (green) and adjusted p values. C Statistical analysis of the different cell populations identified as in panel B. Comparison among infected pregnant women (PP) vs. uninfected pregnant (PN) or vs. healthy donors (CTR). The dot plots show the relative abundancies of 14 populations found within CD4+ T cells. Values (dots) for the three conditions are matched with the color used in B. Data represent individual percentage values (dots), median (center bar), and SEM (upper and lower bars). Generalized linear mixed model (GLMM) with Bonferroni correction has been used. The exact p-value is indicated in the figure. Source data are provided as a Source Data file.
Fig. 4
Fig. 4. Reclustering of CD8+ T cells reveals similar distribution of cells between infected or noninfected pregnant women and donors.
A. Left panel: Uniform manifold approximation and projection (UMAP) representation of CD8 T-cell landscape. Each color indicates one of the 13 different clusters. CM central memory, TM transitional memory, EM effector memory, EMRA terminally differentiated T cells, TREG regulatory T cells. B Differential analysis performed using generalized linear mixed model (GLMM) between nonpregnant women (CTR; bar color: salmon; n = 3), uninfected pregnant women (PN; green, n = 10), and infected pregnant women (PP; azure, n = 7). The heat represents arcsine-square-root-transformed cell frequencies that were subsequently normalized per cluster (rows) to mean of zero and standard deviation of one. The color of the heat varies from blue indicating relative underrepresentation to red indicating relative overrepresentation. Bar and numbers at the right indicate significant differentially abundant clusters (green) and adjusted p values. C Statistical analysis of the different cell populations identified as in panel A. Comparison among infected pregnant women (PP) vs. uninfected pregnant (PN) or vs. healthy, nonpregnant donors (CTR). The dot plots show the relative abundancies of 13 populations found within CD8+ T cells. Values (dots) for the three conditions are matched with the color used in B. Data represent individual percentage values (dots), median (center bar), and SEM (upper and lower bars). Generalized linear mixed model (GLMM) with Bonferroni correction has been used. The exact p-value is indicated in the figure. Source data are provided as a Source Data file.
Fig. 5
Fig. 5. Reclustering of CD19+ B cells reveals similar distribution of cells between infected or noninfected pregnant women and donors.
A. Left panel: Uniform manifold approximation and projection (UMAP) representation of B-cell landscape. Each color indicates one of the six different clusters. B Differential analysis performed using generalized linear mixed model (GLMM) between nonpregnant women (CTR; bar color: salmon; n = 3), uninfected pregnant women (PN; green, n = 10), and infected pregnant women (PP; azure, n = 7). The heat represents arcsine-square-root-transformed cell frequencies that were subsequently normalized per cluster (rows) to mean of zero and standard deviation of one. The color of the heat varies from blue indicating relative underrepresentation to red indicating relative overrepresentation. Bar and numbers at the right indicate significant differentially abundant clusters (green) and adjusted p values. C Detailed statistical analysis of the different cell populations identified as in panel A. Comparison among infected pregnant women (PP) vs. uninfected pregnant (PN) or vs. healthy donors (CTR). The dot plots show the relative abundancies of six populations found within B cells. Values (dots) for the three conditions are matched with the color used in B. Data represent individual percentage values (dots), median (center bar), and SEM (upper and lower bars). Generalized linear mixed model (GLMM) with Bonferroni correction has been used. The exact p-value is indicated in the figure. Source data are provided as a Source Data file.
Fig. 6
Fig. 6. Phenotypic characterization of CD4 and CD8 T cells of COVID-19 pregnant women.
A Expression of different chemokine receptors and lineage-specifying transcription factors in gated CD4+ T cells from healthy donors (CTR, n = 4), pregnant negative (PN, n = 13) and pregnant positive (PP, n = 10). Values (dots) for the three conditions are matched with the color used in Figs. 1–5. Data represent individual percentage values (dots), mean (center bar), and SD (upper and lower bars). Two-tailed Mann–Whitney t-test with Bonferroni correction has been used. Exact p-value is indicated in the figure, if significant. B Expression of different chemokine receptors and lineage-specifying transcription factors in gated CD8+ T cells from healthy donors (CTR, n = 4), pregnant negative (PN, n = 13) and pregnant positive (PP, n = 10). Values (dots) for the three conditions are matched with the color used in Figs. 1–5. Data represent individual percentage values (dots), mean (center bar) and SD (upper and lower bars). Two-tailed Mann–Whitney U-test with Bonferroni correction has been used. The exact p-value is indicated in the figure, if significant.
Fig. 7
Fig. 7. Proliferation of CD4 and CD8 T cells of COVID-19 pregnant women.
A. Proliferation index (PI) and division index (DI) in all CD4+ T cells from the three groups studied. Data represent individual values (dots) from healthy donors (CTR, n = 5), pregnant negative (PN, n = 6), and pregnant positive (PP, n = 7). Values (dots) for the three conditions are matched with the color used in Figs. 1–5. Data represent individual percentage values (dots), mean (center bar) and SEM (upper and lower bars). Two-tailed Mann–Whitney t-test with Bonferroni correction has been used. The exact p-value is indicated in the figure, if significant. B. Proliferation index (PI) and division index in all CD8+ T cells from the three groups studied. Data represent individual values (dots) from CTR (n = 5), pregnant negative (PN, n = 6), and pregnant positive (PP, n = 7). Values (dots) for the three conditions are matched with the color used in Figs. 1–5. Data represent individual percentage values (dots), mean (center bar), and SEM (upper and lower bars). Two-tailed Mann–Whitney U-test with Bonferroni correction has been used. The exact p-value is indicated in the figure, if significant.
Fig. 8
Fig. 8. Functional characterization of CD4 and CD8 T cells of COVID-19 pregnant women.
A Comparison among the three groups of persons under investigation regarding the production of cytokines by CD4+ T cells after in vitro stimulation with anti-CD3/CD28. Data represent individual values from healthy donors (CTR, n = 4), pregnant negative (PN, n = 14), and pregnant positive (PP, n = 10), mean (center bar) ± standard deviation (upper and lower bars). Values (dots) for the three conditions are matched with the color used in Figs. 1–5. Data represent individual percentage values (dots), mean (center bar), and standard deviation (upper and lower bars). Two-tailed Mann–Whitney t test with Bonferroni correction has been used. The exact p value is indicated in the figure, if significant. B Comparison among the three groups of persons under investigation regarding the production of cytokines by CD8+ T cells after in vitro stimulation with anti-CD3/CD28. Data represent individual values from healthy donors (CTR, n = 4), pregnant negative (PN, n = 14), and pregnant positive (PP, n = 10), mean (center bar) ± standard deviation (upper and lower bars). Values (dots) for the three conditions are matched with the color used in Figs. 1–5. Data represent individual percentage values (dots), mean (center bar), and SD (upper and lower bars). Two-tailed Mann–Whitney U-test with Bonferroni correction has been used. The exact p-value is indicated in the figure, if significant.
Fig. 9
Fig. 9. Correlogram showing the role of LDN in infected women, and the correlations among plasma cytokines.
Correlogram of pregnant positive women (PP). Spearman R (ρ) values are shown from red (−1.0) to blue (1.0); specific R values are indicated by the square color. Blank fields with dots indicate lack of signal. Spearman rank two-tailed p-value was indicated by *P < 0.05, **P < 0.01, and ***P < 0.001. Additional XY scatter plots, that specifically show the relationship between the variables that are most correlated with LDN, are displayed. Each scatter plot reports the regression line (blue), the Spearman R (ρ) value, the exact two-tailed p-value and the 95% confidence bands (light gray). All cytokines value are referred as pg/ml. PDGF-AB/BB refers to the ratio between the forms AA and AB of the platelet-derived growth factor (PDGF).

References

    1. Liu H, et al. Why are pregnant women susceptible to COVID-19? An immunological viewpoint. J. Reprod. Immunol. 2020;139:103122. - PMC - PubMed
    1. Ellington S, et al. Characteristics of women of reproductive age with laboratory-confirmed SARS-CoV-2 infection by pregnancy status - United States, January 22–June 7, 2020. MMWR Morb. Mortal. Wkly Rep. 2020;69:769–775. - PMC - PubMed
    1. Schwartz DA, Graham AL. Potential maternal and infant outcomes from (Wuhan) coronavirus 2019-nCoV infecting pregnant women: lessons from SARS, MERS, and other human coronavirus infections. Viruses. 2020;12:194. - PMC - PubMed
    1. Knight M, et al. Characteristics and outcomes of pregnant women admitted to hospital with confirmed SARS-CoV-2 infection in UK: national population based cohort study. BMJ. 2020;369:m2107. - PMC - PubMed
    1. Maraschini A, Corsi E, Salvatore MA, Donati S. Coronavirus and birth in Italy: results of a national population-based cohort study. Ann. dell’Istituto Super. Di Sanit.à. 2020;56:378–389. - PubMed

Publication types

MeSH terms