. 2021 Jul 29;12(1):4678.
doi: 10.1038/s41467-021-24938-4.

SARS-CoV-2 specific T cell responses are lower in children and increase with age and time after infection

Affiliations

SARS-CoV-2 specific T cell responses are lower in children and increase with age and time after infection

Carolyn A Cohen et al. Nat Commun. .

Abstract

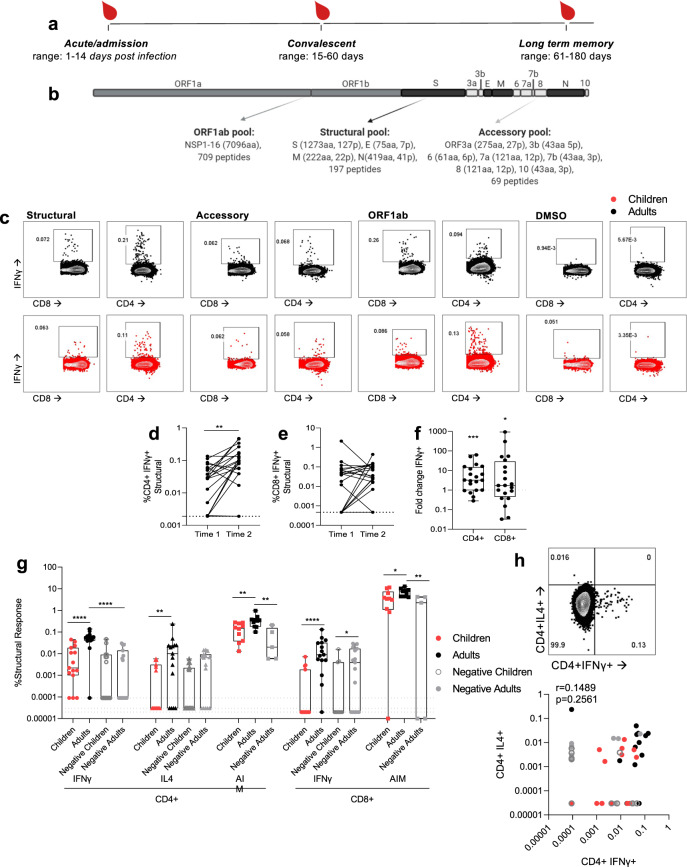
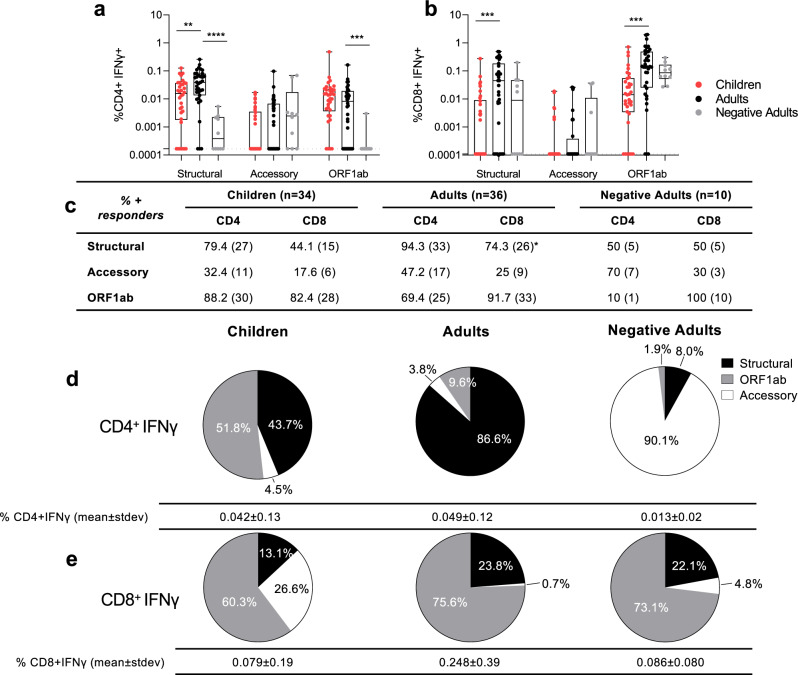
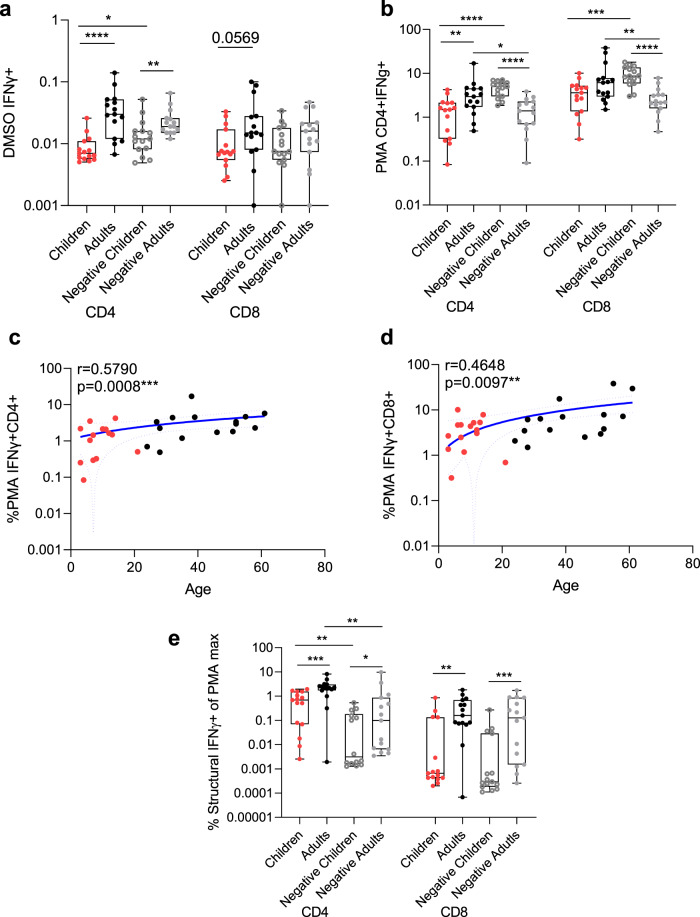
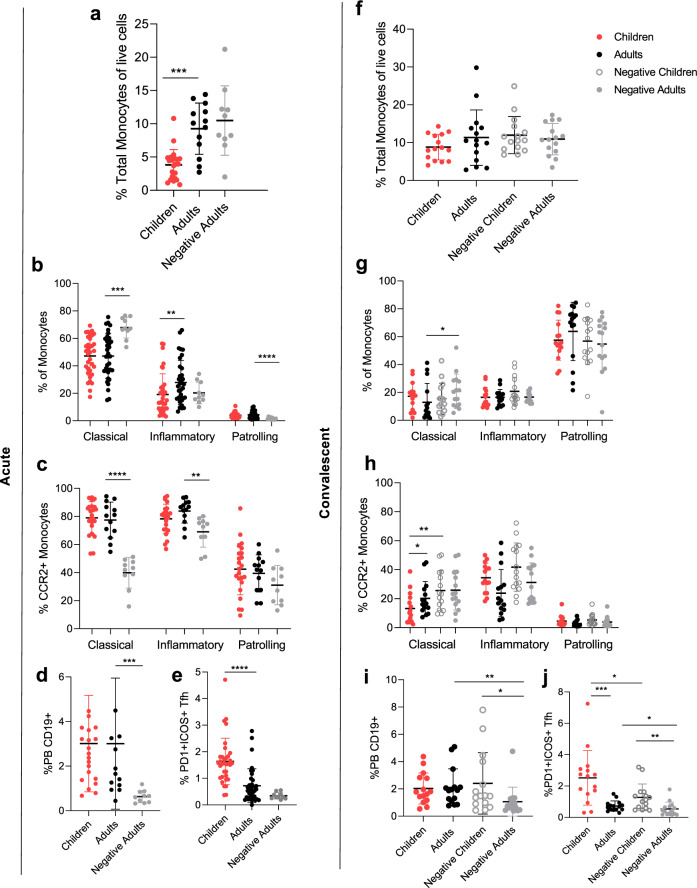
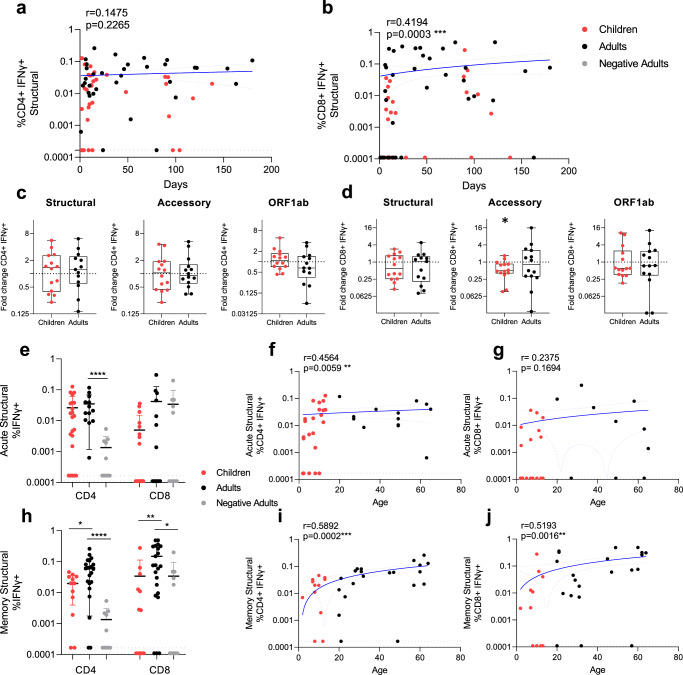
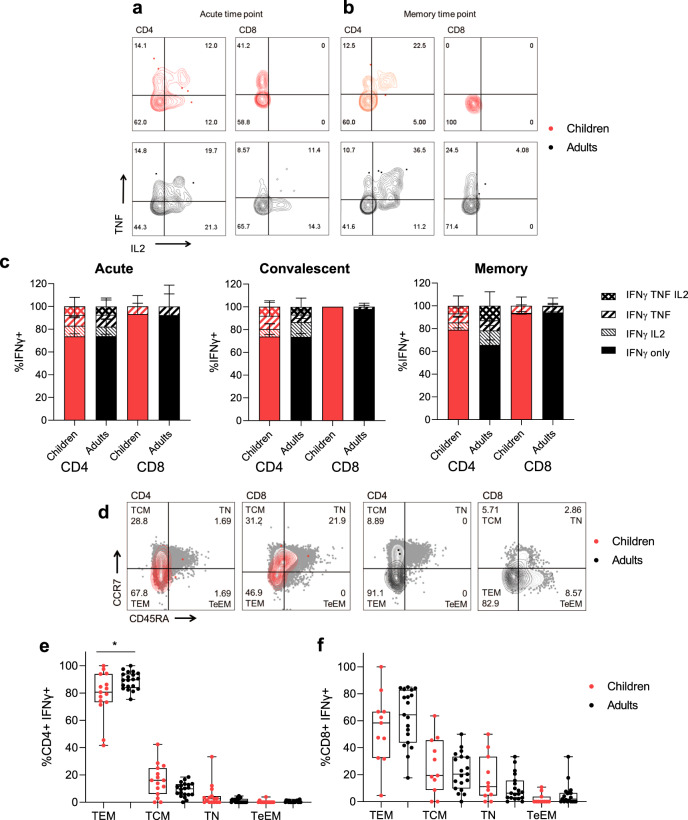
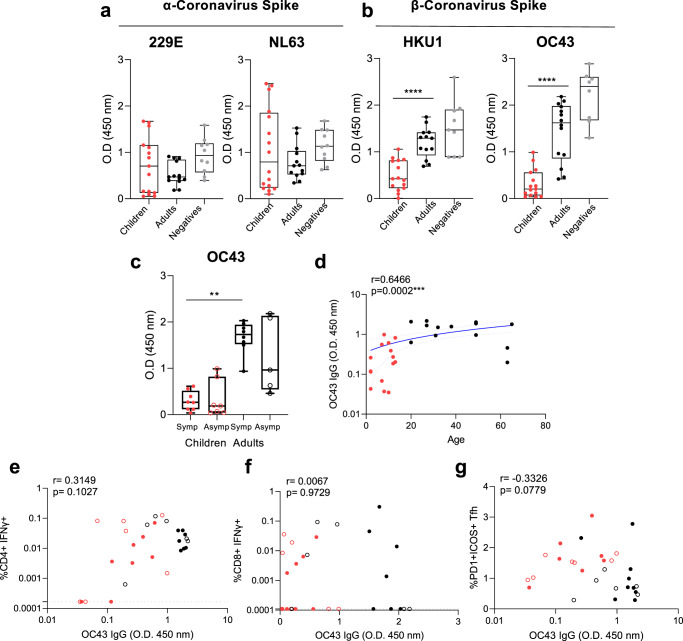
SARS-CoV-2 infection of children leads to a mild illness and the immunological differences with adults are unclear. Here, we report SARS-CoV-2 specific T cell responses in infected adults and children and find that the acute and memory CD4+ T cell responses to structural SARS-CoV-2 proteins increase with age, whereas CD8+ T cell responses increase with time post-infection. Infected children have lower CD4+ and CD8+ T cell responses to SARS-CoV-2 structural and ORF1ab proteins when compared with infected adults, comparable T cell polyfunctionality and reduced CD4+ T cell effector memory. Compared with adults, children have lower levels of antibodies to β-coronaviruses, indicating differing baseline immunity. Total T follicular helper responses are increased, whilst monocyte numbers are reduced, indicating rapid adaptive co-ordination of the T and B cell responses and differing levels of inflammation. Therefore, reduced prior β-coronavirus immunity and reduced T cell activation in children might drive milder COVID-19 pathogenesis.


Conflict of interest statement

The authors declare no competing interests.

Figures

Fig. 1
Fig. 1. Infected children have lower CD4+ and CD8+ T cell responses than adults.
a Heparinised blood samples for PBMCs were collected from COVID-19 patients in Hong Kong during the course of infection and recovery. b Overlapping peptide pools of the whole SARS-CoV-2 proteome were generated to represent ORF1ab, structural, and accessory proteins with amino acids (aa) and peptides (p) per protein shown. c PBMCs from adults (black) and children (red) were stimulated with peptide pools or a DMSO control and IFNγ production of CD4+ and CD8+ T cells measured by flow cytometry (see Supplementary Figure 1 for gating strategy). Paired time points at hospital admission and discharge (time 1: mean 7.25 ± stdev 4.6 days post-infection, range 3–18; time 2: mean 13.4 ± stdev 4.4, range 6–21) for paired background (DMSO) subtracted structural specific IFNγ response of CD4+ (d) and CD8+ (e) T cells (n = 20 adults). A two-sided Wilcoxon test was used to determine differences **p < 0.01. Dotted lines represent the limit of detection following background subtraction (IFNγ of CD4+ = 0.0019, IFNγ of CD8+ = 0.00047). f The fold change of paired structural specific CD4+ and CD8+ T cells responses from (d, e), significance calculated using One-sample Wilcoxon test against a theoretical median of 1, *p < 0.05, **p < 0.01, ***p < 0.001. The dotted line at 1 indicates no fold change. The SARS-CoV-2 CD4+ (g) or CD8+ (h) T cell responses of COVID-19 children (n = 15), adults (n = 15) (mean± stdev:34 ± 11 days, range 14–57 days)) and negative children (n = 15) and negative adults (n = 15). Data are displayed as individual responses with box and whiskers plots representing the median, upper and lower quartiles, and minimum and maximum values against the structural peptide pool, measured by IFNγ production in CD4+ and CD8+ T cells, IL4 production in CD4+ T cells, and surface expression of the combination of CD40L, CD137, OX40, and CD69 activation-induced markers (AIM), with paired responses to DMSO subtracted. The dotted lines represent the lower limits of detection for ICS assays, determined as the smallest calculated value above the DMSO background response (IFNγ of CD4+ = 0.00009%, IL-4 of CD4+ = 0.00003%, IFNγ of CD8+ = 0.00002%). Comparisons between groups were performed using the Two-sided Mann–Whitney test, statistical differences are indicated by **p<0.01, ****p<0.0001. CD4+ T cells do not simultaneously produce IFNγ and IL-4 as shown by representative FACS plot and correlation (h). d **p = 0.0012, (f) ***p = 0.0005, *p = 0.0230, (g) ****p< 0.0001, < 0.0001, < 0.0001, **p = 0.0082, 0.0052, 0.0047, *p = 0.0243, 0.0355, **p = 0.0027.
Fig. 2
Fig. 2. Specificity of T cell responses in adults and children.
The SARS-CoV-2 CD4+ (a) or CD8+ (b) T cell responses of COVID-19 children (n = 34), adults (n = 36) (mean±stdev: 42 ± 44, range 1–180 days) and negative adults (n = 10). Data are displayed as individual responses to each peptide pool with IFNγ production to paired DMSO subtracted, with box and whiskers plots displaying the median, upper and lower quartiles, minimum and maximum values. The dotted line represents the lower limit of detection, determined as the smallest calculated value above the DMSO background response (IFNγ of CD4+ = 0.00017%, IFNγ of CD8+ = 0.00011%). a, b Comparisons between groups were performed using two-sided Mann–Whitney test statistical differences are indicated by *p<0.05, **p<0.01, ***p<0.001. Values above the limit are used to classify participants as responders and presented as a percentage with the numbers of responders in brackets (c). Differences between children (n = 34) and adults (n = 36) from all time points (1 to 180 days post symptom onset) were determined by Fisher’s exact test and displayed in the adults column where *p < 0.05. Pie charts show the proportion of total IFNγ+ CD4+ (d) and CD8+ (e) SARS-CoV-2 responses with DMSO subtracted in children (n = 34), adults (n = 36) and negative adults (n = 10) (from a, b). Values below the limit of detection assigned the value of 0. (a) **p = 0.0065, ****p < 0.0001, ***p = 0.0008, (b) ***p = 0.0003, 0.0001.
Fig. 3
Fig. 3. Non-specific T cell responses increase with age in infected donors.
CD4+ and CD8+ T cell responses for (a) background (by DMSO stimulation) and (b) maximum (by PMA/Ionomycin stimulation) in children (n = 15), adults (n = 15) from convalescent/ memory time points (mean ± stdev 34 ± 11, range: 14–57 days post symptom onset), and uninfected negative children (n = 15) and adult (n = 15) controls. Comparisons were made by Mann–Whitney test where **p < 0.01, ***p < 0.001, ****p < 0.0001. Correlation of age with CD4+ (c) and CD8+ (d) T cell responses by PMA/ionomycin stimulation. Two-sided Spearman’s test was used to calculate r values, and statistical significance is displayed as ***p < 0.001. c, d Blue lines of linear regression represent the overall trend with dotted lines showing 95% confidence intervals. Black dotted lines represent the limit of detection (IFNγ of CD4+ = 0.00009% IFNγ of CD8+ = 0.00003%). e The structural peptide pool response for CD4+ and CD8+ T cells in adults and children (from Fig. 1g) normalised to a paired maximum IFNγ production from (b) PMA/ionomycin stimulation. Comparisons similarly made by Two-sided Mann–Whitney test where *p < 0.05, **p < 0.01, ***p<0001. (a, b, e) Data is representative of individual values with box and whiskers plots showing the median, upper and lower quartiles, and minimum and maximum. (a) *p = 0.0463, **p = 0.0054, ****p < 0.0001, (b) CD4 *p = 0.0164, **p = 0.0086, ****p < 0.0001, CD8 **p = 0.0057, ***p = 0.0002, ****p < 0.0001, (e) CD4 *p = 0.0259, **p = 0.0011, 0.0049, ***p = 0.0005, CD8 **p = 0.0049, ***p = 0.0008.
Fig. 4
Fig. 4. Cellular recruitment of Tfh cell, plasmablasts, and monocytes.
Early (< day 14) recruitment of innate and adaptive cells was measured by flow cytometry (see Supplementary Figure 3 for gating strategy) for COVID-19 children (n = 22), adults (n = 13), and negative controls (n = 10) (ae). Convalescent/ memory samples of children (n = 15), adults (n = 15), and negative adults (n = 15) were also tested alongside negative children (n = 15) (fj). Total monocytes (a, f), monocyte phenotype (b, g), and activation of monocytes (c, h). Total plasmablast (d, i) and activated T follicular helper cell (e, f). Data represents the individual response, mean ± SD. Statistical differences were determined using a two-sided Mann–Whitney test between children and adults, adults and negative adults, and children and negative children where **p < 0.01, ***p < 0.001, ****p < 0.0001. a ***p = 0.0002, (b) **p = 0.0054, ***p = 0.0001, ****p < 0.0001, (c) **p = 0.0020, ****p < 0.0001, (d) ***p = 0.0001, (e) ****p < 0.0001, (g) *p = 0.0321, (h) *p = 0.0203, **p = 0.0086, (i) *p = 0.0124, **p = 0.0016, (j) *p = 0.0489, 0.0235, **p = 0.0013, ***p = 0.0004.
Fig. 5
Fig. 5. SARS-CoV-2 specific T cell responses increase over time and age.
Correlation of IFNγ responses for CD4+ (a) and CD8+ (b) T cells against the structural peptide pool with children (red) (n = 34) and adults (black) (n = 36) (with background IFNγ production to DMSO subtracted), against days post symptom onset. Black dotted lines represent the limit of detection (IFNγ of CD4+ = 0.000167 (a), IFNγ of CD8+ = 0.00011(b)). Fold change of IFNγ CD4+ (c) and CD8+ (d) T cell responses were calculated as the later time point (mean ± stdev: 32.8 ± 35.7 days, range: 9–138) over admission time point responses (mean±stdev: 7.6 ± 4.2, range: 2–15)) in response to the structural, accessory and ORF1ab peptide pools in children and adults from two independent experiments (children n = 14, adults n = 14). Data is representative of individual data points with boxes and whiskers graphs showing the median, upper and lower quartiles, minimum and maximum. One-sample Wilcoxon tests were used for determining significance of fold changes, where *p<0.05. Acute (samples < 14 days post symptom onset, mean ± stdev: 8.0 ± 3.8, range: 1–14, n = 22 children, n = 14 adults) (eg), and convalescent/memory (hj) (mean ± stdev: 70.5 ± 41.9, range: 15–180 days post symptom onset, n = 12 children, n = 22 adults) IFNγ structural specific (f, i) CD4+ and (g, j) CD8+ T cell responses and negative controls (n=10). Data in e and h show individual data points with mean±SD. For statistical comparisons between children and adults, or adults and negatives, two-tailed Mann–Whitney tests were performed, *p < 0.05, **p < 0.01, ***p < 0.001, ****p < 0.0001. The magnitude of the acute (from e) and memory (from h) structural IFNγ CD4+ (f, i) and CD8+ (g, j) T cell response with age. (a, b, f, g, i, and j) r and p values are calculated using two-tailed Spearman’s correlation and *p < 0.05, **p<0.01, ***p<0.001, ****p<0.0001. Blue lines of linear regression represent the overall trend, and blue dotted lines show the upper and lower 95% confidence intervals. All data points are individual responses minus paired background IFNγ response to a DMSO control. (d) *p = 0.0245, (e) ****p < 0.0001, (h) *p = 0.0162, 0.0219, **p = 0.0074, ****p < 0.0001.
Fig. 6
Fig. 6. Cytokine polyfunctional quality and memory phenotype.
Representative FACS plots of TNF and IL2 producing IFNγ + CD4+ and CD8+ T cells of children (red) and adults (black) at acute (d < 14) (a) and memory (child: 118 days, adult: 94 days) (b) time points. (c) The proportion of IFNγ producing CD4+ and CD8+ T cells which are single, double, or triple cytokine producers at acute (< 14 days), convalescent (15–60 days), or memory (61–180 days) time points post symptom onset. Bars represent the mean values in infected children and adults, while error bars represent SD. Kruskal–Wallis test for multiple comparisons was carried out to compare each group between children and adults. d Representative FACS plots showing memory phenotypes of IFNγ + CD4+ and CD8+ T cells based on the expression of CCR7 and CD45RA. Sections are T effector memory (TEM), central memory (TCM), terminal effector memory (TeEM), or naïve (TN). Memory phenotype responses in IFNγ + CD4+ (e) and CD8+ (f) T cells of responders at later time points (15–180 days post symptom onset). Data shows individual values, box and whiskers plots median, upper and lower quartiles, minimum and maximum values. Comparisons between children (n = 15) and adults (n = 20) in each group were performed using the Mann–Whitney test, (e) *p = 0.0400.
Fig. 7
Fig. 7. Previous exposure to common cold β-coronaviruses and T cell responses.
Total IgG responses to the Spike protein (S1 + S2) of common cold α (229E, NL63) (a) and β (HKU1, OC43) (b) coronaviruses measured by ELISA from acute time points (mean ± stdev: 8 ± 3.8, range: 2–14 days post-infection). c Stratification of OC43 IgG response by symptomatic (closed circles, n = 8 children, n = 8 adults) and asymptomatic (open circles, n = 8 children, n = 5 adults). ac Data is representative of individual donor responses with background subtracted (nonspecific protein block), and displayed with box and whiskers plots of the median, upper and lower quartiles, and minimum and maximum values. Comparison between children (n = 15) and adults (n = 14) or adults negative controls (n = 10) was performed using two-tailed Mann–Whitney test where **p < 0.01, ***p < 0.001, ****p < 0.0001. c Multiple comparisons between symptomatic and asymptomatic adults and children were carried out using Kruskal–Wallis tests, where **p < 0.01. d Correlation of OC43 IgG and age. A blue line of linear regression represents the overall trend, and blue dotted lines show the upper and lower 95% confidence intervals. Correlation of structural SARS-CoV-2 specific IFNγ+ CD4+ (e) or CD8+ (f) T cell responses and OC43 Spike IgG. Correlation of activated Tfh and OC43 (g) Spike IgG. R values are determined using Spearman’s correlation and statistically significant correlations are displayed as ***p < 0.001. Dotted lines indicate the limit of detection following subtraction of DMSO from T cell response. b ****p < 0.0001, < 0.0001, (c) **p = 0.0062.

Update of

References

    1. Ing AJ, Cocks C, Green JP. COVID-19: in the footsteps of Ernest Shackleton. Thorax. 2020;75:693–694. - PMC - PubMed
    1. Addetia A, et al. Neutralizing Antibodies Correlate with Protection from SARS-CoV-2 in Humans during a Fishery Vessel Outbreak with a High Attack Rate. J Clin Microbiol. 2020;58:e02107–20. doi: 10.1128/JCM.02107-20. - DOI - PMC - PubMed
    1. Lumley, S. F. et al. Antibody Status and Incidence of SARS-CoV-2 Infection in Health Care Workers. N Engl J Med. 384, 533–540 (2021). - PMC - PubMed
    1. Chandrashekar A, et al. SARS-CoV-2 infection protects against rechallenge in rhesus macaques. Science. 2020;369:812–817. doi: 10.1126/science.abc4776. - DOI - PMC - PubMed
    1. Greaney AJ, et al. Complete mapping of mutations to the SARS-CoV-2 spike receptor-binding domain that escape antibody recognition. Cell Host Microbe. 2021;29:44–57.e9. doi: 10.1016/j.chom.2020.11.007. - DOI - PMC - PubMed

Publication types

MeSH terms

Substances