. 2021 Jul 29;11(1):15484.
doi: 10.1038/s41598-021-95014-6.

The impact of climate change in wheat and barley yields in the Iberian Peninsula

Affiliations

The impact of climate change in wheat and barley yields in the Iberian Peninsula

Virgílio A Bento et al. Sci Rep. .

Abstract

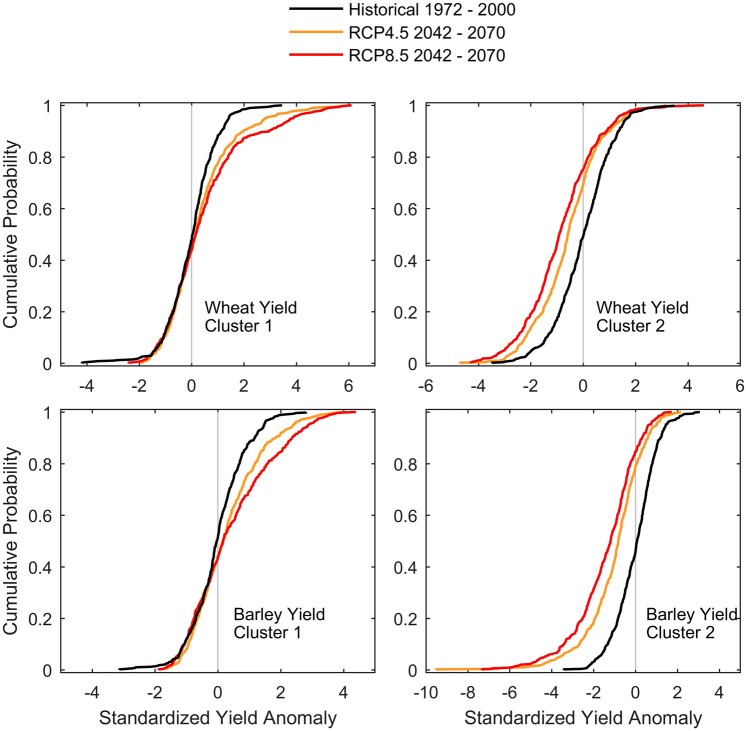
The impact of climate change on wheat and barley yields in two regions of the Iberian Peninsula is here examined. Regression models are developed by using EURO-CORDEX regional climate model (RCM) simulations, forced by ERA-Interim, with monthly maximum and minimum air temperatures and monthly accumulated precipitation as predictors. Additionally, RCM simulations forced by different global climate models for the historical period (1972-2000) and mid-of-century (2042-2070; under the two emission scenarios RCP4.5 and RCP8.5) are analysed. Results point to different regional responses of wheat and barley. In the southernmost regions, results indicate that the main yield driver is spring maximum temperature, while further north a larger dependence on spring precipitation and early winter maximum temperature is observed. Climate change seems to induce severe yield losses in the southern region, mainly due to an increase in spring maximum temperature. On the contrary, a yield increase is projected in the northern regions, with the main driver being early winter warming that stimulates earlier growth. These results warn on the need to implement sustainable agriculture policies, and on the necessity of regional adaptation strategies.


Conflict of interest statement

The authors declare no competing interests.

Figures

Figure 1
Figure 1
(top) Map with provinces that encompass cluster 1 (blue) and cluster 2 (orange); (bottom) Standardized detrended yield anomaly (μ = 0, σ = 1) of wheat (red) and barley (blue) for cluster 1 (left panel) and cluster 2 (right panel).
Figure 2
Figure 2
Correlation between standardized detrended yield anomaly of wheat (left panels) and barley (right panels) and CORDEX-Evaluation models standardized detrended precipitation (bottom), Tmax (top), and Tmin (middle) for cluster 1 and cluster 2.
Figure 3
Figure 3
Representation of the selected predictors (displayed in tones of blue) for each CORDEX-Evaluation RCM. The matrix is divided into 9 blocks corresponding to TX, TN, and PR predictors from October to June (left to right), and the 7 RCMs for wheat and barley in cluster 1, and wheat and barley in cluster 2 (top to bottom). Tones of blue indicate the relative percentage of the coefficient associated to a given predictor and sum to 100% for each RCM. Symbols ‘+’ and ‘-’ specify if the coefficient is positive or negative, respectively. The bottom table shows the number of times a predictor is selected by cereal and cluster. The single column table at the right of the matrix indicate the number of predictors by RCM, cereal, and cluster. The table on the right displays the metrics associated to the comparison between cereal yields observed and predicted with regression models before and after cross-validation (cv): correlation R, Rajd2, bias, and MAE, in order from left to right.
Figure 4
Figure 4
Comparison between distributions of yield anomaly in the form of ECDFs (top) and boxplots (bottom) for the 7 CORDEX-Evaluation models, the multi-model ensemble yield mean, and the observed values. Boxes range from the 25th to the 75th percentiles with the median depicted inside the box; whiskers represent the 1st and 99th percentiles.
Figure 5
Figure 5
Pooled wheat (top) and barley (bottom) yield anomalies using RCP4.5 (orange) and RCP8.5 (red) for the 2042–2070 period in relation to the historical (1972–2000; black line). Yield was estimated using regression coefficients for individual GCM/RCM models.
Figure 6
Figure 6
Distribution of TX (°C), TN (°C) and PR (%) anomalies (future–historical) for the most relevant predictors (TX11, TX03, TX04 and TX05; TN04 and TN05; PR01, PR04, PR05 and PR06) for cluster 1 (top) and cluster 2 (bottom). Each boxplot represents the combined distribution of the CORDEX available models for the: (yellow) RCP4.5 2042–2070; (orange) RCP8.5 2042–2070.

References

    1. Bindi M, Olesen JE. The responses of agriculture in Europe to climate change. Reg. Environ. Change. 2011;11:151–158. doi: 10.1007/s10113-010-0173-x. - DOI
    1. Müller C, Cramer W, Hare WL, Lotze-Campen H. Climate change risks for African agriculture. Proc. Natl. Acad. Sci. USA. 2011;108:4313–4315. doi: 10.1073/pnas.1015078108. - DOI - PMC - PubMed
    1. Beach RH, et al. Climate change impacts on US agriculture and forestry: Benefits of global climate stabilization. Environ. Res. Lett. 2015;10:095004. doi: 10.1088/1748-9326/10/9/095004. - DOI
    1. Ray DK, Gerber JS, Macdonald GK, West PC. Climate variation explains a third of global crop yield variability. Nat. Commun. 2015;6:5989. doi: 10.1038/ncomms6989. - DOI - PMC - PubMed
    1. Schlenker W, Roberts MJ. Nonlinear temperature effects indicate severe damages to U.S. crop yields under climate change. Proc. Natl. Acad. Sci. USA. 2009;106:15594–15598. doi: 10.1073/pnas.0906865106. - DOI - PMC - PubMed

Publication types