. 2021 Jul 29;11(1):15486.
doi: 10.1038/s41598-021-94992-x.

Torpor enhances synaptic strength and restores memory performance in a mouse model of Alzheimer's disease

Affiliations

Torpor enhances synaptic strength and restores memory performance in a mouse model of Alzheimer's disease

Christina F de Veij Mestdagh et al. Sci Rep. .

Abstract

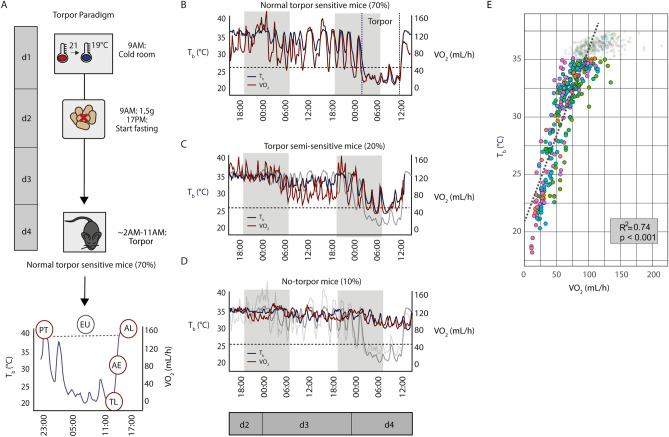
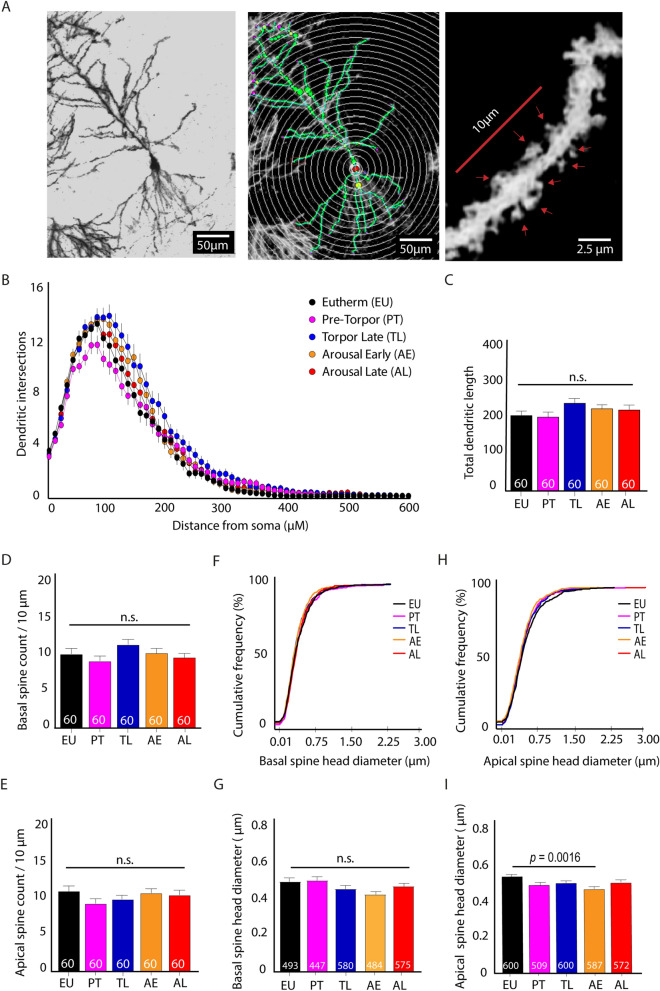
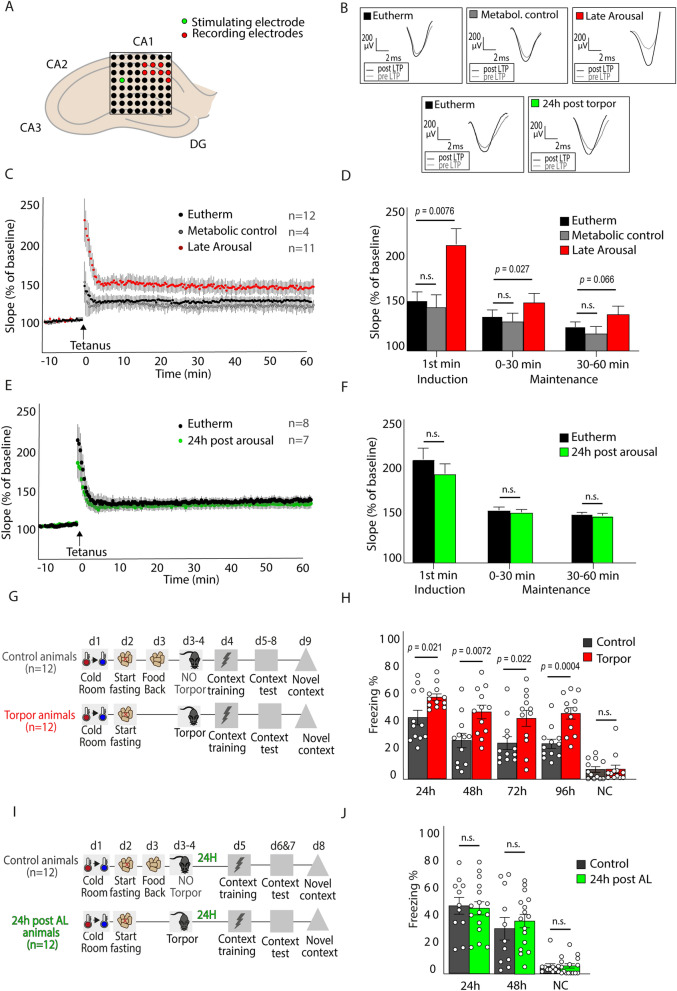
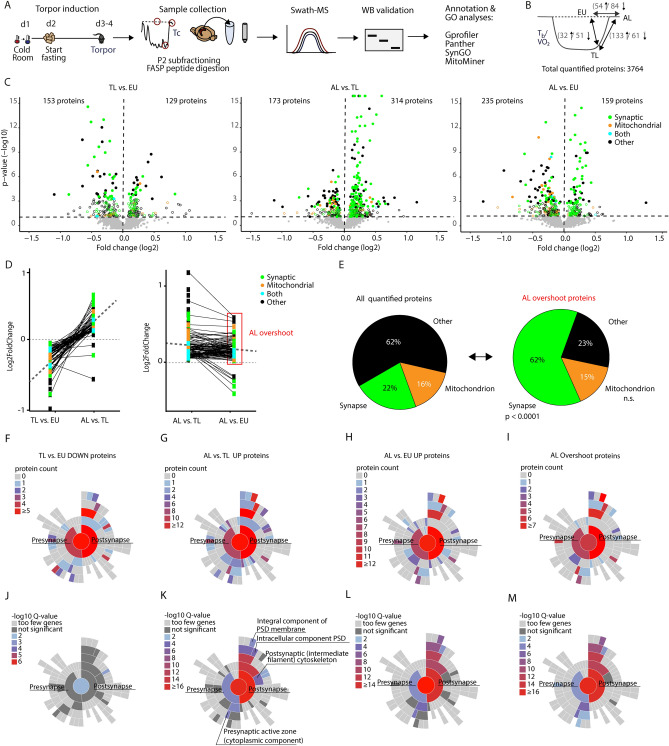
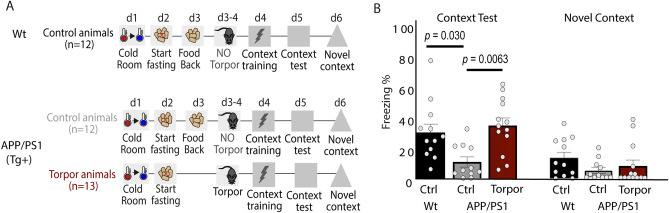
Hibernation induces neurodegeneration-like changes in the brain, which are completely reversed upon arousal. Hibernation-induced plasticity may therefore be of great relevance for the treatment of neurodegenerative diseases, but remains largely unexplored. Here we show that a single torpor and arousal sequence in mice does not induce dendrite retraction and synapse loss as observed in seasonal hibernators. Instead, it increases hippocampal long-term potentiation and contextual fear memory. This is accompanied by increased levels of key postsynaptic proteins and mitochondrial complex I and IV proteins, indicating mitochondrial reactivation and enhanced synaptic plasticity upon arousal. Interestingly, a single torpor and arousal sequence was also sufficient to restore contextual fear memory in an APP/PS1 mouse model of Alzheimer's disease. Our study demonstrates that torpor in mice evokes an exceptional state of hippocampal plasticity and that naturally occurring plasticity mechanisms during torpor provide an opportunity to identify unique druggable targets for the treatment of cognitive impairment.


Conflict of interest statement

The authors declare no competing interests.

Figures

Figure 1
Figure 1
Torpor induction in mice. (A) Steady torpor is induced in mice using ambient temperature reduction on day 1 (Ta 21 → 19 °C) and food restriction on day 2 (1.5 g from 9:00AM till 17:00PM), followed by a fasting period of maximally 40 h. During the second night of fasting, ~ 70% of the mice enter torpor. Torpor stages were defined as pre-torpor (PT; Tb > 36 °C / VO2 > 120 mL/h); torpor late (TL; Tb < 26 °C and/or VO2 < 40 mL/h for at least 6 h); arousal early (AE; Tb of ~ 30 °C and VO2 of ~ 80 mL/h); arousal late (AL; Tb 37 °C and VO2 > 120 mL/h for 2 h). Euthermic (EU) animals were held at normal housing temperature and fed ad lib. (B) Representative core body temperature (Tb) and metabolic rate (VO2) graphs of normal torpor sensitive mice (70%; n = 21/30 mice). An average torpor bout lasted 9 ± 0.65 h (n = 12) with Tb (blue line) dropping to ~ 21 °C and VO2 (red line) dropping to ~ 20 mL/h VO2. (C) Torpor semi-sensitive mice (20%; n = 6/30 mice) did not reach stable Tb < 26 °C, and (D) no-torpor mice (10%; n = 3/30 mice) do not enter torpor after two nights of fasting. Normal torpor graphs are shown in grey for reference. (E) Tb (°C) and VO2 (mL/h) were highly correlated (n = 12 mice; R2 = 0.74, p < 0.001).
Figure 2
Figure 2
Torpor does not affect neuronal structural integrity in mice. (A) Representative images of a Golgi-Cox stained CA1 pyramidal neuron at 10 × magnification (left), a tracing (green) and Scholl analysis (white) of the same neuron (middle; 1 soma radius = 10 µm) and a 40 × magnification used for spine counting (red arrows). (B) Scholl analysis revealed no significant differences in dendritic complexity between torpor phases (EU, PT, TL, AE and AL; n = 10 neurons per animal from 6 animals per group; Two-way ANOVA F4,296 = 2.022, p = 0.0913). (C) Total dendritic length of CA1 pyramidal neurons did also not differ significantly between groups (One-way ANOVA F4,295 = 2.244, p = 0.63). (D-E) Basal (D) and apical (E) spine count did not differ significantly between groups either (One-way ANOVA F4,295 = 2.044, p = 0.22 and F4,295 = 1.077, p = 0.37, respectively). (F-G) Cumulative frequency distributions (F) and geometric means (G) of basal spine head diameters did not reveal significant differences among groups (Kruskall-Wallis p = 0.90; One-way ANOVA F4,2574 = 2.316, p = 0.055). (H-I) Cumulative frequency distributions (H) and geometric means (I) of apical spine head diameter revealed a significant decrease in spine head diameter at AE compared to EU in geometric means only (0.44 ± 0.01 µm vs 0.38 ± 0.010 µm; One-way ANOVA F4,2863 = 5.346, p = 0.0015; post-hoc Tuckey p = 0.0016), not in frequency distribution (Kruskall-Wallis p = 0.92). Spine head diameter was restored again in AL.
Figure 3
Figure 3
Hippocampal LTP and memory are enhanced during arousal. (A) LTP was measured using a 64-electrode grid. One electrode was used to stimulate the Schaffer collateral pathway and 6–8 electrodes were used to record field potentials in CA1. (B) Representative pre- and post-tetanus fEPSP traces of EU (n = 12), metabolic control (n = 4) and AL (n = 11) animals and of EU (n = 8) and 24 h post-arousal (n = 7) animals. (C) LTP was measured as the fEPSP slope as % of baseline. (D) A significant increase in fEPSP slope was observed in AL versus EU in the first minute after tetanus (AL: 219.1% ± 22.1%, EU: 153.4% ± 9.5%; One-way ANOVA F2,25 = 5.239, p = 0.0126) and for the first 30 min after tetanus (AL: 153.0% ± 9.6%, EU: 128.8% ± 5.7%; One-way ANOVA F2,25 = 3.513, p = 0.0452; post-hoc Fisher’s LSD p = 0.0076, p = 0.027 and p = 0.066 for 0–1 min, 0–30 min and 30–60 min, respectively). LTP in EU mice and metabolic control mice did not differ significantly. (E) LTP induction was separately determined for EU and 24 h post-arousal mice. (F) No significant differences in LTP were observed between EU and 24 h post-arousal mice (Student’s t-test; p > 0.05). (G) To test contextual fear memory, torpor mice and no-torpor control mice received a 0.7 mA footschock on day 4 (d4; the late arousal phase of the torpid mice) and were tested in the same context 24 h, 48 h, 72 h and 96 h later, and in a novel context (NC) on d9. (H) Freezing levels were significantly increased on all 4 time points for torpor mice compared with no-torpor control mice (24 h: control 44.6% ± 5.4% versus torpor 59.1% ± 2.4%; 48 h: 27.8% ± 5.2% versus 48.0% ± 5.8%; 72 h: 26.0% ± 4.7% versus 43.0% ± 5.8%; 96 h: 25.7% ± 3.3% versus 46.6% ± 4.1%; Student’s t-test p = 0.021, p = 0.0072, p = 0.022 and p = 0.0004 for 24 h, 48 h, 72 h and 96 h, respectively), indicating stronger fear memory in torpor mice lasting at least 4 days. Little freezing was measured in the NC (control 6.8% ± 2.1%; arousal 6.2% ± 3.0%). (I,J) Fear conditioning at 24 h after arousal showed no differences in freezing levels between 24 h post-AL mice and control mice at 24 h or 48 h after acquisition (Student’s t-test; p = 0.8518 and 0.5326 respectively).
Figure 4
Figure 4
Changes in synaptic and mitochondrial protein levels during torpor and arousal. (A) After torpor induction, hippocampal protein samples were prepared from EU, TL and AL mice (n = 6 per group). P2 fractions were used for quantitative mass spectrometry. Significantly regulated proteins were validated with Western blotting, and ontology enrichment was used for functional interpretation. (B) In total, 3764 proteins were quantified. Focusing on three contrasts, TL versus EU, AL versus EU and AL versus TL, 138 (54 up and 84 down), 83 (32 up and 51 down) and 194 (133 up and 61 down) significantly regulated proteins were identified after multiple testing correction (FDR; q < 0.05). (C) Volcano plots showing the -10log p-value (y-axis) and the log2 fold change (x-axis) of all quantified proteins in the three different contrasts. Dashed lines indicate the p < 0.05 cutoff (Student’s t-test), FDR corrected significant proteins with q < 0.05 are depicted as filled dots. Colors indicate proteins that were annotated to the synapse (green), mitochondrion (orange), both (blue) or other cellular components (black). (D) Downregulated proteins in TL versus EU were typically upregulated in AL versus TL (left), and upregulated proteins in AL versus TL were typically also upregulated in AL versus EU (right). Dashed lines depict mean regulation. The red box marks ‘AL overshoot’ proteins (n = 99) that are upregulated from TL to AL, and in AL show significantly higher expression than in EU controls. (E) Pie charts showing a significant overrepresentation of the cellular component term synapse (green) in ‘AL overshoot’ proteins compared with all quantified proteins (Fisher’s Exact test; p < 0.001). Mitochondrion (orange) is the second most abundant term in this group, although not significantly enriched. (F-M) Functional annotation and enrichment of synaptic proteins were further determined with SynGO. Postsynaptic proteins in particular show relatively high counts in downregulated proteins in TL versus EU (F), in upregulated proteins in AL versus TL (G) and AL versus EU (H), and in ‘AL overshoot’ proteins (I). (J-M) Significant enrichment of synaptic SynGO terms was observed primarily in upregulated protein groups (AL vs TL, AL vs EU and ‘AL overshoot’; q < 0.05), and were predominantly postsynaptic in nature and associated with the postsynaptic density (PSD).
Figure 5
Figure 5
Torpor rescues memory deficits in APP/PS1 mice. (A) Torpor was induced in APP/PS1 mice. As controls, wildtype (Wt) and APP/PS1 mice were used that were refed to prevent torpor entry. All mice underwent fear conditioning on day 4 (d4) and context exposore on d5. On d6, they were tested in a novel context (NC). (B) Freezing levels were significantly diferent between groups (One-way ANOVA F2,34 = 4.646, p = 0.0164). Freezing levels were significantly lower in APP/PS1 control mice compared with wildtype control mice (14.3% ± 4.7% vs 30.7% ± 5.5%; post-hoc Fisher’s LSD; p = 0.030), confirming a memory impairment in APP/PS1 mice. Torpor rescued freezing in APP/PS1 mice up to wildtype levels (35.0% ± 4.7% vs 30.7% ± 5.5%; post-hoc Fisher’s LSD; p = 0.0063). Little freezing was observed in the NC (wildtype control: 21.3% ± 4.6%, APP/PS1 control 4.7% ± 2.0%, APP/PS1 torpor 8.5% ± 3.9%).

Similar articles

Cited by

References

    1. Carey HV, Andrews MT, Martin SL. Mammalian hibernation: Cellular and molecular responses to depressed metabolism and low temperature. Physiol. Rev. 2003;83(4):1153–1181. doi: 10.1152/physrev.00008.2003. - DOI - PubMed
    1. Ruf T, Geiser F. Daily torpor and hibernation in birds and mammals. Biol. Rev. 2015;90(3):891–926. doi: 10.1111/brv.12137. - DOI - PMC - PubMed
    1. Geiser F. Hibernation. Curr. Biol. 2013;23(5):R188–R193. doi: 10.1016/j.cub.2013.01.062. - DOI - PubMed
    1. Popov VI, Medvedev NI, Patrushev IV, Ignat’ev DA, Morenkov ED, Stewart MG. Reversible reduction in dendritic spines in CA1 of rat and ground squirrel subjected to hypothermia–normothermia in vivo: A three-dimensional electron microscope study. Neuroscience. 2007;149(3):549–560. doi: 10.1016/j.neuroscience.2007.07.059. - DOI - PubMed
    1. Bullmann T, Seeger G, Stieler J, Hanics J, Reimann K, Kretzschmann TP, et al. Tau phosphorylation-associated spine regression does not impair hippocampal-dependent memory in hibernating golden hamsters. Hippocampus. 2016;26(3):301–318. doi: 10.1002/hipo.22522. - DOI - PubMed