. 2021 Jul 29;4(1):927.
doi: 10.1038/s42003-021-02444-z.

Cryo-EM structures of inhibitory antibodies complexed with arginase 1 provide insight into mechanism of action

Affiliations

Cryo-EM structures of inhibitory antibodies complexed with arginase 1 provide insight into mechanism of action

Rachel L Palte et al. Commun Biol. .

Erratum in

Abstract

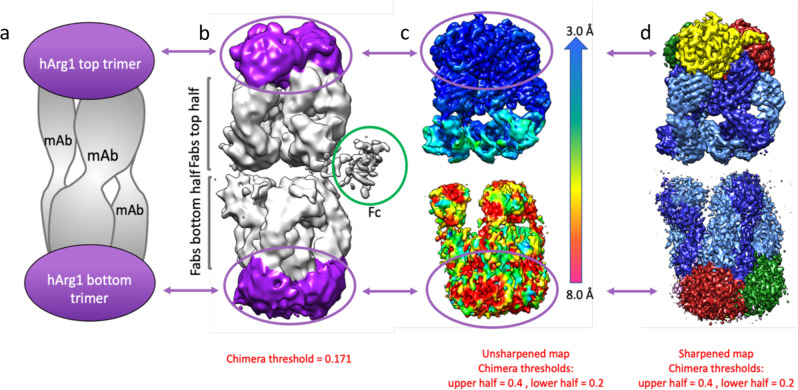
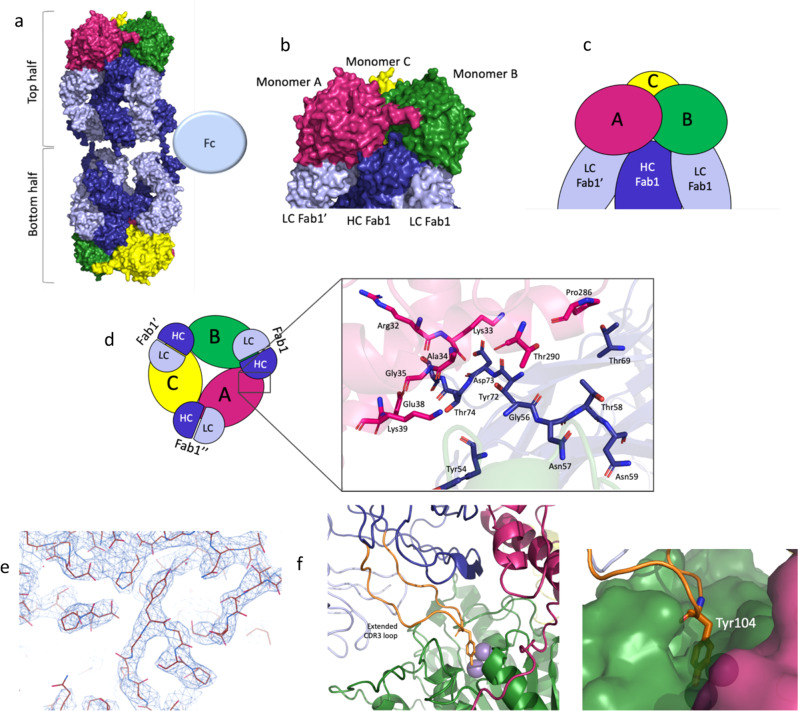
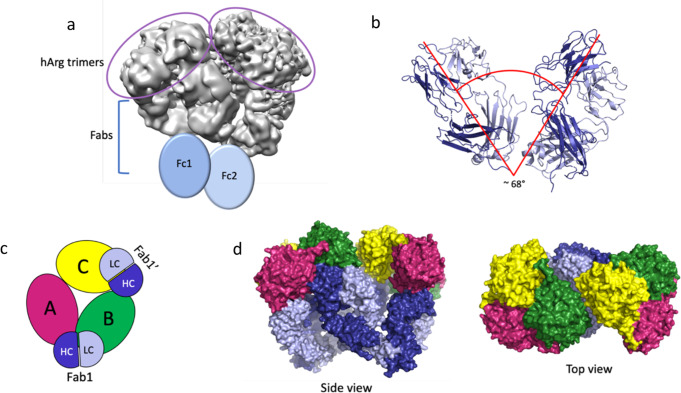
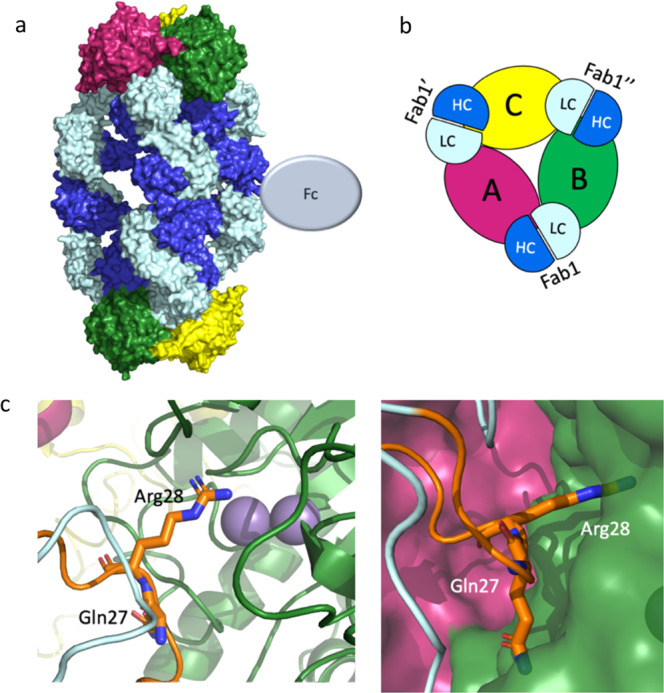
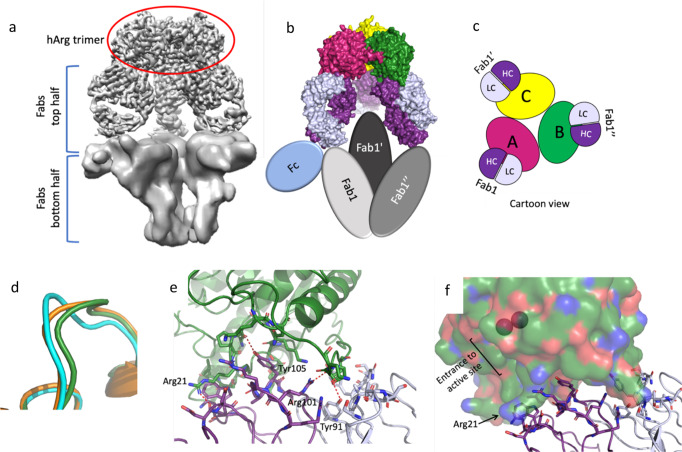
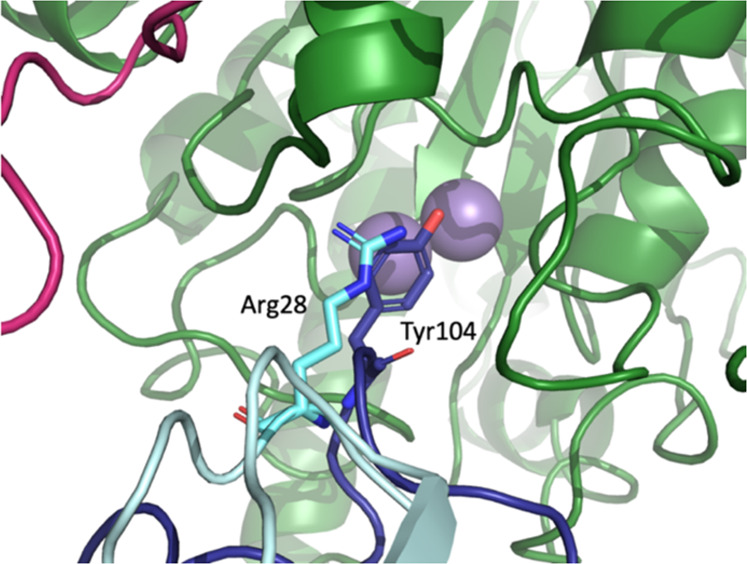
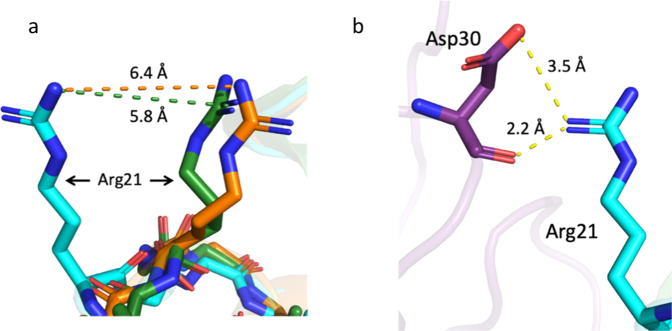
Human Arginase 1 (hArg1) is a metalloenzyme that catalyzes the hydrolysis of L-arginine to L-ornithine and urea, and modulates T-cell-mediated immune response. Arginase-targeted therapies have been pursued across several disease areas including immunology, oncology, nervous system dysfunction, and cardiovascular dysfunction and diseases. Currently, all published hArg1 inhibitors are small molecules usually less than 350 Da in size. Here we report the cryo-electron microscopy structures of potent and inhibitory anti-hArg antibodies bound to hArg1 which form distinct macromolecular complexes that are greater than 650 kDa. With local resolutions of 3.5 Å or better we unambiguously mapped epitopes and paratopes for all five antibodies and determined that the antibodies act through orthosteric and allosteric mechanisms. These hArg1:antibody complexes present an alternative mechanism to inhibit hArg1 activity and highlight the ability to utilize antibodies as probes in the discovery and development of peptide and small molecule inhibitors for enzymes in general.


Conflict of interest statement

Merck & Co., Inc., has filed provisional patent applications related to this paper. All authors are employees or former employees of Merck Sharp & Dohme Corp., a subsidiary of Merck & Co., Inc., Kenilworth, NJ, USA and may hold stock or stock options in Merck & Co., Inc., Kenilworth, NJ, USA.

Figures

Fig. 1
Fig. 1. Simple depiction and cryo-electron microscopy maps of the 2:3 hArg1:mAb1 complex.
a Most complexes presented in this paper consist of two hArg1 trimers on the top and bottom of the complex spanned by three full mAbs, giving the complex a sandwich-like appearance. b An exemplar map for the hArg1:antibody structures described in this paper, colored to match the first image. c A color shell based on local resolution is overlaid with an unsharpened map. It is apparent that the more highly-resolved top half of the complex is almost completely within the 3–4 Å range. It is likely that the bottom half is just as ordered, but its flexibility relative to the top half results in the seeming loss of resolution. The top half of each complex was used to map epitope and paratope interactions. d A sharpened map of the complex.
Fig. 2
Fig. 2. Epitope determination for mAb1, mAb2 and mAb3.
This panel shows an overview of how the large 2:3 hArg1:mAb1 complex assembles. The three monomers of the hArg1 trimer are colored in green, pink, and yellow, and the mAbs colored in dark blue (heavy chain) and light blue (light chain). a A surface representation of the full complexes. b A closeup view of mAb1’s interaction across two hArg1 monomers in surface representation. c A closeup view of the mAb1:hArg monomers in simplified cartoon representation. d The complex is viewed in a simplified cartoon form as viewed from the top. Each HC interacts with two hArg1 monomers while each LC interacts with only one hArg1 monomer; these interactions are symmetric around the trimer. A closeup view of the monomerA:HC surface interaction is provided. e A sample of the electron density at the hArg1:Fab interface is shown, highlighting the ability to confidently model all main chain and side chain atoms. f This class of mAbs are characterized by a very long CDR-3 loop (orange). Tyr104 (shown as sticks) extends into the hArg1 active site. The binuclear active site manganese ions are shown as purple spheres.
Fig. 3
Fig. 3. The mAb1 2:2 complex.
a The resulting EM maps allow for the identification of the two trimers and two sets of Fabs. As with the 2:3 complex, the Fcs were not visible but are added here to show their general location in this complex. b The angle between the two FABS is ~67o which is significantly smaller than the ~160o angle seen in the 2:3 complex. c An overview of how the 2:2 complex assembles with hArg1 monomers and the mAbs colored as in Fig. 2 is shown as a simplistic cartoon representation. Here it is apparent that that arrangement of the antibodies is quite asymmetric and only one monomer (monomer B here) makes all three mAb interactions (mAb1 LC and HC; and mAb2 HC) as seen in the 2:3 complex. d Two surface representations show both a side view and a top view of this 2:2 complex.
Fig. 4
Fig. 4. Overall complex formation and epitope mapping for mAb4 2:3 complex.
a An overview of the 2:3 hArg1:mAb4 complex assembly. The three monomers of the hArg1 trimer colored in green, pink, and yellow, and the mAbs colored in bright blue (heavy chain) and pale blue (light chain). The full complex is shown in surface representation. b Half of the complex in cartoon form is viewed from the top down for ease of interpretation. Here it is apparent that each HC interacts with only one hArg1 monomer, while each LC interacts with two hArg1 monomers. These interactions are symmetric around the trimer. c In this mAb, the CDR-1 loop of the LC (orange) is in close proximity to the hArg1 active site with Arg28 (sticks) extending into the binding pocket. Gln27 (sticks) occupies additional space on the outer surface of the active site. The binuclear active site manganese ions are shown as purple spheres.
Fig. 5
Fig. 5. Overall complex formation and epitope mapping for mAb5 1:3 complex.
a Density for the bottom half of the complex is almost completely absent. In masked maps at very low contour it is possible to visualize some density for the other Fabs and the Fcs, but the Fabs on the bottom half appear to be in a different conformation and closer to each other with no density for Arginase trimer present. b This panel shows an overview of how the 1:3 hArg1 to mAb5 complex assembles, with the three monomers of the hArg1 trimer colored in green, pink, and yellow, and the mAbs colored in dark purple (heavy chain) and pale purple (light chain). The protein surfaces are shown for the top half of the complex, and the bottom half Fabs and one Fc shown in colored ovals. c A depiction of the complex for ease of interpretation is shown. Each antibody interacts with only one hArg1 monomer and these interactions are symmetric around the trimer. d The loop containing residues Lys16-Val24 is shown for hArg1 bound to mAb5 antibody (cyan), hArg1 bound to mAb1 (green), and hArg1 bound to a small molecule (orange) are depicted. e Details of the interactions between the Fab and the hArg1 monomer are shown, with several residues involved in hydrogen bonding interactions labeled. f A surface view of one of the hArg1 monomers (green) shows that the active site is fully exposed in this complex. The binuclear active site manganese ions are shown as purple spheres.
Fig. 6
Fig. 6. Comparison of mAbs 1-3 and mAb4 epitopes.
A closeup view of the hArg1 active site reveals the differences in epitopes between mAbs 1-3 and mAb4. The CDR-3 HC Tyr104 of mAbs1-3 (dark blue) is replaced by the CDR-1 LC Arg28 in mAb4 (cyan). In both cases the hArg1 active site is completely blocked by the antibody.
Fig. 7
Fig. 7. Comparison of an hArg1 loop when bound to mAb5, mAb1 and small molecule-bound hArg1.
An overlay of the hArg1 loop containing residues Lys16-Val24 is shown in Fig. 5d. When bound to the mAb5 antibody, the positioning of this loop (cyan) is altered when compared to hArg1 bound to mAb1 (green) or hArg1 bound to a small molecule (orange). a A closeup of Arg21 in all three structures highlights the difference in orientation of Arg21 which moves outward by 5.8–6.4 Å. b Arg21 interacts with Asp30 of the mAb5 heavy chain, which sits ~2.2–3.5 Å away.

References

    1. Bronte V, Serafini P, Apolloni E, Zanovello P. Tumor-induced immune dysfunctions caused by myeloid suppressor cells. J. Immunother. 2001;24:431–446. - PubMed
    1. Kusmartsev S, Gabrilovich DI. Immature myeloid cells and cancer-associated immune suppression. Cancer Immunol. Immunother. 2002;51:293–298. - PMC - PubMed
    1. Serafini P, Borrello I, Bronte V. Myeloid suppressor cells in cancer: recruitment, phenotype, properties and mechanisms of immune suppression. Semin. Cancer Biol. 2006;16:53–65. - PubMed
    1. Kumar, V., Patel, S., Tcyganov, E. & Gabrilovich, D. I. The nature of myeloid-derived suppressor cells in the tumor microenvironment. Trends Immunol.37, 208–220 (2016). - PMC - PubMed
    1. Bronte V, Serafini P, Mazzoni A, Segal DM, Zanovello P. L-arginine metabolism in myeloid cells controls T-lymphocyte functions. Trends Immunol. 2003;24:301–305. - PubMed

Publication types