An official website of the United States government
The .gov means it’s official.
Federal government websites often end in .gov or .mil. Before
sharing sensitive information, make sure you’re on a federal
government site.
The site is secure.
The https:// ensures that you are connecting to the
official website and that any information you provide is encrypted
and transmitted securely.
1 Immunobiology Department, Yale University School of Medicine, New Haven, CT, USA.
2 Pediatric Genomics Discovery Program, Yale University School of Medicine, New Haven, CT, USA.
3 Department of Pediatrics, Yale University School of Medicine, New Haven, CT, USA.
4 SickKids Inflammatory Bowel Disease Center and Cell Biology Program, Research Institute, Hospital for Sick Children, Department of Pediatrics and Biochemistry, University of Toronto, Hospital for Sick Children, Toronto, ON, Canada.
5 Department of Pathology, Yale University School of Medicine, New Haven, CT, USA.
6 Department of Pediatrics, Division of Pediatric Infectious Diseases and Immunology, Erasmus University Medical Center, Rotterdam, the Netherlands.
7 Department of Clinical Genetics, Erasmus University Medical Center, Rotterdam, the Netherlands.
8 Department of Internal Medicine, Division of Clinical Immunology and Department of Immunology, Erasmus University Medical Center, Rotterdam, the Netherlands.
9 Immunobiology Department, Yale University School of Medicine, New Haven, CT, USA. Carrie.Lucas@yale.edu.
10 Pediatric Genomics Discovery Program, Yale University School of Medicine, New Haven, CT, USA. Carrie.Lucas@yale.edu.
Transcription factors specialized to limit the destructive potential of inflammatory immune cells remain ill-defined. We discovered loss-of-function variants in the X-linked ETS transcription factor gene ELF4 in multiple unrelated male patients with early onset mucosal autoinflammation and inflammatory bowel disease (IBD) characteristics, including fevers and ulcers that responded to interleukin-1 (IL-1), tumor necrosis factor or IL-12p40 blockade. Using cells from patients and newly generated mouse models, we uncovered ELF4-mutant macrophages having hyperinflammatory responses to a range of innate stimuli. In mouse macrophages, Elf4 both sustained the expression of anti-inflammatory genes, such as Il1rn, and limited the upregulation of inflammation amplifiers, including S100A8, Lcn2, Trem1 and neutrophil chemoattractants. Blockade of Trem1 reversed inflammation and intestine pathology after in vivo lipopolysaccharide challenge in mice carrying patient-derived variants in Elf4. Thus, ELF4 restrains inflammation and protects against mucosal disease, a discovery with broad translational relevance for human inflammatory disorders such as IBD.
Competing interests: S.A.L. is part owner of Qiyas Higher Health and Victory Genomics, startup companies unrelated to this work. All other authors declare no competing interests.
Figures
Extended Data Fig. 1. Extended DEX patient…
Extended Data Fig. 1. Extended DEX patient clinical and cellular findings and generation of Elf4 …
Extended Data Fig. 1. Extended DEX patient clinical and cellular findings and generation of Elf4 KO and W250S mice.
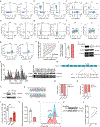
(a) NK cell, (b) NKT cell, (c) CD4+ and CD8+ T cell, (d) monocyte, (e) B cell, (f) CD4+ memory and naïve, and (g) CD8+ memory and naïve flow cytometric immunophenotyping for the indicated markers on PBMCs from a healthy donor (Ctrl) and patient A.1. (h) NK cytotoxicity assay using PBMCs from patient A.1 (red) compared to the normal range (grey shading). (i) Human IFNα ELISA in supernatants of LPS-stimulated PBMCs from healthy donors (n=3) and patient A.1 (n=1). (j) Western blot on THP1 lysates for ELF4. (k) Histogram of missense variants in the gnomAD dabase in ELF4 gene. (l) Western blot on 293T cells overexpressing variants of ELF4 (myc-tagged) reported in gnomAD. (m) Schematic of mouse Elf4. (n) Western blot for Elf4 in mouse thymus. (o) Sanger sequencing genotyping of W250S mice. (p) Relative allele usage of B.2 (X/W251S) PBMCs. (q) Relative allele usage (X/W250S) of mouse CD4+ or CD8+ cells (r) Percentage of perforin+ CD8+ T cells (WT n=6, W250S n=3, Elf4 KO n=3) 4 days with after anti-CD3 and anti-CD28. (s) Perforin gene expression in blasting CD8+ T cells isolated from healthy controls and patient A.1 determined by qRT-PCR (Ctrl n=3, A.1 n=1). (t) Histogram displaying perforin expression in NT and ELF4 CRISPR-edited human CD8+ T cells after 10 days of IL-2. (u) Western blot showing CRISPR deletion of ELF4 from human CD8+ T cells by CRISPR. (v) Perforin expression determined by flow cytometry at 24-hour time point following overexpression of myc-tagged W251S and WT ELF4 mRNA in patient A.1, B.1 (pink), and C.1 (red) CD8+ T cells. Data are presented as mean +/− S.E.M. with two-tailed unpaired t-test (r) or paired t-test (v) *p<0.05, **p<0.01, ***p<0.001, ****p<.0001, no marking indicates not significant.
Extended Data Fig. 2. Extended serum analyses…
Extended Data Fig. 2. Extended serum analyses in patient A.1.
Concentrations of the indicated cytokine…
Extended Data Fig. 2. Extended serum analyses in patient A.1.
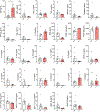
Concentrations of the indicated cytokine or chemokine in serum from independent blood draws of unrelated healthy controls (n = 4–6), patient A.1 (n = 3), mom (blue circles, n = 3), and dad (green circles, n = 1–3). Data from three independent experiments is presented as mean ± SEM. Statistical analysis was performed using two-tailed unpaired t-test. **p<0.01, no marking indicates not significant.
Extended Data Fig. 3. Extended data on…
Extended Data Fig. 3. Extended data on T cell differentiation and gene expression.
ELISA for…
Extended Data Fig. 3. Extended data on T cell differentiation and gene expression.
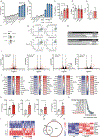
ELISA for IL-17A from human CD4+ cells (n=1). (b) ELISA for IL-17A from mouse CD4+ T cells (n=1). (n=1). (c) Mouse IL-17A ELISA following naïve CD4+ Th17 in vitro differentiation under non-pathogenic conditions (TGFβ + IL-6) WT n=3, W250S n=3, Elf4 KO n=3. (d-e) Percentage of mouse or human naïve CD4 T cells in spleen (WT n=3, W250S n=3, Elf4 KO n=3) or PBMC (Ctrl n=3, A.1 n=2), respectively. (f) Western blot of cytoplasmic (Cyto) and nuclear (Nuc) fractions of effector T cells. (g) Flow cytometry after treatment with anti-CD3 and anti-CD28 for 72 hours. (h) List of gene sets and pathways associated with the differentially expressed genes in Elf4 KO naïve CD4+ T cells. (i) Volcano plots of differentially expressed genes in Elf4 KO (1) or W250S (2) versus WT mouse naïve CD4+ T cells or W250S versus WT mouse in vitro differentiation Th17 cells after 48 hours under non-pathogenic (3) or pathogenic (4) conditions. (j) Top ten upregulated and downregulated genes in Elf4 KO or W250S CD4+ T cells. Values shown as log2(FC). (k) Naive CD4+ T cells differentiated in vitro to Th17 cells. (l) Heat map showing Z-score summary of naive CD4+ T cell ATAC-seq peak results filtered for genes with p-value < 0.01 and FC > 2. (m) Venn diagram displaying overlap between ATAC-seq peaks in Elf4KO and WT naive CD4+ T cells. (n) Heatmap displaying genes involved in chromatin regulation that were differentially expressed by RNAseq (WT vs Elf4 KO) and also display differences in accessibility by ATACseq. (o) Reanalysis of DICE database 45. ELISA data are from a minimum of three experiments, each dot representing one ELISA well with two wells/technical replicates per sample. A minimum of n=3 mice (biological replicates) was used for each genotype in mouse experiments. DEX patient samples represent blood from the same patient at different times. Data are presented as mean ± S.E.M. with two-tailed unpaired t-test *p<0.05, **p<0.01, ***p<0.001, ****p<.0001, no marking indicates not significant.
Extended Data Fig. 4. Extended data on…
Extended Data Fig. 4. Extended data on monocyte/macrophage cellular responses.
Indicated cytokine measured in culture…
Extended Data Fig. 4. Extended data on monocyte/macrophage cellular responses.
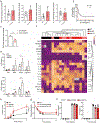
Indicated cytokine measured in culture supernatants from LPS-stimulated human PBMCs. Data are combined from two independent experiments (patient A.1 vs 5 controls, and patient B.1 vs 5 controls) and expressed as fold change of patient values normalized to the average of the controls (n=13 healthy controls, n=2 A.1 independent experiments, n=1 B.1 experiment). (b) PBMCs from patient A.1 and a healthy donor control were treated with LPS alone or LPS and a titration of IL-10 for 12 hours, and IL-6 was measured in culture supernatants (n=1 patient and n=1 healthy donor control). (c) RT-PCR analysis of ELF4 gene expression in monocyte-derived macrophages from healthy donors after CRISPR targeting (NT: non-targeting gRNA, ELF4: ELF4 gRNA). (d) IL-6 and CXCL1 measured in culture supernatants from 24hrs MDP/PolyIC/β-glucan-stimulated BMDMs isolated from Elf4 KO, W250S, or WT mice. (e) Endotoxic shock was induced in groups of male WT and age-matched Elf4 KO and W250S mice by i.p. injection of 2 mg/kg ultra-pure (UP) LPS. Animals were scored for 0h, 2h, 4h, 6h and 16 h after LPS injection. (f) Concentrations of the indicated cytokine or chemokine in mouse serum 4 hr after i.p. LPS challenge. Analytes in red are significantly different between genotypes. (g) Endotoxic shock was induced in groups of female WT (n=3) and age-matched heterozygous females (Elf4 KO n=3 and W250S n=3) by i.p. injection of 2 mg/kg ultra-pure (UP) LPS. (h) Concentrations of the indicated cytokine or chemokine in mouse serum 4 hr after i.p. LPS challenge described in (G). Data are representative of three independent experiments and presented as mean ± SD. Statistical analysis was performed using two-tailed unpaired t-test. *p<0.05, **p<0.01, ***/###p<0.001, ****p<0.0001, no marking indicates not significant.
Extended Data Fig. 5. Extended data on…
Extended Data Fig. 5. Extended data on macrophage gene expression and responses to Trem1 blockade.
(a-c) Volcano plots (-log10(FDR) vs fold change) of differentially expressed genes in Elf4 KO versus WT mouse BMDMs as indicated. (d-f) Heatmaps highlighting top 10 differentially expressed genes at each timepoint above. (g-h) RT-PCR for Il10 and Il1rn in WT, Elf4 KO, or Elf4 W250S BMDMs at 16 hours after stimulation with LPS. For (g), (h), (k), and (l) n=3 wt and n=3 W250S mutant mice per group. (i) IL1RN reporter data as in Figure 5C but with three individual GGAA sites mutated to AAAA to assess the contribution of each to ELF4-driven transcriptional activation of IL1RN reporter, n=1 experimental replicate, representative of three independent experiments, ±SD. (j) ChIP-sequencing traces for Elf4 bound near the indicated gene in mouse BMDM without (−) and with (+) 4 hr LPS stimulation. (k-l) RT-PCR for S100a8 and Trem1 in WT, Elf4 KO, or Elf4 W250S BMDMs at 4 hours after stimulation with LPS. (m) Functionally enriched gene ontology and KEGG pathways of upregulated differentially expressed genes in Elf4 KO compared to WT BMDMs 16 hrs after LPS stimulation. (n-p) IL-6, IL-12p70, and IL-23 measured in culture supernatants at 24 hours after stimulation of indicated BMDMs with LPS or LPS and Trem1-Fc (n=5/group). (q) Endotoxic shock clinical score 16 hours after treatment (n=8,7 WT/WT+Trem1-Fc; n=3,4 Elf4 KO/Elf4 KO+Trem1 Fc; n=5,4 W250S/W250S+Trem1 Fc). (r) CXCL1 was measured in mouse serum at 4 hr after in vivo LPS challenge with the treatments indicated in (Q). Data are representative of three independent experiments and presented as mean ± SD. Statistical analysis was performed using two-tailed unpaired t-test. *p<0.05, **p<0.01, ***p<0.001, ****p<0.0001, no marking indicates not significant.
Figure 1.. Loss-of-function variants in ELF4 identified…
Figure 1.. Loss-of-function variants in ELF4 identified in males with X-linked autoinflammatory disease.
( a …
Figure 1.. Loss-of-function variants in ELF4 identified in males with X-linked autoinflammatory disease.
(a) Three families with ELF4 gene variants in affected males. wt: wild-type/reference; red W251S or A339fs variants; X: X chromosome; Y: Y chromosome. (b) Sanger sequence reads demonstrating locations of the variants. (c) Amino acid sequence alignment of ETS domains across species. Arrow indicates position of W251S variant. (d) Structure of ETS domain in complex with DNA (PDB 1K79 ) highlighting positioning of the residue analogous to human ELF4 W251S. (e) CADD scores versus minor allele frequency for the novel W251S patient-derived ELF4 variant compared to ELF4 variants present in males with MAF cutoff of >10−4 from the gnomAD database. f) qRT-PCR analysis of ELF4 mRNA relative to GAPDH in PBMC samples from indicated subjects (n=3 patients with ELF4 variants and n=12 healthy donor controls) ±SD. Pink indicates W250S ELF4 variant, while red indicates frameshift/knockout. (g) Immunoblot for ELF4 in expanded T cell blasts from indicated subjects. ‘Loading’ indicates band from stain-free total protein imaging. (h) Activity of ELF4 variants (protein change indicated) from (e) and patient-derived variants ectopically overexpressed in 293T cells co-transfected with a transcriptional luciferase reporter as in, data are shown as one representative of three independent experiments, ±SD. . Statistical analyses were performed using two-tailed unpaired T-test. *p<0.05, **p<0.01, ***p<0.001, ****p<0.0001, no marking indicates not significant.
Figure 2.. Inflammation in vivo and clinical…
Figure 2.. Inflammation in vivo and clinical response to anakinra.
( a ) H&E micrograph…
Figure 2.. Inflammation in vivo and clinical response to anakinra.
(a) H&E micrograph of right colon of patient A.1 showing active colitis with crypt abscesses and ulceration. Scale bar: 50 μm. (b) H&E micrograph of cheek ulcer in patient B.1. Scale bar: 50 μm. (c) CXCL1 fold change in serum from independent blood draws of patient A.1 (n = 3), patient C.1 (n=2), unrelated healthy controls (n = 6), A.1 mom (blue circles, n = 3), and A.1 dad (green circles, n = 3). Data from three independent experiments is presented as mean ± SEM. Statistical analysis used two-tailed unpaired T-test. (d) Calprotectin (S100A8/S100A9 complex) measured in stool by ELISA from five independent samples of patient A.1 compared to five healthy donor controls ±SD. (e) Percentage of neutrophils from total white blood cells in patient A.1 pre- and post-anakinra (n=1 patient before and after treatment). (f) Serum CRP levels in patient A.1 shown over time. Red dotted line represents upper limit of normal levels. Data from three independent experiments is presented as mean ± SD. (g-k) Colitis was induced in groups of male WT (n=18) and age-matched Elf4 KO (n=13) and W250S (n=13) mice with 2% DSS for 7 days and harvested. (g) H&E micrograph of mouse colon. Scale bar: 50 μm. (h) Histological damage score from H&E images. (i) Splenocyte count. (j) Percentage of CD4+ IL-2-producing splenic T cells. (k) Percentage of CD11b+Ly6G+ myeloid cells among CD45+ cells in the colon. Data from three independent experiments is presented as mean ± SD with two-tailed unpaired T-test. *p<0.05, **p<0.01, ***p<0.001, ****p<0.0001, no marking indicates not significant.
Figure 3.. ELF4 deficiency augments T H …
Figure 3.. ELF4 deficiency augments T H 17 cell responses in situ , in vitro …
Figure 3.. ELF4 deficiency augments TH17 cell responses in situ, in vitro, and in vivo.
(a) Immunofluorescence staining of RORγT (green) and IL-17 (red) in healthy control, IBD, and patient A.1 and B.1 colons. (b) RORγT and (c) IL-17quantifications of staining in healthy control (white), IBD (blue), and patients A.1 and B.1 (pink). (d) Human IL-17A ELISA on patient A.1 (n=3) and healthy controls (n=6) after naïve CD4 TH17 in vitro differentiation (IL-1 β and IL-23) for 7 days (e) Mouse IL-17A ELISA on naïve CD4 cells from WT (n=6), W250S (n=3), and Elf4 KO (n=3) littermates cultured under in vitro TH17 conditions (IL-1β, IL-23, and IL-6) for 4 days. (f) IL-17A+ frequency of splenic CD4+ T cells from WT (n = 16), KO (n=12), and W250S mice (n=8) after 5 days of anti-CD3. (g) Gene set enrichment analysis of Elf4-deficient naïve mouse CD4 T cells for enrichment in ‘regulation of inflammatory response’ (GO:0050727). Each black line represents 1 gene (387 total, from GSE175569). (h) Heatmap of key DEGs in WT vs. W250S mice TH17 cells differentiated in vitro ranked by p-value with most significant at bottom. Red and blue indicate extent of upregulation and downregulation, respectively (from GSE175569). (i) Gene ontology enrichment in genes upregulated by Elf4 at 48 hr of TH17 in vitro differentiation (from GSE175569). ELISA data are from a minimum of three experiments, each dot representing one ELISA well with two wells/technical replicates per sample. A minimum of n=3 mice (biological replicates) was used for each genotype in mouse experiments. DEX patient samples represent blood from the same patient at different times. Data are presented as mean +/− S.E.M. with two-tailed unpaired t-test *p<0.05, **p<0.01, ***p<0.001, ****p<.0001, no marking indicates not significant.
Figure 4.. Innate inflammatory responses to PRR…
Figure 4.. Innate inflammatory responses to PRR stimulation are augmented in vitro and in vivo …
Figure 4.. Innate inflammatory responses to PRR stimulation are augmented in vitro and in vivo.
(a) IL-1β and IL-6 measured in culture supernatants from LPS-stimulated PBMCs. Data are combined from two independent experiments (two patient A.1 blood draws vs 3–5 controls, and patient B.1 vs 5 controls) and expressed as fold change of patient values normalized to the average of the controls (n=13 healthy donor controls and n=3 patients). (b) Intracellular IL-12p40 staining by flow cytometry in gated monocytes after LPS stimulation of PBMCs for 24 hrs (including 6 hr with monensin), data shown for patient A.1 with three independent blod draws (n=3) compared to n=10 healthy donor controls. (c) IL-1β and CXCL1 measured in culture supernatants from 24hrs LPS-stimulated human macrophages; NT: non-targeting gRNA, ELF4: ELF4 gRNA). Two-tailed paired t-test. (d) IL-1β, IL-6, IL12p70, IL-23 and CXCL1 measured in culture supernatants from 24hrs LPS-stimulated BMDMs isolated from W250S and WT mice. (e-f) IL-1β and IL-23 measured in culture supernatants from 24hrs MDP/PolyIC/β-glucan-stimulated BMDMs isolated from Elf4 KO and WT mice. (g) Endotoxic shock was induced in groups of male WT (n=9) and age-matched Elf4 KO (n=6) and W250S (n=9) mice by i.p. injection of 2 mg/kg ultra-pure LPS. Body temperature was monitored for 16 h after LPS injection. Data are representative of two independent experiments. (h) Differential abundance of the indicated cytokine in serum from LPS-treated mice at 4 hr after challenge, depicting Z-scores. (i) Concentrations of the indicated cytokine in serum from LPS-treated mice at 24 hr timepoint. Data from three independent experiments is presented as mean ± SD with two-tailed unpaired t-test, *p<0.05, **p<0.01, ***/###p<0.001, ****p<.0001, no marking indicates not significant.
Figure 5.. Elf4 in macrophages regulates anti-…
Figure 5.. Elf4 in macrophages regulates anti- and pro-inflammatory genes including Trem1.
( a )…
Figure 5.. Elf4 in macrophages regulates anti- and pro-inflammatory genes including Trem1.
(a) Heatmap of genes low in Elf4 KO BMDMs 16 hours after LPS. Reanalysis of ChIP sequencing data from , baseline or 4 hours after LPS. (b) RT-PCR for Il1rn in mouse BMDMs after LPS with data normalized to average values of WT at each time point using ΔΔCt method, n=4 independent mice per group. (c) Human ELF4 acts on cis-regulatory sequences upstream of the secreted IL1RN transcription start site, as measured by luciferase reporter in 293 cells (data shown are one representative of three independent experiments ±SD).. (d) Heatmap of genes elevated in Elf4 KO BMDMs 4 hours after LPS (n=3 WT, n=3 Elf4 KO mice). Reanalysis of ChIP sequencing data as in (a). (e) RT-PCR for Trem1 in mouse BMDMs after stimulation with LPS at time points given. Data are normalized as in (b). (f) Flow cytometric analysis of surface Trem1 on mouse BMDMs 24 hr after LPS stimulation in vitro, n=4 mice per group. (g) IL-1β and CXCL1 measured in culture supernatants from 24hrs LPS or LPS and Trem1-Fc-stimulated BMDMs isolated from W250S (n=5) and WT(n=5) mice. (h) Body temperature after endotoxic shock was induced in groups of male WT (n=8) and age-matched Elf4 KO (n=3) and W250S (n=5) mice by i.p. injection of 2 mg/kg LPS. Additional groups of mice (n=7 WT; n=4 Elf4 KO; n=4 W250S) received Trem1-Fc (0.25 mg/kg, i.p.) one hour after LPS injection. (i) IL-1β was measured in mouse serum at 4 hr timepoint. (j) Small intestine H&E stain for indicated genotypes and in vivo challenges. Scale bar: 50 μm. Data are presented as mean +/− SD with two-tailed unpaired t-test, *p<0.05, **p<0.01, ***p<0.001, ****p<.0001, no marking indicates not significant.
Bousfiha A et al. Human Inborn Errors of Immunity: 2019 Update of the IUIS Phenotypical Classification. J Clin Immunol 40, 66–81, doi:10.1007/s10875-020-00758-x (2020).
-
DOI
-
PMC
-
PubMed
Tangye SG et al. Human Inborn Errors of Immunity: 2019 Update on the Classification from the International Union of Immunological Societies Expert Committee. J Clin Immunol 40, 24–64, doi:10.1007/s10875-019-00737-x (2020).
-
DOI
-
PMC
-
PubMed
Adzhubei IA et al. A method and server for predicting damaging missense mutations. Nat Methods 7, 248–249, doi:10.1038/nmeth0410-248 (2010).
-
DOI
-
PMC
-
PubMed
Karczewski KJ et al. The mutational constraint spectrum quantified from variation in 141,456 humans. Nature 581, 434–443, doi:10.1038/s41586-020-2308-7 (2020).
-
DOI
-
PMC
-
PubMed
Rentzsch P, Witten D, Cooper GM, Shendure J & Kircher M CADD: predicting the deleteriousness of variants throughout the human genome. Nucleic acids research 47, D886–D894, doi:10.1093/nar/gky1016 (2019).
-
DOI
-
PMC
-
PubMed