. 2021 Jun 22;17(10):2590-2605.
doi: 10.7150/ijbs.58886. eCollection 2021.

Single-cell transcriptomics reveals heterogeneous progression and EGFR activation in pancreatic adenosquamous carcinoma

Affiliations

Single-cell transcriptomics reveals heterogeneous progression and EGFR activation in pancreatic adenosquamous carcinoma

Xin Zhao et al. Int J Biol Sci. .

Abstract

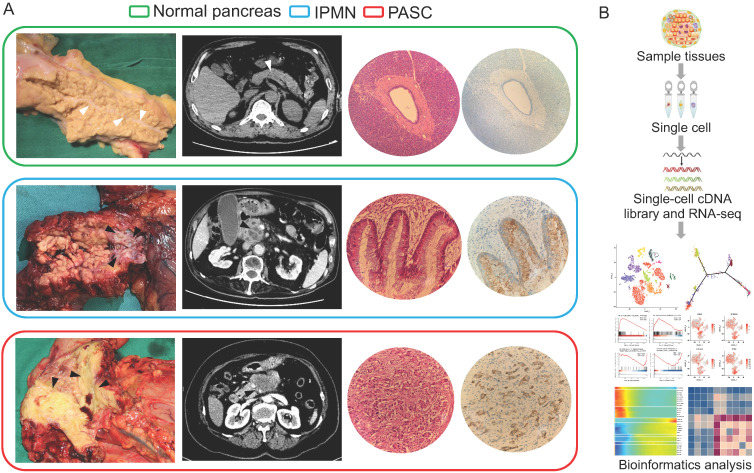
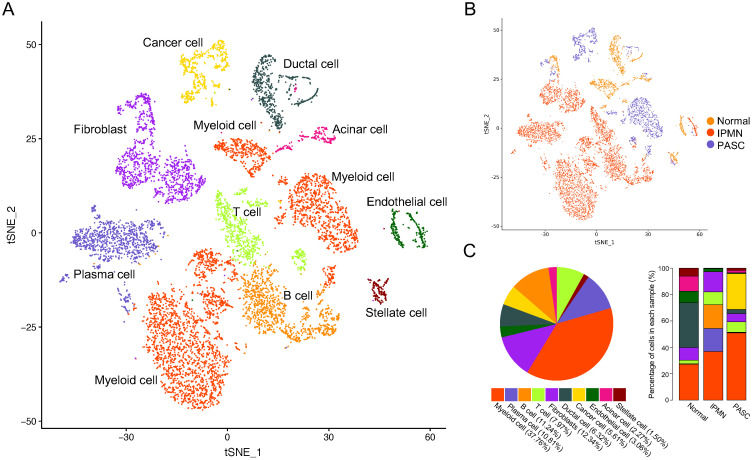
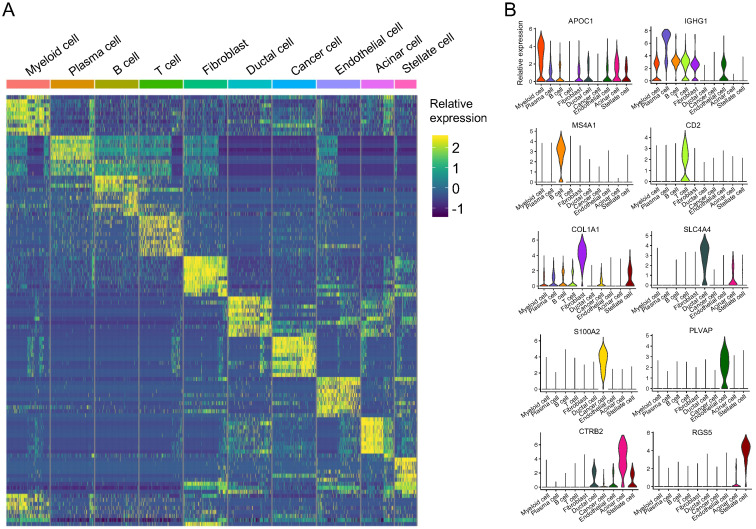
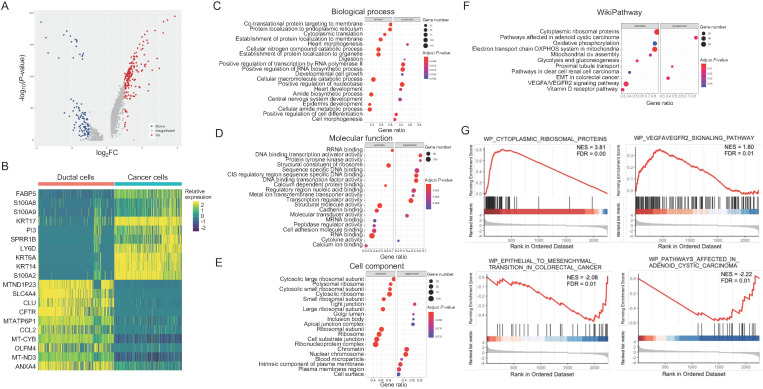
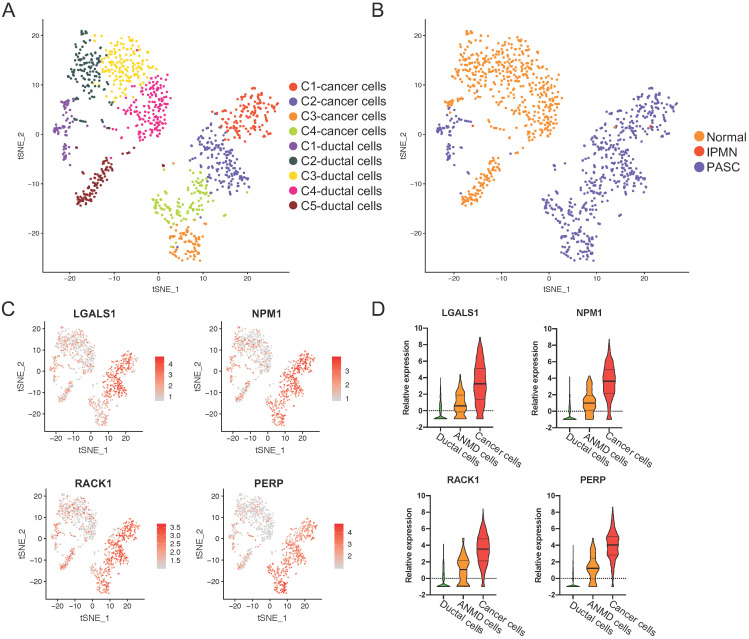
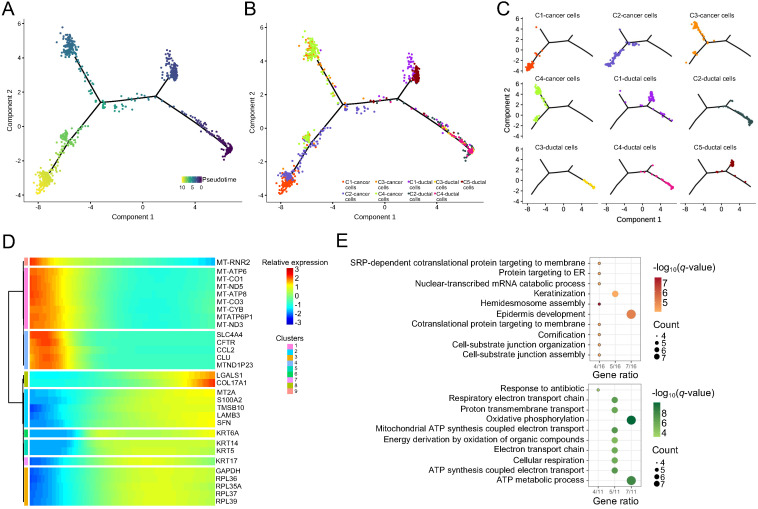
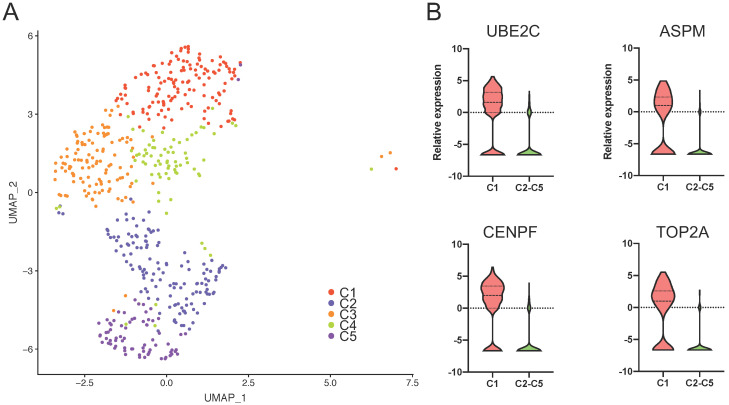
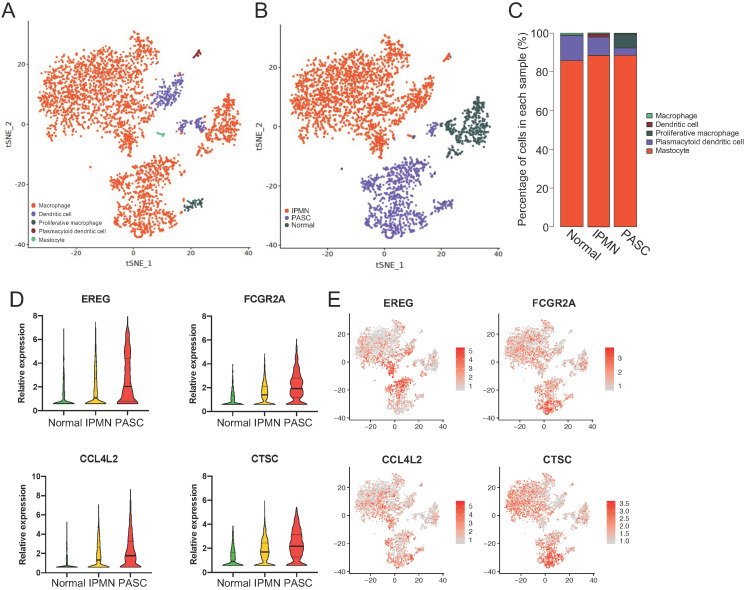
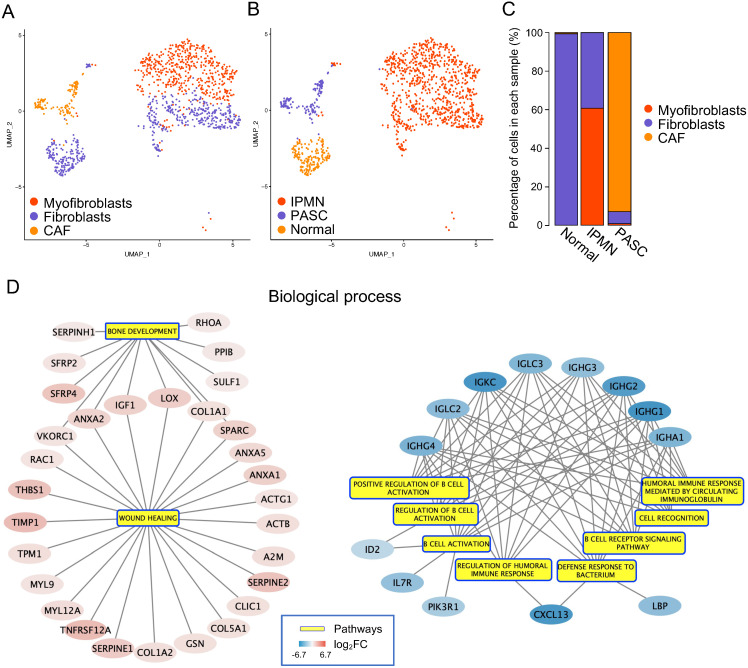
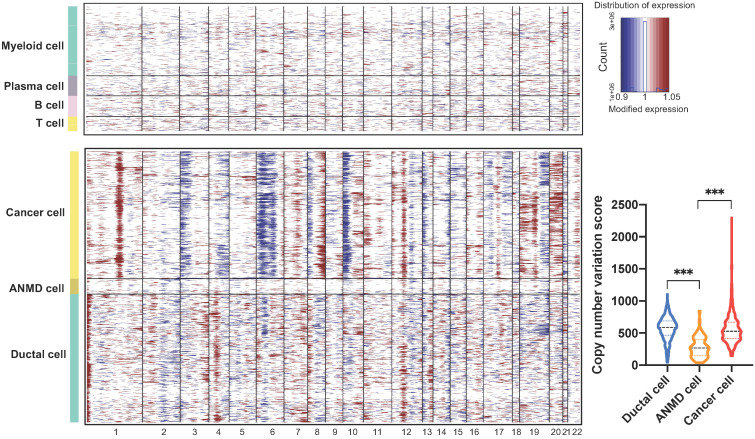
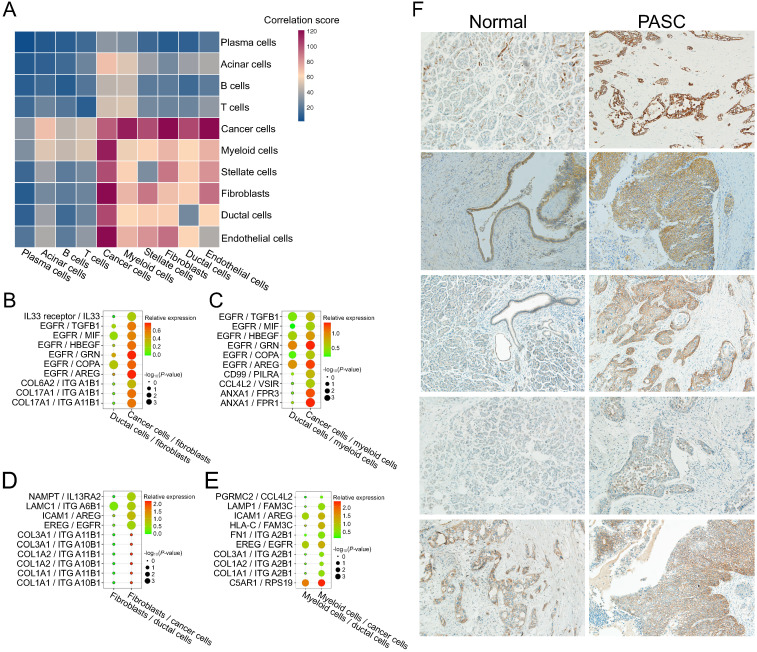
Pancreatic adenosquamous carcinoma (PASC) - a rare pathological pancreatic cancer (PC) type - has a poor prognosis due to high malignancy. To examine the heterogeneity of PASC, we performed single-cell RNA sequencing (scRNA-seq) profiling with sample tissues from a healthy donor pancreas, an intraductal papillary mucinous neoplasm, and a patient with PASC. Of 9,887 individual cells, ten cell subpopulations were identified, including myeloid, immune, ductal, fibroblast, acinar, stellate, endothelial, and cancer cells. Cancer cells were divided into five clusters. Notably, cluster 1 exhibited stem-like phenotypes expressing UBE2C, ASPM, and TOP2A. We found that S100A2 is a potential biomarker for cancer cells. LGALS1, NPM1, RACK1, and PERP were upregulated from ductal to cancer cells. Furthermore, the copy number variations in ductal and cancer cells were greater than in the reference cells. The expression of EREG, FCGR2A, CCL4L2, and CTSC increased in myeloid cells from the normal pancreas to PASC. The gene sets expressed by cancer-associated fibroblasts were enriched in the immunosuppressive pathways. We demonstrate that EGFR-associated ligand-receptor pairs are activated in ductal-stromal cell communications. Hence, this study revealed the heterogeneous variations of ductal and stromal cells, defined cancer-associated signaling pathways, and deciphered intercellular interactions following PASC progression.

Keywords: cell-cell communication; heterogeneity; intraductal papillary mucinous neoplasm; pancreatic adenosquamous carcinoma; pancreatic cancer; single-cell RNA sequencing.


Conflict of interest statement

Competing Interests: The authors have declared that no competing interest exists.

Figures

Figure 1
Figure 1
Clinicopathological manifestations of the normal pancreas, IPMN, and PASC samples. (A) Gross specimens, axial computerized tomography images, hematoxylin-eosin images, and immunohistochemical staining of the normal pancreas (top), IPMN (middle), and PASC (bottom; 200×). White triangles indicate the main pancreatic duct of the normal pancreas, and the black triangles indicate the tumors of IPMN and PASC. (B) Single-cell RNA-seq workflow and subsequent bioinformatics analysis.
Figure 2
Figure 2
A total of 9,887 single cells were clustered into ten subgroups based on scRNA-seq. (A) tSNE plot showing ten cell types in tissues of the normal pancreas, IPMN, and PASC. (B) Cell distribution across three pancreatic samples. (C) Percentage of cell types in the whole (left) and parts of pancreatic specimen (right).
Figure 3
Figure 3
scRNA-seq demonstrating specific cell subpopulation markers. (A) Heatmap of top ten differentially expressed genes in each cell type. (B) Violin plot showing distinct markers of ten cell clusters.
Figure 4
Figure 4
Functions of DEGs between pancreatic ductal and PASC cells. (A) and (B) Volcano plot and heatmap showing the DEGs of PASC cells. (C-E) Gene Ontology annotations for DEGs based on GSEA. (F) Pathway enrichment analyses for DEGs based on WikiPathways gene sets. (G) In cancer cells, upregulated genes were associated with “cytoplasmic ribosomal proteins” and “VEGFA/VEGFR2” signaling pathways, while downregulated genes were correlated with “EMT” and “adenoid cystic carcinoma” pathways.
Figure 5
Figure 5
The upregulated genes across ductal, adjacent nonmalignant, and PASC cells. (A) tSNE plot showing four cancer cell clusters and five duct-cell clusters. (B) Total cell distribution suggesting that C1 of ductal cells is derived from the adjacent normal tissue in PASC. (C) tSNE plot showing the expression level and distribution of LGALS1, NPM1, RACK1, and PERP in ductal and PASC cells. The red bar indicates relative gene expression level. (D) The relative expression levels of LGALS1, NPM1, RACK1, and PERP in ductal, adjacent nonmalignant ductal (ANMD), and cancer cells. Data are presented as mean ± SD.
Figure 6
Figure 6
Pseudotime analyses of ductal and PASC cells. (A) Trajectory charts showing the differential stages of ductal and cancer cells (dark and light colors indicate early and late stages, respectively). (B) and (C) Four cancer cell clusters and five duct-cell clusters matching the trajectory chart. (D) Differential gene expression panel from ductal to cancer cells. (E) The biological process of upregulated (up) and downregulated (down) gene sets in PASC progression.
Figure 7
Figure 7
The marker genes of stem-like cancer cells within PASC. (A) tSNE plot showing five distinct cell types from PASC. (B) UBE2C, ASPM, CENPF, and TOP2A were highly expressed in stem-like cancer cells (C1) compared with the other clusters.
Figure 8
Figure 8
The upregulated genes of myeloid cells across the normal pancreas, IPMN, and PASC. (A) tSNE plots identifying five myeloid cell subgroups. (B) and (C) The distribution and percentage of each cell subset within myeloid cells. (D) and (E) The expression of EREG, FCGR2A, CCL4L2, and CTSC increases from the normal pancreas to PASC.
Figure 9
Figure 9
Functions of cancer-associated fibroblasts in PASC. (A) tSNE plot showing fibroblasts, myofibroblasts, and CAFs. (B) and (C) The distribution and percentage of each fibroblast subgroup. (D) The biological process of DEGs between CAFs and fibroblasts (left: upregulated gene set; right: downregulated gene set).
Figure 10
Figure 10
Copy number variation profiles of ductal, adjacent nonmalignant, and PASC cells. Large-scale CNVs of reference cells including myeloid, plasma, B, and T cells (top); PASC, adjacent nonmalignant ductal (ANMD), and ductal cells (bottom). The red and blue colors represent high and low CNV scores, respectively. The CNV levels of PASC and ductal cells exceed that of ANMD cells (low right). ***P < 0.001. Data are presented as mean ± SD.
Figure 11
Figure 11
Cell-cell communication between stromal and PASC cells. (A) Heatmap exhibiting cell-cell communication scores. Dark red and blue colors represent high and low levels of interactional intensity, respectively. Activated intercellular signaling between fibroblasts and cancer cells (B), myeloid cells and cancer cells (C), fibroblasts and cancer cells (D), and myeloid cells and cancer cells (E) compared with ductal cells. (F) EGFR immunohistochemical staining of five paired PASC tissues. (200×)

References

    1. Kleeff J, Korc M, Apte M. et al. Pancreatic cancer. Nat Rev Dis Primers. 2016;2:16022. - PubMed
    1. Hester CA, Augustine MM, Choti MA. et al. Comparative outcomes of adenosquamous carcinoma of the pancreas: An analysis of the National Cancer Database. J Surg Oncol. 2018;118(1):21–30. - PubMed
    1. Boecker J, Feyerabend B, Tiemann K. et al. Adenosquamous Carcinoma of the Pancreas Comprise a Heterogeneous Group of Tumors With the Worst Outcome: A Clinicopathological Analysis of 25 Cases Identified in 562 Pancreatic Carcinomas Resected With Curative Intent. Pancreas. 2020;49(5):683–91. - PubMed
    1. Fang Y, Su Z, Xie J. et al. Genomic signatures of pancreatic adenosquamous carcinoma (PASC) J Pathol. 2017;243(2):155–9. - PubMed
    1. Brody JR, Costantino CL, Potoczek M. et al. Adenosquamous carcinoma of the pancreas harbors KRAS2, DPC4 and TP53 molecular alterations similar to pancreatic ductal adenocarcinoma. Mod Pathol. 2009;22(5):651–9. - PubMed

Publication types

MeSH terms