. 2021 Jul 12:8:648603.
doi: 10.3389/fmolb.2021.648603. eCollection 2021.

Small Molecule Microcrystal Electron Diffraction for the Pharmaceutical Industry-Lessons Learned From Examining Over Fifty Samples

Affiliations

Small Molecule Microcrystal Electron Diffraction for the Pharmaceutical Industry-Lessons Learned From Examining Over Fifty Samples

Jessica F Bruhn et al. Front Mol Biosci. .

Abstract

The emerging field of microcrystal electron diffraction (MicroED) is of great interest to industrial researchers working in the drug discovery and drug development space. The promise of being able to routinely solve high-resolution crystal structures without the need to grow large crystals is very appealing. Despite MicroED's exciting potential, adoption across the pharmaceutical industry has been slow, primarily owing to a lack of access to specialized equipment and expertise. Here we present our experience building a small molecule MicroED service pipeline for members of the pharmaceutical industry. In the past year, we have examined more than fifty small molecule samples submitted by our clients, the majority of which have yielded data suitable for structure solution. We also detail our experience determining small molecule MicroED structures of pharmaceutical interest and offer some insights into the typical experimental outcomes. This experience has led us to conclude that small molecule MicroED adoption will continue to grow within the pharmaceutical industry where it is able to rapidly provide structures inaccessible by other methods.

Keywords: MicroED; crystallography; drug development; electron diffraction (ED); medicinal chemistry; small molecule; structure; transmission elections microscopy.


Conflict of interest statement

JB, GS, AC, TG, SD, BR, TN, KL, MMy, NC, NP, PM, TW, MMs, CH, ST, CP, and BC are or have been employed by NanoImaging Services, a commercial supplier of electron microscopy services to the biopharmaceutical and biotechnology industries. BW is employed by the company Biogen. The remaining authors declare that the research was conducted in the absence of any commercial or financial relationships that could be construed as a potential conflict of interest.

Figures

FIGURE 1
FIGURE 1
(A) Cartoon depiction of the differences between small molecule and protein microcrystal electron diffraction (MicroED). First, protein crystals are grown in aqueous conditions and must be kept hydrated during grid preparation, whereas small molecule crystals are typically dry and can be directly applied to the grid without the need for sophisticated grid vitrification protocols. Second, small molecule crystals are composed of many small unit cells while protein crystals contain fewer, larger unit cells per crystal volume. Because of this, higher doses are typically needed for protein samples to generate diffraction spots of similar intensities. (B) The growth of unique structure depositions by year in the Protein Data Bank (PDB) and Cambridge Structural Database (CSD) determined by MicroED or related 3D electron diffraction techniques. Depositions into the PDB are broken up into proteins and peptides. Proteins were defined as having more than 50 amino acids.
FIGURE 2
FIGURE 2
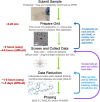
The general workflow pipeline at NIS with typical times given for easy and difficult cases. At the screening and data collection stage, an “easy” target has many crystals that all diffract to high resolution (≤1.1 Å), while a “difficult” target may be much more heterogeneous in terms of diffraction quality and/or may have been flagged as “difficult” if processing the first couple of datasets revealed problematic features (low resolution, radiation damages and/or low completeness upon merging datasets). Data processing, encompassing both data reduction and phasing, is a very iterative process where many data reduction strategies are typically employed before successful phasing can be achieved.
FIGURE 3
FIGURE 3
(A) An image of a client sample (left) and its diffraction pattern (right). The area targeted is indicated by a red circle showing the approximate beam diameter. Note the grainy background material and poor diffraction. (B) This grid was removed from the microscope and subsequently heated to 50°C for 10 minutes prior to re-freezing in liquid nitrogen. An image (left) and its diffraction pattern (right) are shown. Note the disappearance of the grainy background material and the improved diffraction pattern. We also note that the MicroED structure determined from these crystals matches the experimentally collected XRPD pattern and therefore we do not believe that heating caused a form change in this case.
FIGURE 4
FIGURE 4
Structures determined by NIS as internal controls (A–C) and as a proof of concept for a more challenging sample (D). For each panel, an image of a targeted crystal is shown with the beam diameter shown as a red circle, along with an exemplary diffraction image with overlaid resolution rings. Below this, the 2D structure is shown alongside the MicroED structure with atoms displayed as thermal ellipsoids. Note that no distinction is made between single or double bonds in the thermal ellipsoid image. The common name and chemical formula are also given.
FIGURE 5
FIGURE 5
Sample characteristics for internal samples (progesterone, biotin, paracetamol, and teniposide) and a subset of client samples for which these data were known. (A) The range of sample sizes examined in terms of molecular weight and the number of non-hydrogen atoms (e.g., teniposide, C32H32O13S, has 46 non-hydrogen atoms). (B) The distribution of samples containing only light atoms (carbon, nitrogen, oxygen, and/or hydrogen) and those with at least one heavy atom (anything with an element having an atomic number larger than oxygen, such as sulfur, phosphorous, or chlorine), which can make phasing by ab initio methods much easier.
FIGURE 6
FIGURE 6
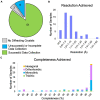
(A) The outcome of MicroED data collection at NIS for client and internal samples (progesterone, biotin, paracetamol, and teniposide). Three samples did not contain diffracting crystals, but we note that XRPD pre-screening was not performed for these samples prior to submission. Six samples did not yield enough data suitable for structure solution and likely need additional microscope time, possibly with an alternative grid preparation method. Fifty-one samples produced data that should be sufficient for structure solution. (B) For the 51 successful data collections, the approximate resolution limits are shown. This resolution estimate is based on automated processing results from DIALS for the highest resolution crystal. This value is based on CC1/2 ≥ 33%. We note that the final resolution after processing by a trained crystallographer may differ from this cutoff. (C) Of these data collections, the overall completeness based on combining all crystals is shown broken down by Bravais lattice type. Automated processing in DIALS was carried out in the space group suggested by dials.cosym with all crystals for which integration was successful. Overall completeness is shown to the resolution limit determined in panel (B). The single hexagonal sample was in space group P64.
FIGURE 7
FIGURE 7
(A) Phasing method used for structures solved at NIS (internal and client samples). Generally, SHELXT was attempted first, followed by SHELXD, followed by PHASER. For two samples, a combination of SHELXD and PHASER were used. (B) Average refinement statistics for structures determined and refined at NIS shown as boxplots. Note that only structures solved with SHELXT and SHELXD are included in this analysis. (C) Average refinement statistics for structures determined and refined at NIS.
FIGURE 8
FIGURE 8
(A) Overlay of the teniposide MicroED structure determined in this paper (cyan carbon atoms, CCDC KUXJUL) and the structure of teniposide bound to human serum albumin (HSA) from PDB 4L9Q (yellow carbon atoms). (B) Overlay of the two teniposide molecules (same coloring scheme as in panel (A) within the HSA binding pocket demonstrating that the conformation observed in solid state form is distinct from the conformation required for protein binding. UCSF Chimera was used to generate these images (Pettersen et al., 2004).
FIGURE 9
FIGURE 9
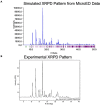
(A) The MicroED structure of progesterone was used to generate a theoretical X-ray powder diffraction (XRPD) pattern at a wavelength of 1.54 Å using Mercury (Macrae et al., 2020). Intensity values are relative to the highest peak. (B) The experimentally measured X-ray powder diffraction (XRPD) pattern for Form I of progesterone is shown roughly lined up to the pattern in panel (A). We note that some differences may be due to the different temperatures at which each pattern was measured (the MicroED pattern was collected at −192°C while the experimental pattern was likely collected at room temperature).

References

    1. Altaf M., Stoeckli-Evans H. (2013). Chiral one- and two-dimensional silver(I)-biotin coordination polymers. Acta Crystallogr. C 69 127–137. 10.1107/s0108270113000322 - DOI - PubMed
    1. Ariëns E. J. (1984). Stereochemistry, a basis for sophisticated nonsense in pharmacokinetics and clinical pharmacology. Eur. J. Clin. Pharmacol. 26 663–668. 10.1007/bf00541922 - DOI - PubMed
    1. Beale E. V., Waterman D. G., Hecksel C., van Rooyen J., Gilchrist J. B., Parkhurst J. M., et al. (2020). A workflow for protein structure determination from thin crystal lamella by micro-electron diffraction. Front. Mol. Biosci. 7:179. 10.3389/fmolb.2020.00179 - DOI - PMC - PubMed
    1. Bh L. (1992). Mechanisms of action of teniposide (VM-26) and comparison with etoposide (VP-16). Semin. Oncol. 19(2 Suppl. 6) 3–19. - PubMed
    1. Censi R., Di Martino P. (2015). Polymorph impact on the bioavailability and stability of poorly soluble drugs. Molecules 20 18759–18776. 10.3390/molecules201018759 - DOI - PMC - PubMed