. 2020 Jul 24:1:100005.
doi: 10.1016/j.lanwpc.2020.100005. eCollection 2020 Aug.

Diabetes during pregnancy and birthweight trends among Aboriginal and non-Aboriginal people in the Northern Territory of Australia over 30 years

Affiliations

Diabetes during pregnancy and birthweight trends among Aboriginal and non-Aboriginal people in the Northern Territory of Australia over 30 years

Matthew J L Hare et al. Lancet Reg Health West Pac. .

Abstract

Background: Early-life risk factors, including maternal hyperglycaemia and birthweight, are thought to contribute to the high burden of cardiometabolic disease experienced by Indigenous populations. We examined rates of pre-existing diabetes in pregnancy, gestational diabetes mellitus (GDM) and extremes of birthweight over three decades in the Northern Territory (NT) of Australia.

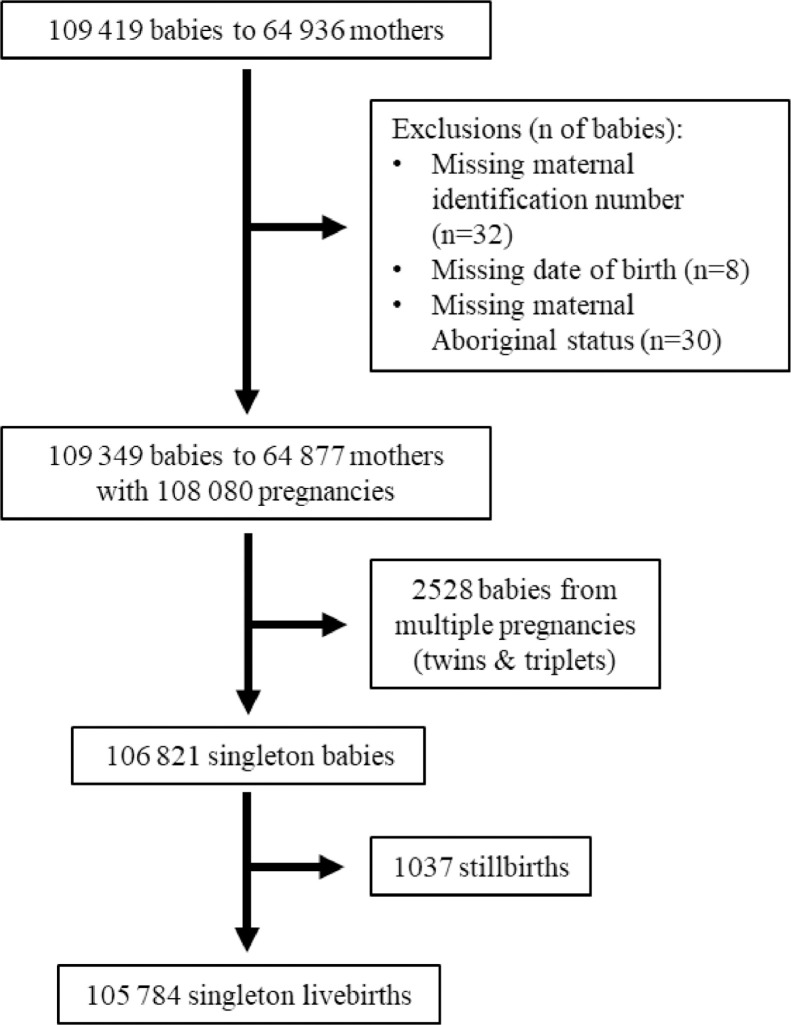
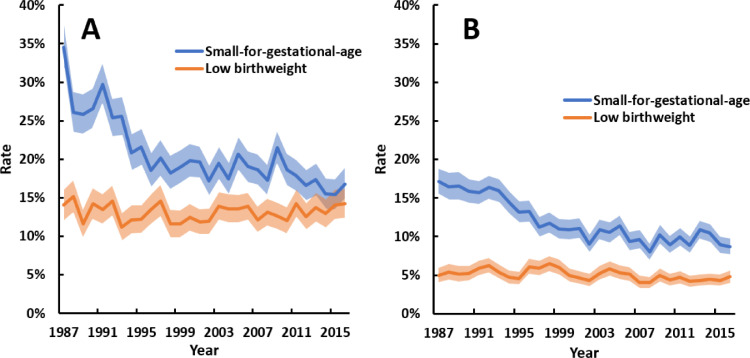
Methods: We performed a retrospective cohort analysis of the NT Perinatal Data Collection from 1987 to 2016, including all births >20 weeks gestation, stratified by maternal Aboriginal identification. Key outcomes were annual rates of pre-existing diabetes, GDM, small-for-gestational-age, large-for-gestational-age, low birthweight (<2500 g), and high birthweight (>4000 g). Logistic regression was used to assess trends and interactions.

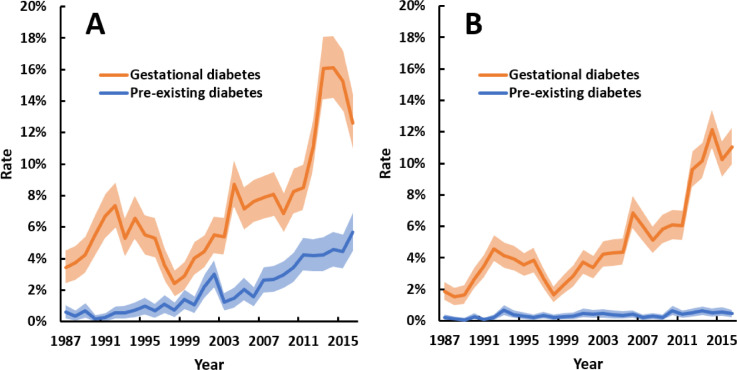
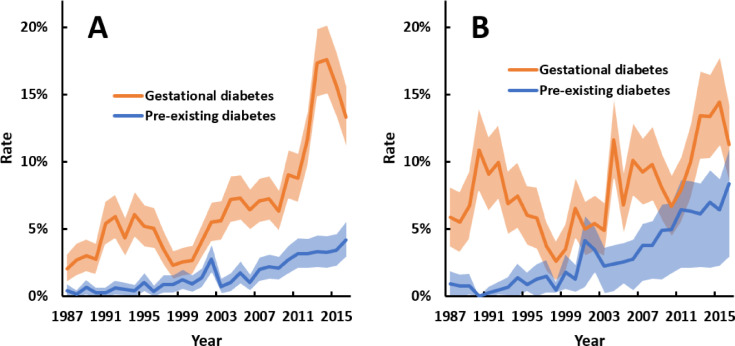
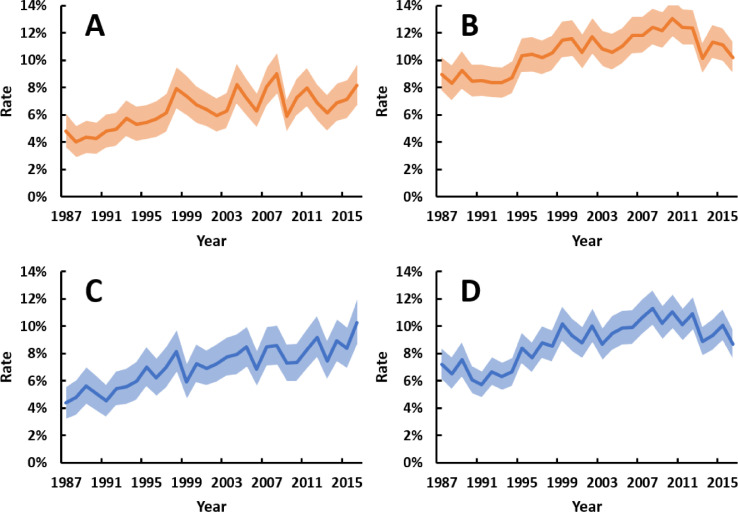
Findings: 109 349 babies were born to 64 877 mothers, 36% of whom identified as Aboriginal ethnicity. Among Aboriginal women, rates of GDM and pre-existing diabetes, respectively, were 3 · 4% and 0 · 6% in 1987 and rose to 13% and 5 · 7% in 2016 (both trends p<0 · 001). Among non-Aboriginal women, rates of GDM increased from 1 · 9% in 1987 to 11% in 2016 (p<0 · 001), while pre-existing diabetes was uncommon (≤0 · 7% throughout). Rates of small-for-gestational-age decreased, while rates of large-for-gestational-age and high birthweight increased in both groups (all trends p<0 · 001). Multivariable modelling suggests that hyperglycaemia was largely responsible for the growing rate of large-for-gestational-age births among Aboriginal women.

Interpretation: The burden of hyperglycaemia in pregnancy has grown substantially in the NT over three decades and is impacting birthweight trends. The prevalence of pre-gestational diabetes in Aboriginal women is among the highest in the world.

Funding: Diabetes Australia Research Program.


Conflict of interest statement

MJLH, FB, SG, RFD, ELMB, GS, VW, JES and LJMB report a competitive grant from the Diabetes Australia Research Program for this study. MJLH also reports scholarship support from the National Health and Medical Research Council (NHMRC), Diabetes Australia and the Australian Academy of Science. JAB, JES and LJMB also report competitive fellowships or grants from the NHMRC. JES has received honoraria for lectures and consultancies unrelated to this study from AstraZeneca, Eli Lilly, Mylan, Novo Nordisk, Sanofi, Merck Sharp and Dohme, Abbott and Boehringer Ingelheim.

Figures

Fig 1
Fig. 1
Flow chart showing cohort numbers of babies, mothers, pregnancies and singleton livebirths included in the study.
Fig 2
Fig. 2
Annual rates of gestational diabetes (GDM) and pre-existing diabetes among pregnancies to (A) Aboriginal and (B) non-Aboriginal women between 1987 and 2016. Shaded areas are 95% confidence intervals. All trends p<0 · 001. Point estimates for trends, as odds ratios per 10 years (95% confidence interval), were: 1 · 66 (1 · 58–1 · 74) for GDM and 2 · 54 (2 · 31–2 · 81) for pre-existing diabetes among Aboriginal women; and 1 · 88 (1 · 80–1 · 96) for GDM and 1 · 36 (1 · 17–1 · 57) for pre-existing diabetes among non-Aboriginal women. Mean total number of pregnancies per annum for Aboriginal and non-Aboriginal mothers, respectively, were 1194 and 2131 for the first decade, 1353 and 2235 for the second decade, and 1386 and 2509 in the third decade.
Fig 3
Fig. 3
Annual rates of gestational diabetes and pre-existing diabetes among pregnancies to Aboriginal women in (A) Top End and (B) Central Australia regions of the NT between 1987 and 2016. Shaded areas are 95% confidence intervals. All trends p<0 · 001. Point estimates for trends, as odds ratios per 10 years (95% confidence interval), were: 1 · 97 (1 · 85–2 · 10) for GDM and 2 · 40 (2 · 09–2 · 75) for pre-existing diabetes in the Top End; and 1 · 29 (1 · 20–1 · 39) for GDM and 2 · 74 (2 · 37–3 · 16) for pre-existing diabetes in Central Australia. Mean total number of pregnancies per annum for Aboriginal women in the Top End and Central Australia regions, respectively, were 769 and 422 for the first decade, 904 and 449 for the second decade, and 925 and 461 in the third decade.
Fig 4
Fig. 4
Annual rates of small-for-gestational-age (SGA) and low birthweight (<2500 g) among singleton livebirths with (A) Aboriginal and (B) non-Aboriginal mothers between 1987 and 2016. Shaded areas are 95% confidence intervals. All trends p<0 · 001, except low birthweight in panel A (p = 0 · 793). Point estimates for trends, as odds ratios per 10 years (95% confidence interval), were: 0 · 78 (0 · 76–0 · 80) for SGA and 1 · 00 (0 · 97–1 · 04) for low birthweight among Aboriginal births; and 0 · 76 (0 · 74–0 · 78) for SGA and 0 · 91 (0 · 87–0 · 95) for low birthweight among non-Aboriginal births. Mean total number of singleton livebirths per annum for Aboriginal and non-Aboriginal mothers, respectively, were 1161 and 2089 for the first decade, 1324 and 2189 for the second decade, and 1352 and 2464 in the third decade.
Fig 5
Fig. 5
Annual rates of singleton liveborn babies with (A) high birthweight (>4000 g) and Aboriginal mothers, (B) high birthweight (>4000 g) and non-Aboriginal mothers, (C) large-for-gestational-age (LGA) and Aboriginal mothers, and (D) LGA and non-Aboriginal mothers between 1987 and 2016. Shaded areas are 95% confidence intervals. All trends p<0 · 001. Point estimates for trends, as odds ratios per 10 years (95% confidence interval), were: 1 · 20 (1 · 14–1 · 26) and 1 · 13 (1 · 10–1 · 16) for high birthweight among Aboriginal and non-Aboriginal births, respectively; and 1 · 25 (1 · 19–1 · 31) and 1 · 19 (1 · 15–1 · 23) for LGA among Aboriginal and non-Aboriginal births, respectively. Mean total number of singleton livebirths per annum for Aboriginal and non-Aboriginal mothers, respectively, were 1161 and 2089 for the first decade, 1324 and 2189 for the second decade, and 1352 and 2464 in the third decade.

References

    1. Naqshbandi M., Harris S.B., Esler J.G., Antwi-Nsiah F. Global complication rates of type 2 diabetes in Indigenous peoples: a comprehensive review. Diabetes Res Clin Pract. 2008;82(1):1–17. - PubMed
    1. McNamara B.J., Gubhaju L., Chamberlain C., Stanley F., Eades S.J. Early life influences on cardio-metabolic disease risk in aboriginal populations – what is the evidence? A systematic review of longitudinal and case-control studies. Int J Epidemiol. 2012;41(6):1661–1682. - PubMed
    1. Lowe W.L., Jr., Scholtens D.M., Kuang A. Hyperglycemia and adverse pregnancy outcome follow-up study (HAPO FUS): maternal gestational diabetes mellitus and childhood glucose metabolism. Diabetes Care. 2019;42(3):372–380. - PMC - PubMed
    1. Knop M.R., Geng T.T., Gorny A.W. Birth weight and risk of Type 2 diabetes mellitus, cardiovascular disease, and hypertension in adults: a meta-analysis of 7 646 267 participants from 135 studies. J Am Heart Assoc. 2018;7(23) - PMC - PubMed
    1. Maple-Brown L., Lee I.L., Longmore D. Pregnancy and neonatal diabetes outcomes in remote Australia: the PANDORA study-an observational birth cohort. Int J Epidemiol. 2019;48(1):307–318. - PubMed