

Health services utilization, out-of-pocket expenditure, and underinsurance among insured non-elderly cancer survivors in the United States, 2011-2015
- PMID: 34327859
- PMCID: PMC8366084
- DOI: 10.1002/cam4.4103
Health services utilization, out-of-pocket expenditure, and underinsurance among insured non-elderly cancer survivors in the United States, 2011-2015
Abstract
Background: High out-of-pocket (OOP) expenditure and inadequate insurance coverage may adversely affect cancer survivors. We aimed to characterize the extent and correlates of healthcare utilization, OOP expenditures, and underinsurance among insured cancer survivors.
Methods: We used 2011-2015 Medical Expenditure Panel Survey data to identify a nationally representative sample of insured non-elderly adult (age 18-64 years) cancer survivors. We used negative binomial, two-part (logistic and Generalized Linear Model with log link and gamma distribution), and logistic regression models to quantify healthcare utilization, OOP expenditures, and underinsurance, respectively, and identified sociodemographic correlates for each outcome.
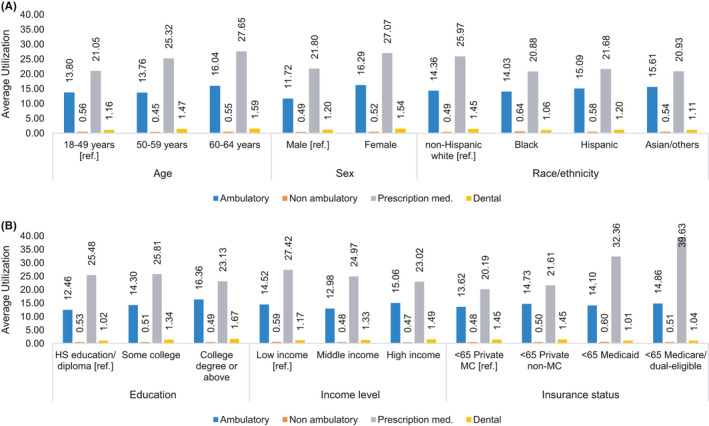
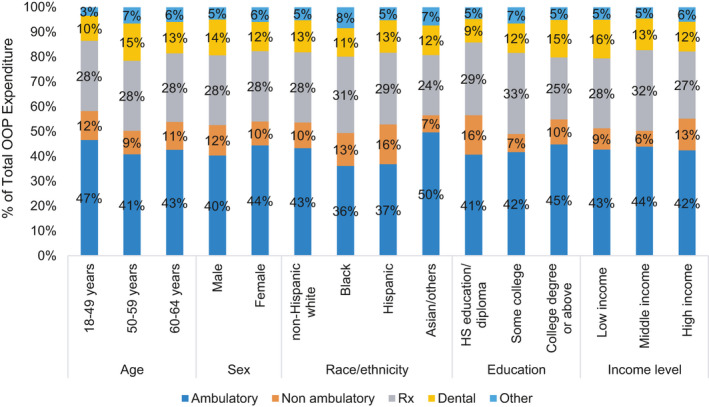
Results: We identified 2738 insured non-elderly cancer survivors. Adjusted average utilization of ambulatory, non-ambulatory, prescription medication, and dental services was 14.4, 0.51, 24.9, and 1.4 events per person per year, respectively. Higher ambulatory and dental services utilization were observed in older adults, females, non-Hispanic Whites, survivors with a college degree and high income, compared to their counterparts. Nearly all (97.7%) survivors had some OOP expenditures, with a mean adjusted OOP expenditure of $1552 per person per year. Adjusted mean OOP expenditures for ambulatory, non-ambulatory, prescription medication, dental, and other health services were $653, $161, $428, $194, and $83, respectively. Sociodemographic variations in service-specific OOP expenditures were generally consistent with respective utilization patterns. Overall, 8.8% of the survivors were underinsured.
Conclusion: Many insured non-elderly cancer survivors allocate a substantial portion of their OOP expenditure for healthcare-related services and experience financial vulnerability, resulting in nearly 8.8% of the survivors being underinsured. Utilization of healthcare services varies across sociodemographic groups.
Keywords: cancer; health services; insurance; out-of-pocket expenditure.
© 2021 The Authors. Cancer Medicine published by John Wiley & Sons Ltd.
Conflict of interest statement
The authors disclose no conflict of interest.
Figures
References
-
- Siegel RL, Miller KD, Jemal A. Cancer statistics, 2020. CA Cancer J Clin. 2020;70(1):7‐30. - PubMed
-
- National Cancer Institute . Financial toxicity and cancer treatment (PDQ®)–health professional version. 2016. https://www.cancer.gov/about‐cancer/managing‐care/track‐care‐costs/finan.... Accessed July 23, 2019.
-
- de Souza JA , Conti RM. Mitigating financial toxicity among us patients with cancer. JAMA Oncol. 2017;3(6):765‐766. - PubMed
Publication types
MeSH terms
Grants and funding
LinkOut - more resources
Full Text Sources
Medical
