. 2021 Sep 13;39(9):1262-1278.e7.
doi: 10.1016/j.ccell.2021.07.003. Epub 2021 Jul 29.

TRIM8 modulates the EWS/FLI oncoprotein to promote survival in Ewing sarcoma

Affiliations

TRIM8 modulates the EWS/FLI oncoprotein to promote survival in Ewing sarcoma

Bo Kyung A Seong et al. Cancer Cell. .

Abstract

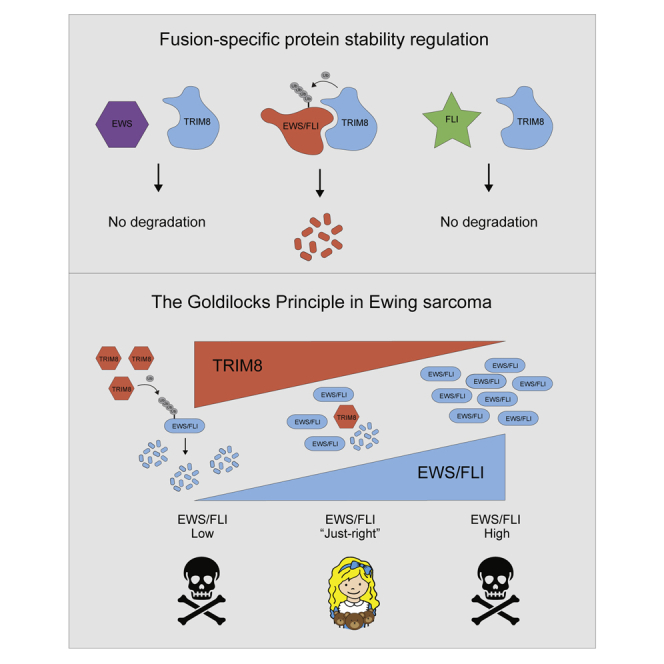
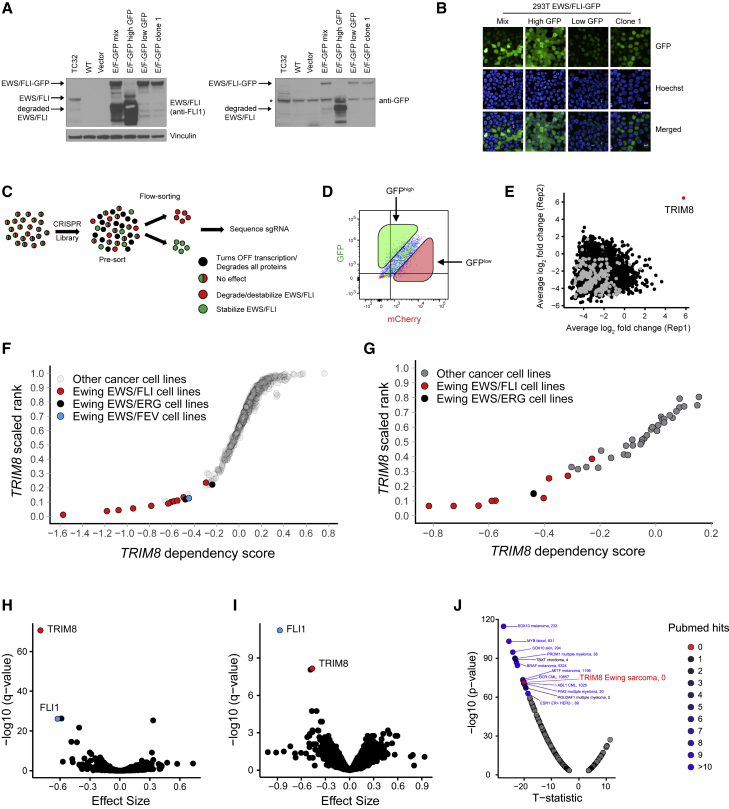
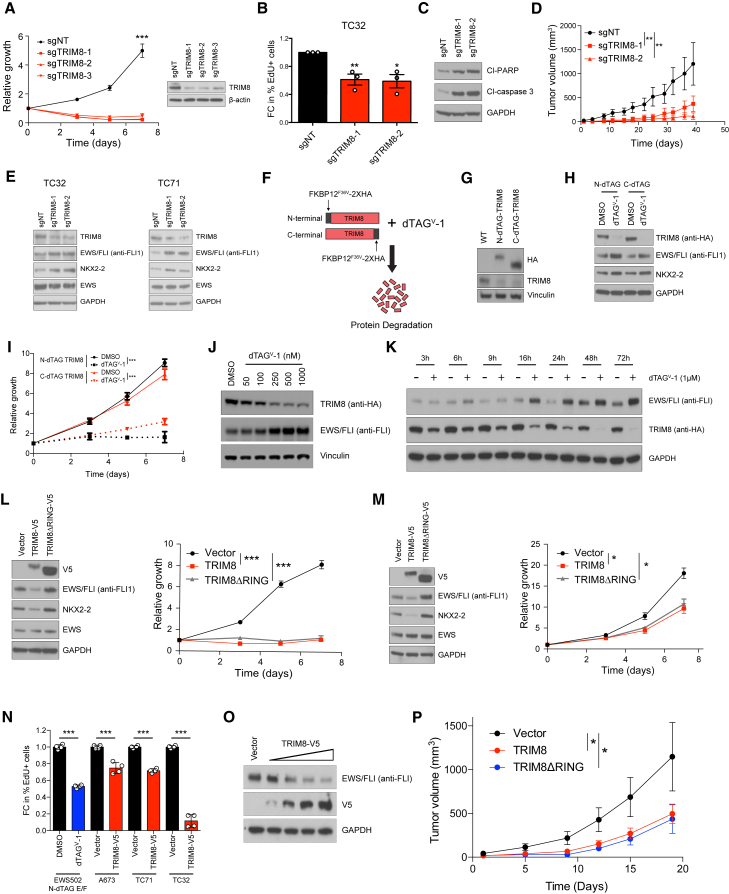
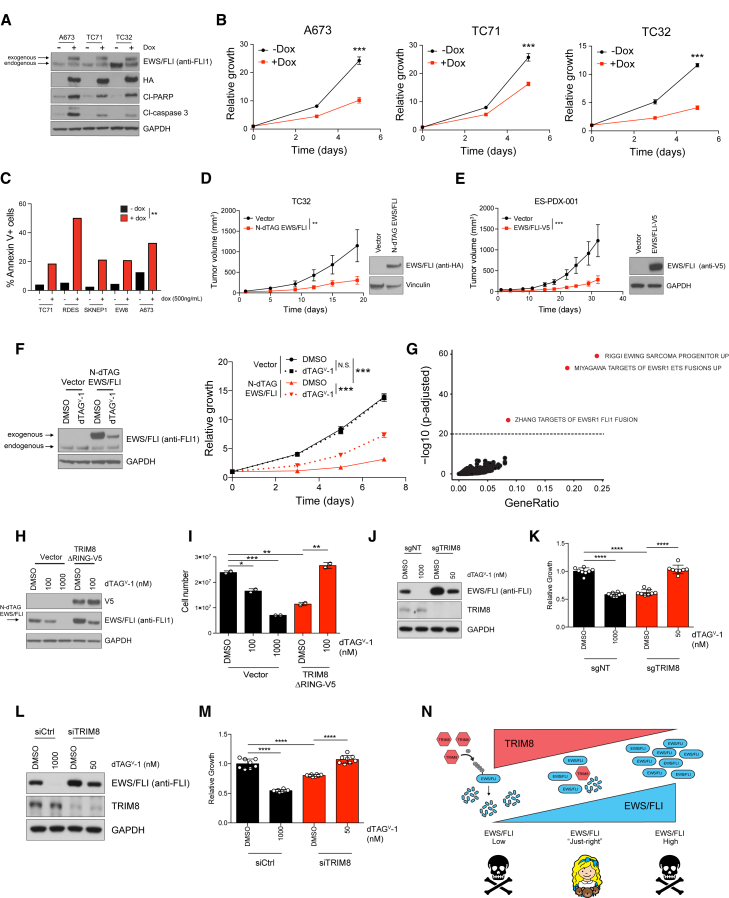
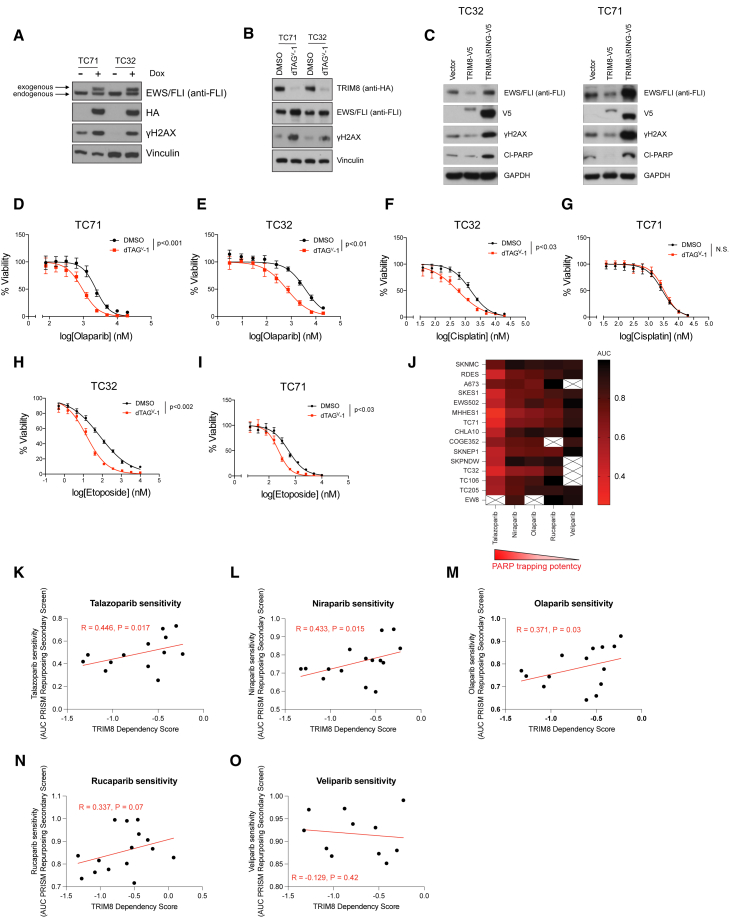
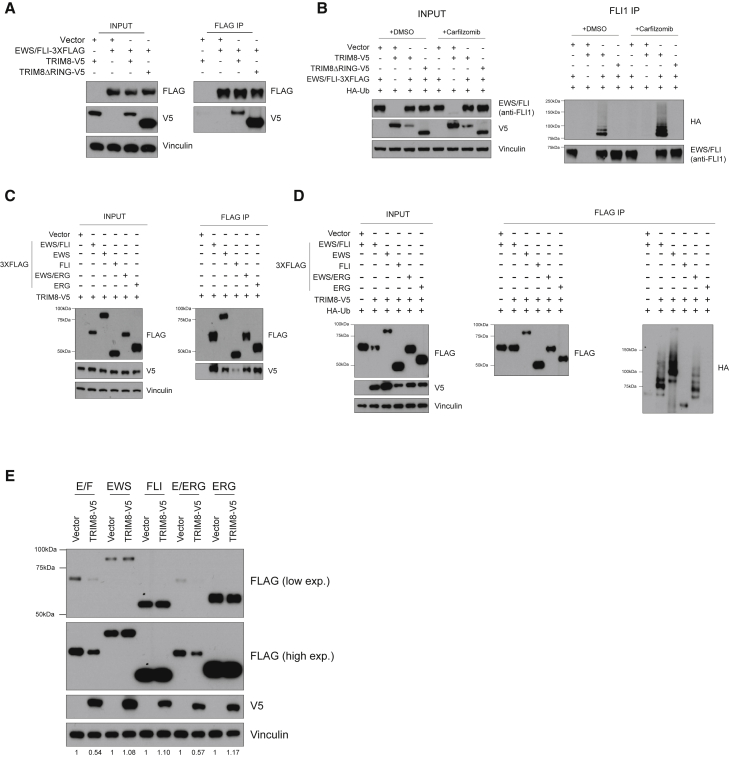
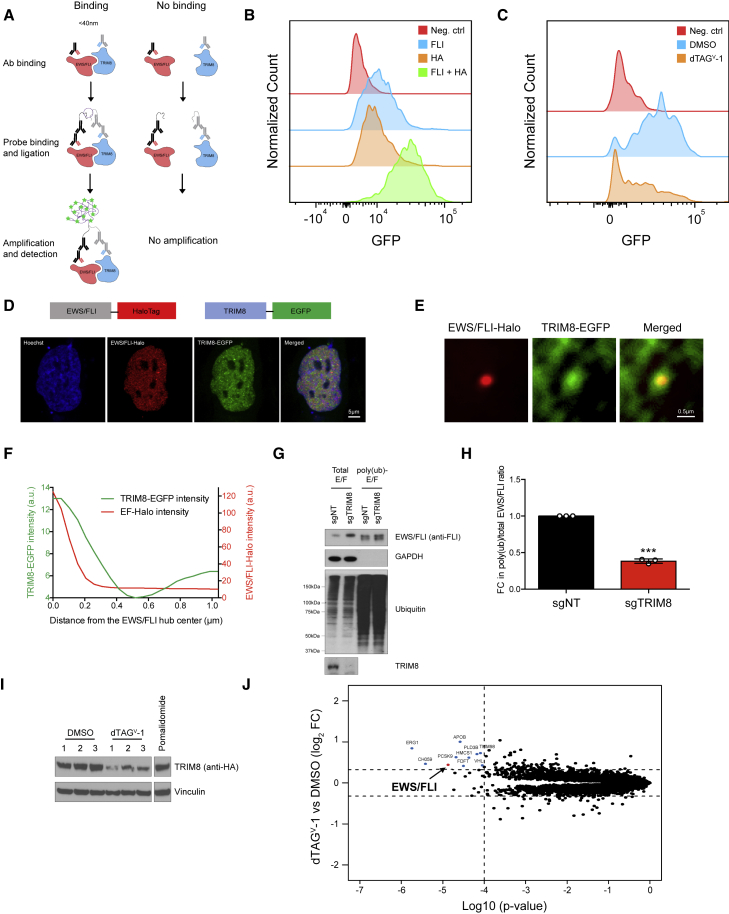
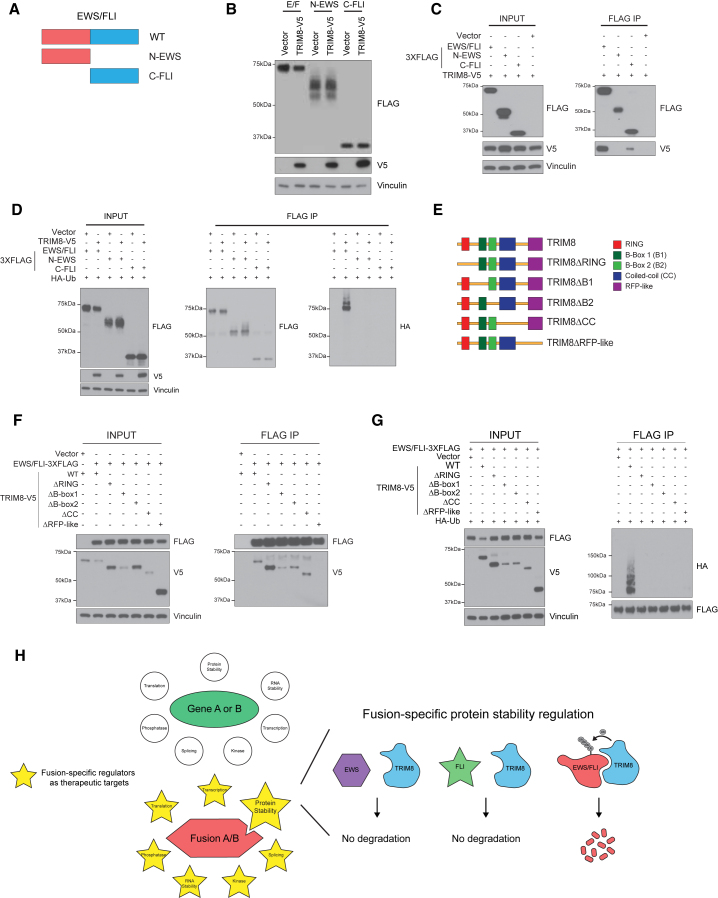
Fusion-transcription factors (fusion-TFs) represent a class of driver oncoproteins that are difficult to therapeutically target. Recently, protein degradation has emerged as a strategy to target these challenging oncoproteins. The mechanisms that regulate fusion-TF stability, however, are generally unknown. Using CRISPR-Cas9 screening, we discovered tripartite motif-containing 8 (TRIM8) as an E3 ubiquitin ligase that ubiquitinates and degrades EWS/FLI, a driver fusion-TF in Ewing sarcoma. Moreover, we identified TRIM8 as a selective dependency in Ewing sarcoma compared with >700 other cancer cell lines. Mechanistically, TRIM8 knockout led to an increase in EWS/FLI protein levels that was not tolerated. EWS/FLI acts as a neomorphic substrate for TRIM8, defining the selective nature of the dependency. Our results demonstrate that fusion-TF protein stability is tightly regulated and highlight fusion oncoprotein-specific regulators as selective therapeutic targets. This study provides a tractable strategy to therapeutically exploit oncogene overdose in Ewing sarcoma and potentially other fusion-TF-driven cancers.

Keywords: E3 ligases; EWS/FLI; Ewing sarcoma; TRIM8; fusion oncoproteins; neomorphic substrate; oncogene overdose; protein degradation; tumor dependency; ubiquitination.


Conflict of interest statement

Declaration of interests K.S. has funding from Novartis Institutes for BioMedical Research, consults for and has stock options in Auron Therapeutics and served as an advisor for Kronos Bio and AstraZeneca all on topics unrelated to this manuscript. E.S.F. is a founder, scientific advisory board (SAB) member, and equity holder of Civetta Therapeutics, Jengu Therapeutics (board member), and Neomorph Inc., an equity holder in C4 Therapeutics, and is a consultant to Novartis, Sanofi, EcoR1 capital, Astellas, and Deerfield. The Fischer lab receives or has received research funding from Novartis, Ajax, Deerfield, and Astellas on topics unrelated to this manuscript. B.N. is an inventor on patent applications related to the dTAG system (WO/2017/024318, WO/2017/024319, WO/2018/148440, and WO/2018/148443). F.M.F., B.N., and N.S.G. are inventors on a patent related to the dTAG system and molecules described in this manuscript (WO/2020/146250). F.M.F. is a consultant to RA Capital and Santi Therapeutics. N.S.G. is a founder, SAB member and equity holder in Syros, C4, Allorion, Jengu, B2S, Inception, EoCys, Larkspur (board member), and Soltego (board member). The Gray lab receives or has received research funding from Novartis, Takeda, Astellas, Taiho, Jansen, Kinogen, Arbella, Deerfield, and Sanofi on topics unrelated to this manuscript. N.V.D. is a current employee of Genentech, Inc., a member of the Roche Group. K.A.D. is a consultant to Kronos Bio. Inclusion and diversity One or more of the authors of this paper self-identifies as an underrepresented ethnic minority in science. One or more of the authors of this paper self-identifies as a member of the LGBTQ+ community. One or more of the authors of this paper received support from a program designed to increase minority representation in science.

Figures

None
Graphical abstract
Figure 1
Figure 1
CRISPR screens identify TRIM8 as a regulator of EWS/FLI protein stability and a selective dependency in Ewing sarcoma (A and B) Immunoblot and images showing the expression level and localization of EWS/FLI-GFP in the reporter cell line and subpopulations. Indicates a non-specific band. (C and D) Schematic of flow cytometry-based CRISPR screening pipeline and the gating strategy used in the screen. (E) Scatterplot showing average log2 fold changes in sgRNA abundance in replicates in the GFPhigh-sorted population. Negative control guides are highlighted in gray. sgRNAs targeting TRIM8 are highlighted in red. Each dot represents an average of log2 fold changes for four independent sgRNAs per gene. (F and G) Scatterplots showing Ewing sarcoma relative dependency on TRIM8 in screens with the Avana (F) and GecKO (G) libraries. The x axis shows the gene’s dependency score in each cell line. The y axis shows the gene’s dependency rank in an individual cell line. (H and I) Comparison of 14 Ewing sarcoma with 724 other cancer cell lines (H) and 11 Ewing sarcoma with 32 other cancer cell lines (I) demonstrates enrichment of TRIM8 dependency in Ewing sarcoma. Each circle represents a single gene. The x axis shows the effect size, which is the mean difference of dependency scores in Ewing sarcoma cell lines compared with other lines screened. Negative effect size indicates that Ewing sarcoma cells are more dependent on that gene compared with other cancer cell lines screened. The y axis shows the significance calculated as –log10(q value) from empirical-Bayes-moderated t statistics with Benjamini-Hochberg correction. (J) A scatterplot showing ranked disease-enriched dependency in the Avana library (n = 738). The x axis shows the t statistics and the y axis shows the significance calculated as –log10(q value) from empirical Bayes-moderated t statistics with Benjamini-Hochberg correction. PubMed hits represent the number of papers retrieved when searched on PubMed.
Figure 2
Figure 2
TRIM8 regulates EWS/FLI protein levels and Ewing sarcoma cell growth (A) TC32 cells infected with non-targeting (sgNT) or TRIM8-directed sgRNAs (sgTRIM8) were assessed for growth using CellTiter-Glo. Mean of eight technical replicates ± SD of relative growth are shown. Data representative of three independent experiments. (B and C) Proliferation (B) and induction of apoptosis (C) in TC32 cells infected with either sgNT or sgTRIM8 were assessed by measuring EdU incorporation (FC, fold change) and cleaved PARP and cleaved caspase-3 levels, respectively. Mean FC of three biological replicates ± SEM are shown for (B). Statistical significance calculated using unpaired two-tailed Student's t test. p < 0.05, ∗∗p < 0.01. (D) Tumor growth of TC32 cells infected with sgNT or two different sgTRIM8s that were implanted subcutaneously: sgNT (n = 6), sgTRIM8-1 (n = 7), and sgTRIM8-2 (n = 7). Mean tumor volume ± SEM are shown. Statistical significance calculated using unpaired two-tailed Student's t test. ∗∗p < 0.01. (E) Ewing sarcoma cell lines were infected with either sgNT or sgTRIM8s and immunoblotted with the indicated antibodies. Data representative of three independent experiments. (F) Schematic of the TRIM8 dTAG system. (G) Immunoblot showing expression of N- or C-terminally FKBP12F36V-2XHA-tagged (N- or C-dTAG) TRIM8 (anti-HA) and endogenous TRIM8 (anti-TRIM8) in TC32 TRIM8 dTAG cells. (H and I) TC32 TRIM8 dTAG cells treated with 1 μM dTAGV-1 molecule for 24 h immunoblotted with the indicated antibodies (H) and assessed for cell growth using CellTiter-Glo (I). Mean of eight technical replicates ± SD of relative growth are shown. Data representative of three independent experiments. (J) TC71 C-dTAG TRIM8 cells were treated with the indicated concentrations of dTAGV-1 for 48 h and immunoblotted with the indicated antibodies. (K) TC71 C-dTAG TRIM8 cells were treated with dTAGV-1 (1 μM) for the indicated time-points and immunoblotted with the indicated antibodies. (L and M) TC32 (L) and TC71 (M) cells infected with lentivirus encoding TRIM8 and an E3 ligase domain deletion mutant (TRIM8ΔRING) were immunoblotted with the indicated antibodies (left) and assessed for cell growth using CellTiter-Glo (right). Mean of eight technical replicates ± SD of relative growth are shown. Data representative of three independent experiments. (N) EdU incorporation of indicated Ewing sarcoma cells overexpressing either control vector or TRIM8-V5 for 4 days. Data represents the fold change (FC) in percent of EdU+ cells ± SEM from two independent experiments with technical duplicates. Statistical significance calculated using unpaired two-tailed Student's t test. ∗∗∗p < 0.001. (O) TC32 cells infected with varying amounts of lentivirus encoding TRIM8-V5 for 48 h and immunoblotted with the indicated antibodies. (P) TC32 cells infected with lentivirus encoding TRIM8-V5, TRIM8ΔRING-V5, or control vector were subcutaneously injected into nude mice: vector (n = 10), TRIM8-V5 (n = 10), and TRIM8ΔRING-V5 (n = 7). Mean tumor volume ± SEM are shown. Statistical significance calculated using unpaired two-tailed Student's t test. p < 0.05.
Figure 3
Figure 3
TRIM8 fine-tunes EWS/FLI expression to promote survival (A and B) A673, TC71, and TC32 cells expressing doxycycline (dox)-inducible EWS/FLI-HA were treated with dox (500 ng/mL) for 2, 3, and 5 days, respectively. Cells were immunoblotted with the indicated antibodies (A) and assessed for growth using CellTiter-Glo (B). Mean of eight technical replicates ±SD of relative growth are shown. Data representative of two independent experiments. (C) Bar graph depicts percentage of annexin V+ cells in Ewing cell lines after 24 h (RDES) or 48 h (TC71, SKNEP1, EW8, A673) of dox-induction (500 ng/mL). Statistical significance calculated using unpaired two-tailed Student's t test. ∗∗p < 0.01. (D and E) TC32 (D) and ES-PDX-001 (E) cells were infected with either EWS/FLI or a vector control and subcutaneously injected into mice. Tumor outgrowth was monitored by measuring tumor volume. Mice for vector (n = 10) and N-dTAG EWS/FLI (n = 10) for TC32 (D) and vector (n = 10) and EWS/FLI-V5 (n = 10) for ES-PDX001 (E). Mean tumor volume ±SEM are shown. Statistical significance calculated using unpaired two-tailed Student's t test. ∗∗p < 0.01, ∗∗∗p < 0.001. Note: tumors from TC32 vector control mice are equivalent to those in Figure 2P. (F) TC32 were infected with vector or N-dTAG EWS/FLI for 3 days, treated with DMSO or dTAGV-1 (1 μM) for 48 h, and then lysed and immunoblotted with the indicated antibodies (left) or assessed for growth (right) using CellTiter-Glo. Mean of eight technical replicates ±SD of relative growth are shown. Statistical significance calculated using unpaired two-tailed Student's t test. ∗∗∗p < 0.001. Data representative of three independent experiments. (G) Scatterplot of gene set enrichment analysis (GSEA) for significantly upregulated genes (adj. p < 0.05) after TRIM8 degradation (24 h). Gene sets significantly enriched (adj. p < 10−20) are highlighted in red. GSEA was performed with mSigDB C2 collection v.7.0. (H and I) EWS502 N-dTAG EWS/FLI cells were infected with either vector or TRIM8ΔRING for 48 h and then treated with either DMSO or dTAGV-1 (1 μM) for 24 h and immunoblotted with the indicated antibodies (H) or assessed for cell growth by cell counting (I). Mean of two technical replicates ± SD are shown. Statistical significance calculated using unpaired two-tailed Student's t test. p < 0.05, ∗∗p < 0.01, ∗∗∗p < 0.001. Data representative of three independent experiments. (J–M) EWS502 N-dTAG EWS/FLI cells were either transfected with control (siCtrl) or TRIM8-targeting (siTRIM8) siRNAs (J) or infected with either non-targeting (sgNT) or TRIM8-targeting sgRNA (sgTRIM8) (L) for 48 h. Cells were then treated with either DMSO or indicated concentrations of dTAGV-1 for 48 h and were assessed for growth using CellTiter-Glo (K and M). Mean of eight technical replicates ± SD of relative growth are shown. Statistical significance calculated using unpaired two-tailed Student's t test. p < 0.05, ∗∗p < 0.01, ∗∗∗p < 0.001. Data representative of two independent experiments. (N) Conceptual model of the Goldilocks principle with EWS/FLI dosage.
Figure 4
Figure 4
EWS/FLI overexpression and TRIM8 degradation increase DNA damage and sensitize cells to PARP inhibitors (A) TC71 and TC32 cells expressing dox-inducible EWS/FLI-HA were treated with doxycycline (dox) (500 ng/mL) for 48 h and immunoblotted with the indicated antibodies. (B) TC71 and TC32 C-dTAG TRIM8 cells were treated with either DMSO control or dTAGV-1 (1 μM) for 48 h and immunoblotted with the indicated antibodies. (C) TC32 and TC71 cells were infected with lentivirus encoding either vector control, TRIM8-V5, or TRIM8ΔRING-V5 and immunoblotted with the indicated antibodies. (D–I) TC32 and TC71 C-dTAG TRIM8 cells were pre-treated with either DMSO control or dTAGV-1 (1 μM) for 48 h and assessed for sensitivity to olaparib (D and E), cisplatin (F and G), and etoposide (H and I). Mean of eight technical replicates ±SD of relative viability are shown. Statistical significance calculated using unpaired two-tailed Student's t test. Data in (A–I) representative of three independent experiments. (J) Heatmap showing area under the curve values of PARP inhibitor sensitivity of Ewing sarcoma cells in the PRISM Repurposing Secondary Screen at the Broad Institute (https://depmap.org/portal/). (K–O) Scatterplots showing the correlation between TRIM8 dependency and sensitivity to PARP inhibitors: talazoparib (K), niraparib (L), olaparib (M), rucaparib (N), and veliparib (O). Spearman correlation (R) and p value from one-sided exact t test are shown.
Figure 5
Figure 5
EWF/FLI is a neomorphic substrate of TRIM8 for degradation (A) 293T cells were transfected with the indicated constructs for 48 h and then treated with 500 nM carfilzomib for 6 h, lysed, immunoprecipitated, and immunoblotted with the indicated antibodies. Data representative of three independent experiments. (B) 293T cells were transfected with the indicated constructs for 48 h and treated with DMSO or 500 nM carfilzomib for 6 h. Cells were then lysed, immunoprecipitated, and immunoblotted with the indicated antibodies. Data representative of three independent experiments. (C) 293T cells transfected with either fusion oncoproteins or WT counterparts for 48 h were treated with 1 μM carfilzomib for 6 h, lysed, immunoprecipitated, and immunoblotted with the indicated antibodies. Data representative of three independent experiments. (D) 293T cells were transfected with the indicated constructs for 48 h then lysed, immunoprecipitated, and immunoblotted with the indicated antibodies. Data representative of three independent experiments. (E) 293T cells were transfected with either FLAG-tagged fusion oncoproteins or WT counterparts for 48 h, lysed, and immunoblotted with the indicated antibodies. Data representative of three independent experiments.
Figure 6
Figure 6
TRIM8 interacts with and ubiquitinates EWS/FLI in Ewing sarcoma cells (A) Schematic of the proximity ligation assay (PLA). (B) Histogram showing fluorescence signal from the PLA in TC71 C-dTAG TRIM8 cells. No antibody (neg. ctrl), anti-FLI, and anti-HA alone were used as negative controls. Anti-FLI and anti-HA combination were used to detect interaction between TRIM8 and EWS/FLI. (C) PLA signal TC71 C-dTAG TRIM8 cells treated with either DMSO or dTAGV-1 (1 μM) for 48 h. Data representative of three independent experiments. (D) Schematic of fluorescent proteins expressed in A673-E/F-Halo cell line is shown above. Airyscan super-resolution images of the nucleus (Hoechst stained, blue), endogenous EWS/FLI-Halo (JF646 labeled, red), and transiently expressed TRIM8-EGFP (green) in an A673-E/F-Halo cell. (E) Two-color image showing that endogenous EWS/FLI-Halo hubs enrich for TRIM8-EGFP. The nuclear fluorescence background is subtracted in both channels of the average image (see the STAR Methods for details). (F) Average background-free radial profiles of EWS/FLI-Halo and TRIM8-EGFP at EWS/FLI-Halo hubs (averaged from 6,872 hubs in 15 cells). (G and H) Poly-ubiquitinated proteins in TC71 cells infected with either non-targeting or TRIM8-targeting sgRNA were enriched with tandem ubiquitin binding entities (TUBE). Both input and TUBE-enriched proteins were immunoblotted with the indicated antibodies. EWS/FLI levels were quantified using ImageJ and the poly(ub)-E/F:total-E/F ratio was used to calculate poly-ubiquitinated EWS/FLI levels. Fold change (FC) in poly-ubiquitinated EWS/FLI ±SEM from three independent experiments is shown in (H). ∗∗∗p < 0.001. (I) TC71 C-dTAG TRIM8 cells treated with 1 μM of dTAGV-1 for 6 h in triplicate were lysed and immunoblotted with the indicated antibodies. Six hour pomalidomide (1 μM) treatment served as a positive control for TMT mass spectrometry. (J) Total proteome of cells in (I) was analyzed using TMT quantification mass spectrometry. Non-EWS/FLI proteins that significantly changed in abundance are highlighted in blue and EWS/FLI in red. Significance cutoffs used were p < 0.0001 and fold change (FC) > 1.25 and noted with dotted lines. Note: ERG1 (Q14534) is a squalene monooxygenase and not the ETS family member ERG (P11308).
Figure 7
Figure 7
Identification of domains critical for TRIM8-mediated degradation of EWS/FLI (A) Schematics of EWS/FLI deletion mutants. (B) EWS/FLI, N-EWS, and C-FLI mutants tagged with 3XFLAG were co-transfected with either TRIM8 or a vector control in 293T cells. After 48 h, cells were lysed and immunoblotted with the indicated antibodies. (C) 293T cells were co-transfected with TRIM8 and EWS/FLI, N-EWS, C-FLI, or a vector control for 48 h, treated with 500 nM carfilzomib for 6 h, lysed, immunoprecipitated, and immunoblotted with the indicated antibodies. (D) 293T cells transfected with the indicated constructs for 48 h, treated with 500 nM carfilzomib for 6 h, lysed, immunoprecipitated, and immunoblotted with the indicated antibodies. (E) Schematic of TRIM8 structural domains and mutants. (F and G) 293T cells transfected with the indicated constructs for 48 h, treated with 500 nM carfilzomib for 6 h, lysed with either lysis buffer (F) or ubiquitination lysis buffer (G), immunoprecipitated, and immunoblotted with the indicated antibodies. Data representative of three independent experiments. (H) Schematic depicting fusion oncoprotein-specific regulators as potential therapeutic targets. EWS/FLI-specific regulation of TRIM8 is shown as an example.
Figure 8
Figure 8
K334 is critical for TRIM8-mediated degradation (A) Schematic of lysine mutants of EWS/FLI. Lysine positions correspond to the positions found in WT EWS and FLI1 proteins. (B and C) Indicated EWS/FLI lysine mutants were co-transfected with either TRIM8 or a vector control in 293T cells. After 48 h, cells were lysed and immunoblotted with the indicated antibodies. Data representative of three independent experiments.

References

    1. Adane B., Alexe G., Seong B.K.A., Lu D., Hwang E.E., Hnisz D., Lareau C.A., Ross L., Lin S., Dela Cruz F.S. STAG2 loss rewires oncogenic and developmental programs to promote metastasis in Ewing sarcoma. Cancer Cell. 2021;39:827–844 e810. doi: 10.1016/j.ccell.2021.05.007. - DOI - PMC - PubMed
    1. Aguirre A.J., Meyers R.M., Weir B.A., Vazquez F., Zhang C.Z., Ben-David U., Cook A., Ha G., Harrington W.F., Doshi M.B. Genomic copy number dictates a gene-independent cell response to CRISPR/Cas9 targeting. Cancer Discov. 2016;6:914–929. doi: 10.1158/2159-8290.CD-16-0154. - DOI - PMC - PubMed
    1. Aynaud M.M., Mirabeau O., Gruel N., Grossetete S., Boeva V., Durand S., Surdez D., Saulnier O., Zaidi S., Gribkova S. Transcriptional programs define intratumoral heterogeneity of Ewing sarcoma at single-cell resolution. Cell Rep. 2020;30:1767–1779 e1766. doi: 10.1016/j.celrep.2020.01.049. - DOI - PubMed
    1. Behan F.M., Iorio F., Picco G., Goncalves E., Beaver C.M., Migliardi G., Santos R., Rao Y., Sassi F., Pinnelli M. Prioritization of cancer therapeutic targets using CRISPR-Cas9 screens. Nature. 2019 doi: 10.1038/s41586-019-1103-9. - DOI - PubMed
    1. Boulay G., Sandoval G.J., Riggi N., Iyer S., Buisson R., Naigles B., Awad M.E., Rengarajan S., Volorio A., McBride M.J. Cancer-specific retargeting of BAF complexes by a prion-like domain. Cell. 2017;171:163–178 e119. doi: 10.1016/j.cell.2017.07.036. - DOI - PMC - PubMed

Publication types

MeSH terms