. 2021 Sep 21;120(18):4129-4136.
doi: 10.1016/j.bpj.2021.07.018. Epub 2021 Jul 27.

Novel mechanism for oscillations in catchbonded motor-filament complexes

Affiliations

Novel mechanism for oscillations in catchbonded motor-filament complexes

Sougata Guha et al. Biophys J. .

Abstract

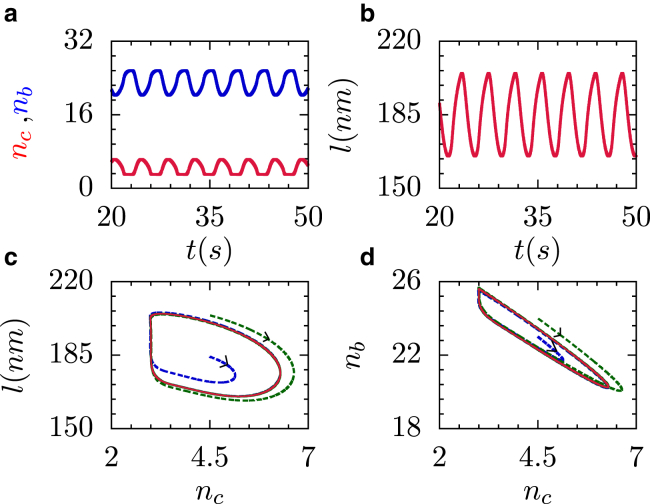
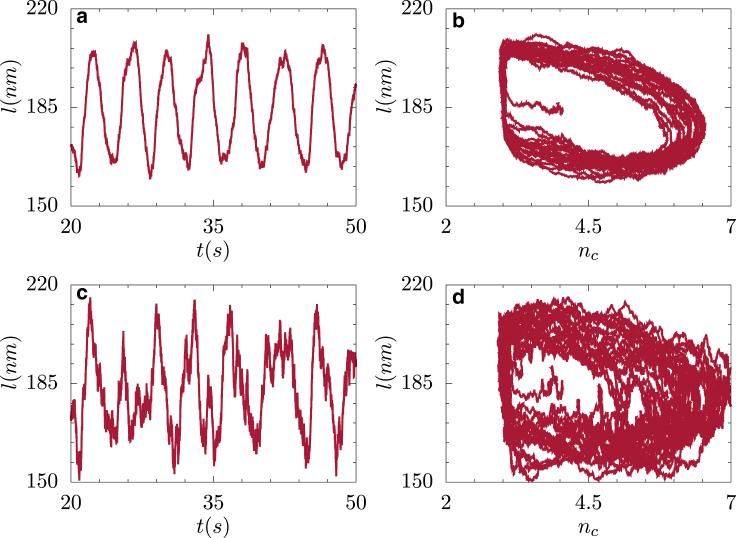
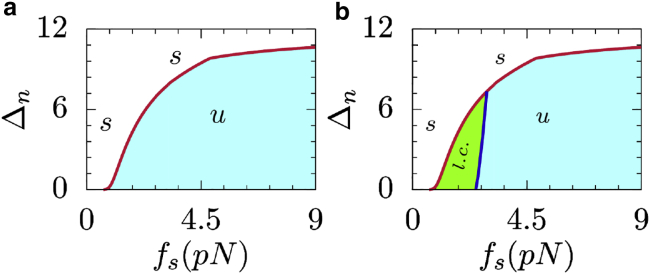
Generation of mechanical oscillations is ubiquitous to a wide variety of intracellular processes, ranging from activity of muscle fibers to oscillations of the mitotic spindle. The activity of motors plays a vital role in maintaining the integrity of the mitotic spindle structure and generating spontaneous oscillations. Although the structural features and properties of the individual motors are well characterized, their implications on the functional behavior of motor-filament complexes are more involved. We show that force-induced allosteric deformations in dynein, which result in catchbonding behavior, provide a generic mechanism to generate spontaneous oscillations in motor-cytoskeletal filament complexes. The resultant phase diagram of such motor-filament systems-characterized by force-induced allosteric deformations-exhibits bistability and sustained limit-cycle oscillations in biologically relevant regimes, such as for catchbonded dynein. The results reported here elucidate the central role of this mechanism in fashioning a distinctive stability behavior and oscillations in motor-filament complexes such as mitotic spindles.


Figures

Figure 1
Figure 1
Schematic diagram of the antiparallel MT-motor complex in presence of passive cross-linkers (P). Unbound motors (U) attach to any of the MTs with rate kb3D; bound motors (B) cross-link at rate kb, whereas they detach from the MT at a rate ku0. Cross-linked motors (C) become bound motors with detachment rate ku under a load force Fp. To see this figure in color, go online.
Figure 2
Figure 2
Limit-cycle oscillations for (a) nc (red curve) and nb (blue curve) and (b) l as a function of time. The figures show that these quantities oscillate between nc ∼3–6, nb ∼20–26, and l ∼164–205 nm. (c) and (d) depict the variation of l and nb with nc, respectively (red curves). The blue and green dashed lines depict two sample trajectories with different initial conditions eventually falling onto the limit cycle. All the curves are obtained for fs = 2.46, Δn = 6, which corresponds to a point denoted by a solid diamond in the limit-cycle region in Fig. 3d. To see this figure in color, go online.
Figure 3
Figure 3
Stability diagram of an MT-motor complex as a function of f0˜. (a) f0˜ = 309.52 (f0 ≈ 1000 pN), (b) f0˜ = 24.76 (f0 ≈ 80 pN), (c) f0˜ = 15.47 (f0 ≈ pN), and (d) f0˜ = 11.98 (f0 ≈ 38.7 pN). All other parameters are Np = 100, kb = ku0 = 1/s (֒γ = 1), v0 = 100 nm/s, Γ˜ = 2.6, fd˜ = 0.2 (fd ≈ 0.67 pN), α = 68, fm˜ = 0.43 (fm ≈ 1.4 pN), b = 1.3 nm, ε = 2kBT. The red solid line depicts the boundary between linearly stable (white) and unstable (cyan) regions. Green areas indicate regions where limit cycles can be sustained, and yellow shaded areas signal regions where the complex displays bistable behavior. (e)–(h) depict the unbinding rate of a single dynein motor under load force, f, for the f0-values of (a)–(d), and the blue dashed line gives the reference curve when fs = fm. (i)–(l) show the bifurcations diagrams as a function of fs in different regions of the phase plane, as indicated by the dashed lines in (a)–(c). The solid blue lines indicate a stable branch, and the dashed red lines indicate unstable solutions. To see this figure in color, go online.
Figure 4
Figure 4
Limit-cycle oscillations in l-time plane (left panels) and in l-nc plane (right panels) in presence of noise (Eqs. 12, 13, and 14). The values of the diffusion coefficient are λ = 0.1 (in a and b) and λ = 1 (in c and d). All other parameter values are same as Fig. 2. To see this figure in color, go online.
Figure 5
Figure 5
(a) and (b) show the amplitude of oscillations of nc and l, respectively, and (c) depicts the time period of limit-cycle oscillations as a function of fs for Δn = 1.5. The green dashed line denotes the limit-cycle boundary for the particular set of parameters. All other parameters are same as Fig. 3d. To see this figure in color, go online.
Figure 6
Figure 6
Stability diagram when fs = fm (a) in the absence of catchbond (f0˜ = 309.52) and (b) presence of catchbond (f0˜ = 11.98). All other parameters are same as Fig. 3. The red solid curve corresponds to the boundary between linearly stable (white) and linearly unstable regions (cyan). The figure shows that limit cycles (green) develop only because of catchbond. To see this figure in color, go online.

References

    1. Albertson D.G. Formation of the first cleavage spindle in nematode embryos. Dev. Biol. 1984;101:61–72. - PubMed
    1. Grill S.W., Kruse K., Jülicher F. Theory of mitotic spindle oscillations. Phys. Rev. Lett. 2005;94:108104. - PubMed
    1. Günther S., Kruse K. Spontaneous waves in muscle fibres. New J. Phys. 2007;9:417.
    1. Sasaki D., Fujita H., Ishiwata S. Auto-oscillations of skinned myocardium correlating with heartbeat. J. Muscle Res. Cell Motil. 2005;26:93–101. - PubMed
    1. Kunwar A., Tripathy S.K., Gross S.P. Mechanical stochastic tug-of-war models cannot explain bidirectional lipid-droplet transport. Proc. Natl. Acad. Sci. USA. 2011;108:18960–18965. - PMC - PubMed

Publication types

MeSH terms

LinkOut - more resources