

Multiple drivers of ecological change in Arctic lakes and ponds
- PMID: 34330143
- PMCID: PMC8324333
- DOI: 10.1371/journal.pone.0254257
Multiple drivers of ecological change in Arctic lakes and ponds
Abstract
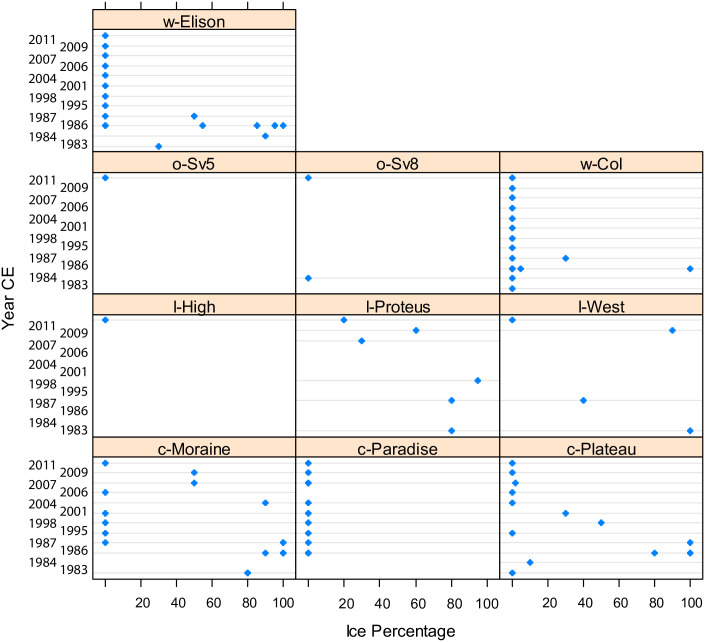
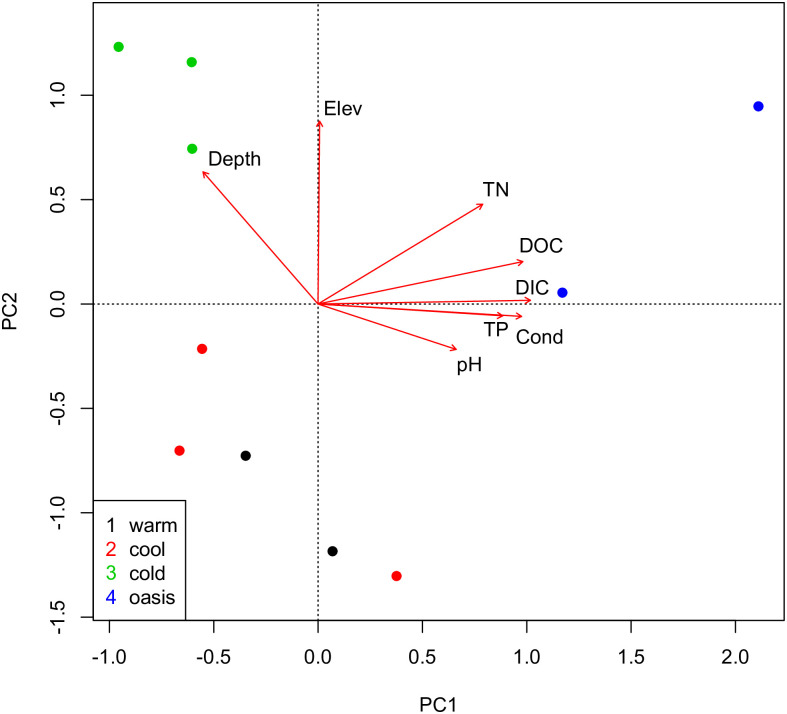
Griffiths et al. (2017) analyzed several ponds and lakes from the Cape Herschel region of Ellesmere Island in order to "…explicitly examine the role of ice cover as the dominant driver of diatom assemblage change…". I reanalyze their data and suggest that their classification scheme, that they propose is due to differences in ice cover seasonality ("warm", "cool", "cold", and "oasis"), is confounded with other morphological and chemical variables that better explain the differences between the groups. The "cold" sites are the deepest (lakes) and differ from the small, shallow ponds that occasionally dry, which would therefore have different diatom assemblages and histories. The "oasis" sites are nutrient enriched and probably have more stable water supplies, thereby enabling an aquatic flora providing habitats for diatoms. A key part of their interpretation is that "warm" sites have responded more rapidly to recent climate change than "cold" or "cool" sites, but their chronologies do not allow for such a conclusion. There is no clear difference between "cool" and "warm" sites, and problems in dating the sequences means inferences about their histories are not supported by data. Their results, which are restricted to the past century, are contradicted by a Holocene sequence from the region.
Conflict of interest statement
The authors have declared that no competing interests exist.
Figures
Comment in
-
Reply to formal comment on Griffiths et al. (2017) submitted by Gajewski (2020).PLoS One. 2021 Aug 3;16(8):e0254481. doi: 10.1371/journal.pone.0254481. eCollection 2021. PLoS One. 2021. PMID: 34343189 Free PMC article.
References
-
- Juggins S. C2 Version 1.5 User guide. Software for ecological and palaeoecological data analysis and visualisation. Newcastle University, Newcastle upon Tyne, UK. 2007 https://www.staff.ncl.ac.uk/stephen.juggins/software/C2Home.htm
-
- R Core Team. R: A language and environment for statistical computing. R Foundation for Statistical Computing, Vienna, Austria. 2017; https://www.R-project.org/
-
- Oksanen J, Blanchet F, Friendly M, Kindt R, Legendre P, McGlinn D, et al. vegan: Community Ecology R package vers 2.4–4. 2017; https://CRAN.R-project.org/package=vegan
-
- Hobbie JE. Polar Limnology. In: Taub FB, editor. Lakes and Reservoirs, Ecosystems of the World 23. Amsterdam, Elsevier; 1984. Pp. 63–105
Publication types
MeSH terms
LinkOut - more resources
Full Text Sources
Medical
Miscellaneous
