. 2021 Jul 30;14(1):37.
doi: 10.1186/s13072-021-00408-5.

Histone H2A.X phosphorylation and Caspase-Initiated Chromatin Condensation in late-stage erythropoiesis

Affiliations

Histone H2A.X phosphorylation and Caspase-Initiated Chromatin Condensation in late-stage erythropoiesis

Nazish N Jeffery et al. Epigenetics Chromatin. .

Abstract

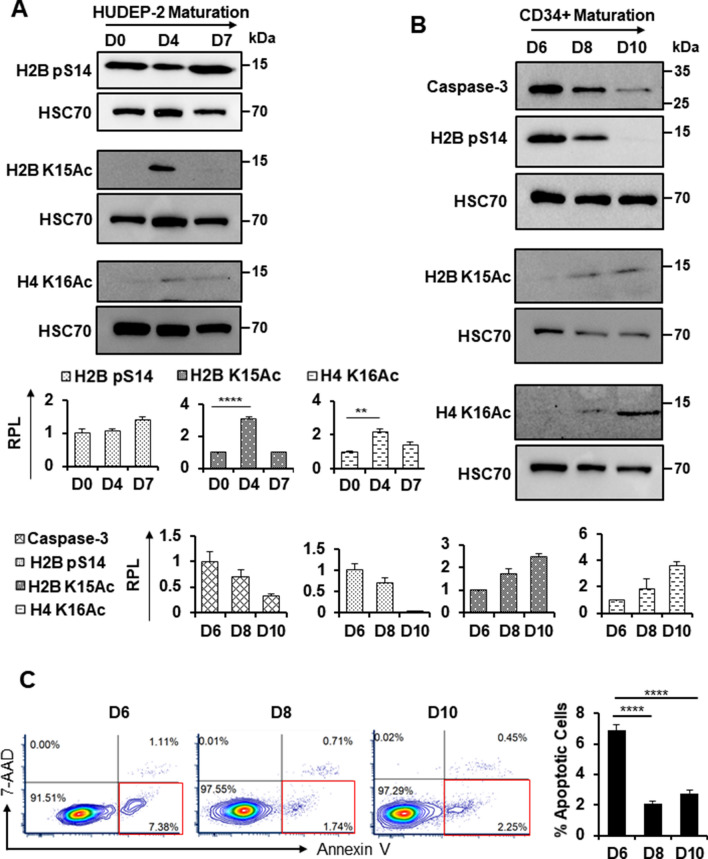
Background: Condensation of chromatin prior to enucleation is an essential component of terminal erythroid maturation, and defects in this process are associated with inefficient erythropoiesis and anemia. However, the mechanisms involved in this phenomenon are not well understood. Here, we describe a potential role for the histone variant H2A.X in erythropoiesis.

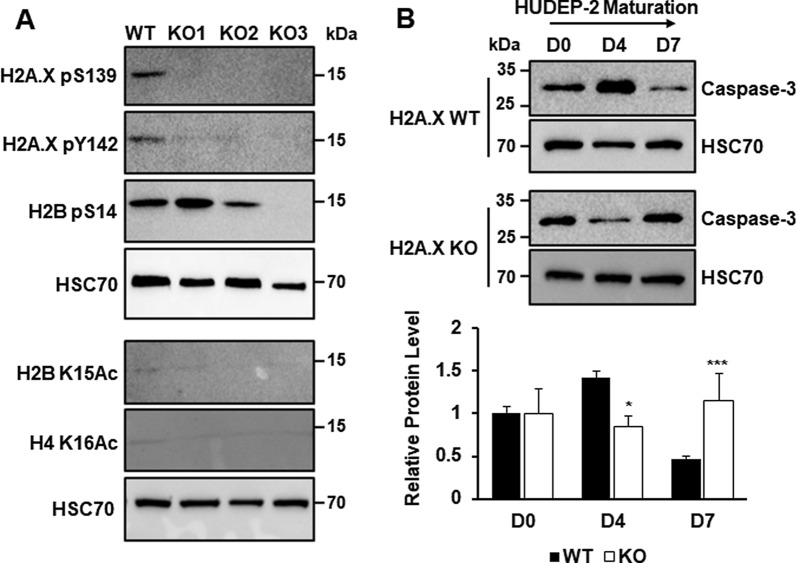
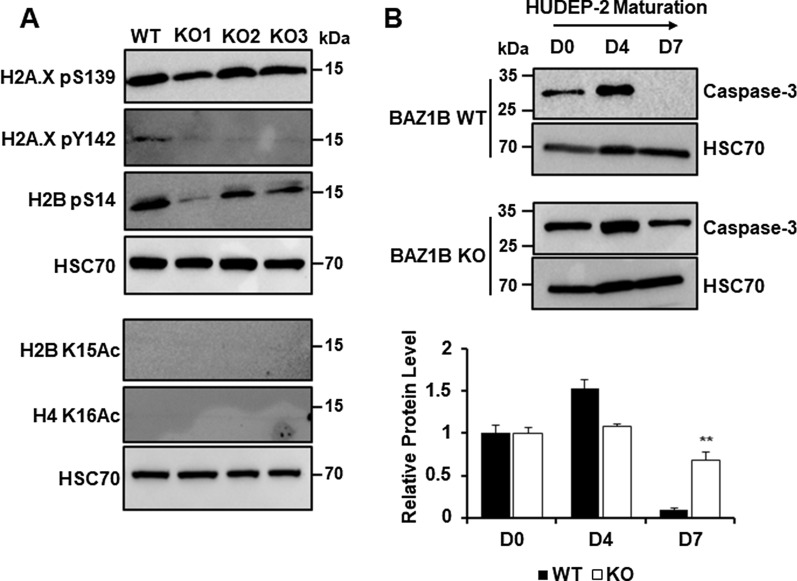
Results: We find in multiple model systems that this histone is essential for normal maturation, and that the loss of H2A.X in erythroid cells results in dysregulation in expression of erythroid-specific genes as well as a nuclear condensation defect. In addition, we demonstrate that erythroid maturation is characterized by phosphorylation at both S139 and Y142 on the C-terminal tail of H2A.X during late-stage erythropoiesis. Knockout of the kinase BAZ1B/WSTF results in loss of Y142 phosphorylation and a defect in nuclear condensation, but does not replicate extensive transcriptional changes to erythroid-specific genes observed in the absence of H2A.X.

Conclusions: We relate these findings to Caspase-Initiated Chromatin Condensation (CICC) in terminal erythroid maturation, where aspects of the apoptotic pathway are invoked while apoptosis is specifically suppressed.

Keywords: Apoptosis; BAZ1B; Caspase; Chromatin condensation; Erythropoiesis; H2A.X; Phosphorylation; Terminal erythroid maturation; WSTF; g-H2A.X.


Conflict of interest statement

The authors declare that they have no competing interests.

Figures

Fig. 1
Fig. 1
Presence of histone H2A.X and γ-H2A.X during terminal erythroid maturation. Imaging (A) and quantification (B) of γ-H2A.X foci in sorted murine bone marrow (n = 4). Giemsa staining of WT (C) HUDEP-2 cells at D0, D4, and D7 of maturation and D WT human CD34+ progenitor cells at D6, D8, and D10 of maturation after undergoing CD36 synchronization. Western blot analysis of histone H2A.X, γ-H2A.X (H2A.X pS139), and H2A.X pY142 during maturation in E HUDEP-2 (n = 3) and F human CD34+ progenitor (n = 2). HSC70 was used as a loading control. Quantification was performed using ImageJ. Signal obtained at the earliest time point measured was set at 1.0. Error bars represent ± SEM. Asterisks (*) indicate significance as follows: *p ≤ 0.05; **p ≤ 0.01. p-values were calculated with a two-tailed Student’s t-test
Fig. 2
Fig. 2
Maturation of H2A.X knockout HUDEP-2 cell lines. A Illustration of CRISPR/Cas9 design used to generate H2A.X KO HUDEP-2 cell lines. B Western blot analysis of H2A.X protein expression in WT and H2A.X KO HUDEP-2 cell lines. HSC70 was used as a loading control and quantification was performed using Image J. WT: wild type, KO: knock out. n = 3. C Graph of WT and H2A.X KO cell expansion across a HUDEP-2 maturation time course, as measured by Trypan exclusion. D Representative Wright–Giemsa staining of WT and H2A.X KO HUDEP-2 cells during expansion (D0), and during D4 and D7 of maturation. Arrows indicate H2A.X KO cells that have not condensed their nuclei to the same degree as WT. E Analysis of hemoglobin accumulation, as measured by benzidine staining, in WT and H2A.X KO HUDEP-2 cells from D1–D4 of maturation. Error bars represent ± SEM in B & E and ± SD in C. Asterisks (*) indicate significance as follows: **p ≤ 0.01; ***p ≤ 0.001. P-values were calculated with a two-tailed Student’s t-test
Fig. 3
Fig. 3
Transcriptome analysis of HUDEP-2 histone H2A.X KO cells. Heat map depicting differentially expressed genes (log2-fold change ≥ 1.5 and P-Value ≤ 0.001) in WT (n = 2) and H2A.X KO (n = 3) HUDEP-2 cell cultures at D0 (A) and D6 (B) of maturation. Bar graphs showing number of upregulated and downregulated genes relative to WT in H2A.X KO HUDEP-2 cell cultures at D0 (C) and D6 (D) of maturation. E Log2 values of fold-change for specific erythroid and hematopoietic genes at D0 and D6 of maturation. Green bar represents genes that typically are upregulated during erythropoiesis and the red bar represents genes that are typically downregulated during erythropoiesis. Asterisks (*) indicate significance as follows: *p ≤ 0.05; **p ≤ 0.01; ****p ≤ 0.0001
Fig. 4
Fig. 4
Markers of caspase-initiated chromatin condensation and apoptosis during erythroid maturation. Western blot analysis of H2B pS14, H2B K15Ac, and H4K16Ac expression during A HUDEP-2 (n = 3) and B human CD34+ progenitor (n = 2) maturation along with Caspase-3 protein expression. HSC70 was used as a loading control. Quantification was performed using ImageJ, with signal obtained at the earliest time point measured set at 1.0. p: phosphorylation, Ac: acetylation, RPL: relative protein level. C Schematic and graphical representations of flow cytometric analysis of Annexin-V and 7-AAD in human CD34+ progenitor cell cultures (n = 5 technical replicates of 2 biological replicates each). Red boxes indicate apoptotic cells. Error bars represent ± SEM. Asterisks (*) indicate significance as follows: **p ≤ 0.01; ****p ≤ 0.0001. p-values were calculated with a two-tailed Student’s t-test
Fig. 5
Fig. 5
Effect of H2A.X KO on markers of caspase-initiated chromatin condensation in HUDEP-2 cells. A Western blot analysis of H2A.X pS139, H2A.X pY142, H2B pS14, H2B K15Ac, and H4 K16Ac post-translational marks in proliferating WT (n = 3) and H2A.X KO HUDEP-2 (KO1–KO3) (n = 2) subclones during proliferation. HSC70 was used as loading control. B Western blot analysis of full-length Caspase-3 protein expression in WT (n = 3) and H2A.X KO (n = 6) HUDEP-2 cell cultures at D0, D4, and D7 of maturation. HSC70 was used as loading control. Quantification was performed using ImageJ, with signal observed in WT at D0 set as 1.0. Error bars represent ± SEM. Asterisks (*) indicate significance as follows: ***p ≤ 0.001. p-values were calculated with a two-tailed Student’s t-test
Fig. 6
Fig. 6
Analysis of BAZ1B knockout in HUDEP-2 cell lines. Relative mRNA expression in various cells from A humans and B mice. Data for both human and mouse mRNA expression were obtained from The Scripps Research Institute BioGPS database(46). C Western blot analysis of BAZ1B protein expression in WT (n = 3) HUDEP-2 cell cultures at D0, D4, and D7 of maturation. GAPDH was used as loading control. Quantification was performed using Image J. RPL: relative protein level. D Schematic of CRISPR/Cas9 designed used to generate BAZ1B KO HUDEP-2 cell lines. E Western blot analysis of BAZ1B protein expression in WT (n = 3) and BAZ1B KO (n = 3) HUDEP-2 cell lines. HSC70 was used as a loading control and quantification was performed using Image J. WT: wild type, KO: knock out. p-values were calculated with a two-tailed Student’s t-test. F Wright–Giemsa staining of WT and BAZ1B KO HUDEP-2 cells during D0, D4, and D7 of maturation. Arrows indicate BAZ1B KO cells that have not condensed their nuclei to the same degree as WT. G WT and BAZ1B KO cell expansion measured by Trypan exclusion. H Log2 values of fold-change for specific erythroid and hematopoietic genes at D0 and D6 of maturation. Green bar represents genes that typically are upregulated during erythropoiesis and the red bar represents genes that are typically downregulated during erythropoiesis. Error bars represent ± SEM in C &E and ± SD in A, B and G. Asterisks (*) indicate significance as follows: **p ≤ 0.01; ***p ≤ 0.001; ****p ≤ 0.0001
Fig. 7
Fig. 7
Markers of caspase-initiated chromatin condensation. A Western blot analysis of γ-H2A.X, H2A.X pY142, H2B pS14, H2B K15Ac, H4 K16Ac post-translational marks in WT (n = 3) and in BAZ1B KO HUDEP-2 subclones (KO1–KO3) (n = 2) during maturation. HSC70 was used as loading control. B Western blot analysis of full-length Caspase-3 protein expression in WT (n = 3) and BAZ1B KO (n = 6) HUDEP-2 subclones at D0, D4, and D7 of maturation. HSC70 was used as loading control. The bar graph shows quantification as performed using ImageJ. Error bars represent ± SEM. Asterisks (*) indicate significance as follows: **p ≤ 0.01. p-values were calculated with a two-tailed Student’s t-test
Fig. 8
Fig. 8
Caspase-initiated chromatin condensation pathway. Model representing the predicted pathway that erythroblasts undergo to condense their chromatin. Question marks indicate uncertainty regarding the initial signal for H2A.X S139 phosphorylation at the basophilic erythroblast stage, and the possibility of additional, redundant signals for caspase activation. (p) in red circle represents γ-H2A.X; (p) in yellow circle represents H2A.X pY142; (p) in blue circle represents H2B pS14. The illustration was created using bioRENDER

References

    1. Palis J. Primitive and definitive erythropoiesis in mammals. Front Physiol. 2014;5:9. doi: 10.3389/fphys.2014.00003. - DOI - PMC - PubMed
    1. Ji P, Murata-Hori M, Lodish HF. Formation of mammalian erythrocytes: chromatin condensation and enucleation. Trends Cell Biol. 2011;21(7):409–415. doi: 10.1016/j.tcb.2011.04.003. - DOI - PMC - PubMed
    1. Zhao B, Liu H, Mei Y, Liu Y, Han X, Yang J, et al. Disruption of erythroid nuclear opening and histone release in myelodysplastic syndromes. Cancer Med. 2019;8(3):1169–1174. doi: 10.1002/cam4.1969. - DOI - PMC - PubMed
    1. Malik J, Lillis JA, Couch T, Getman M, Steiner Correspondence LA. The methyltransferase Setd8 is essential for erythroblast survival and maturation. Cell Rep. 2017;21:2376–2383. doi: 10.1016/j.celrep.2017.11.011. - DOI - PMC - PubMed
    1. Baron MH, Barminko J. Chromatin condensation and enucleation in red blood cells: an open question. Dev Cell. 2016;36:481–482. doi: 10.1016/j.devcel.2016.02.014. - DOI - PubMed