. 2021 Oct;49(10):882-891.
doi: 10.1124/dmd.120.000350. Epub 2021 Jul 30.

Cytochrome P450-Catalyzed Metabolism of Cannabidiol to the Active Metabolite 7-Hydroxy-Cannabidiol

Affiliations

Cytochrome P450-Catalyzed Metabolism of Cannabidiol to the Active Metabolite 7-Hydroxy-Cannabidiol

Jessica L Beers et al. Drug Metab Dispos. 2021 Oct.

Abstract

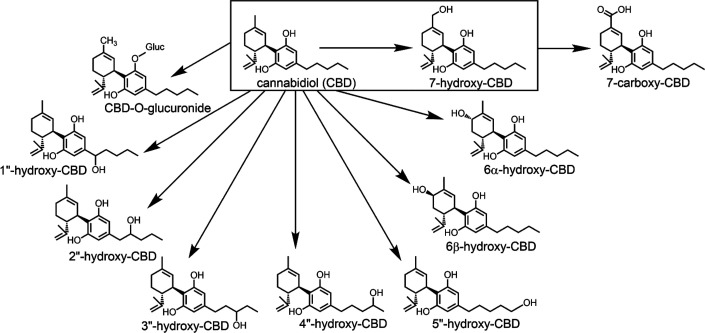
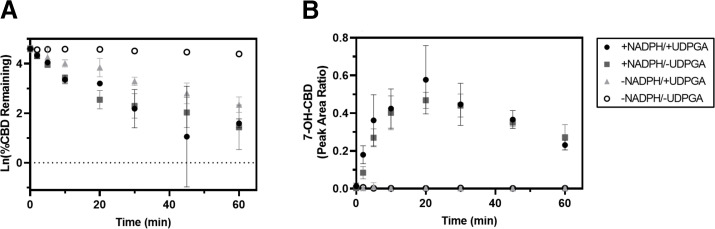
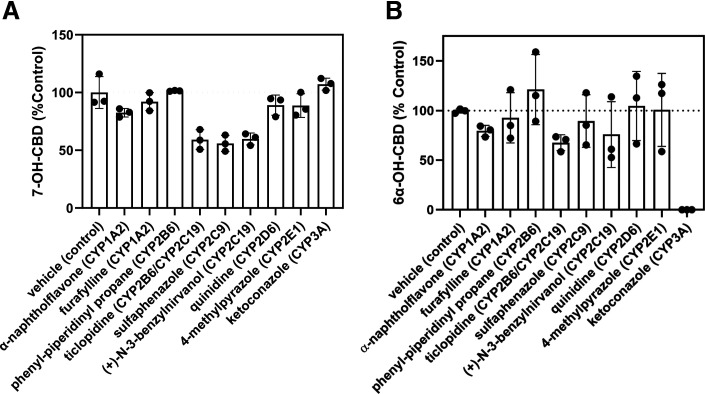
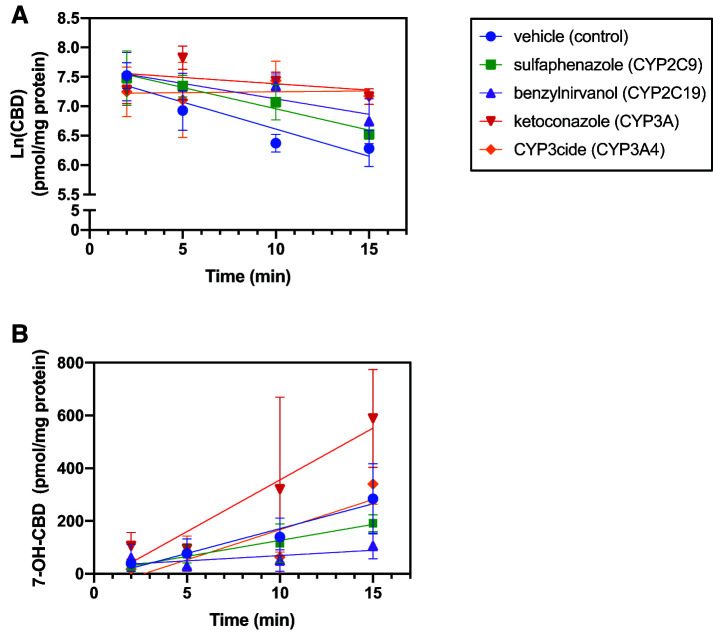
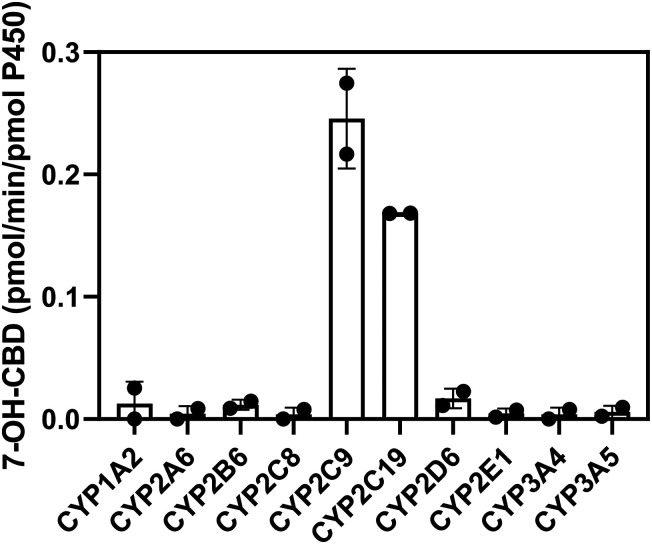
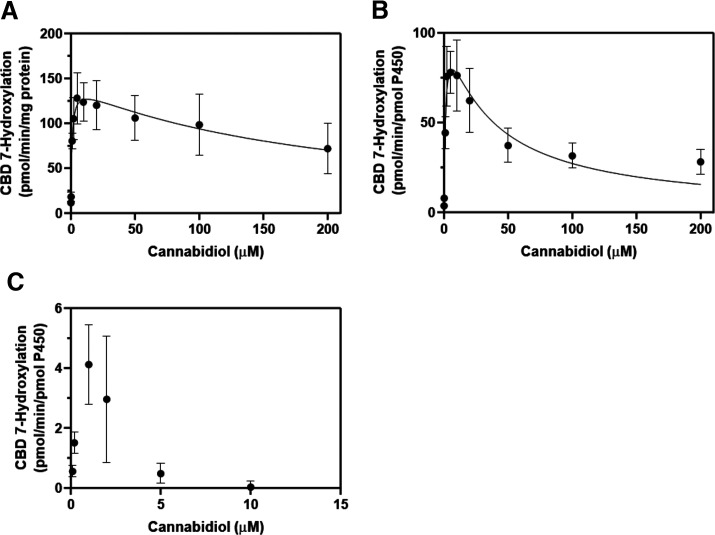
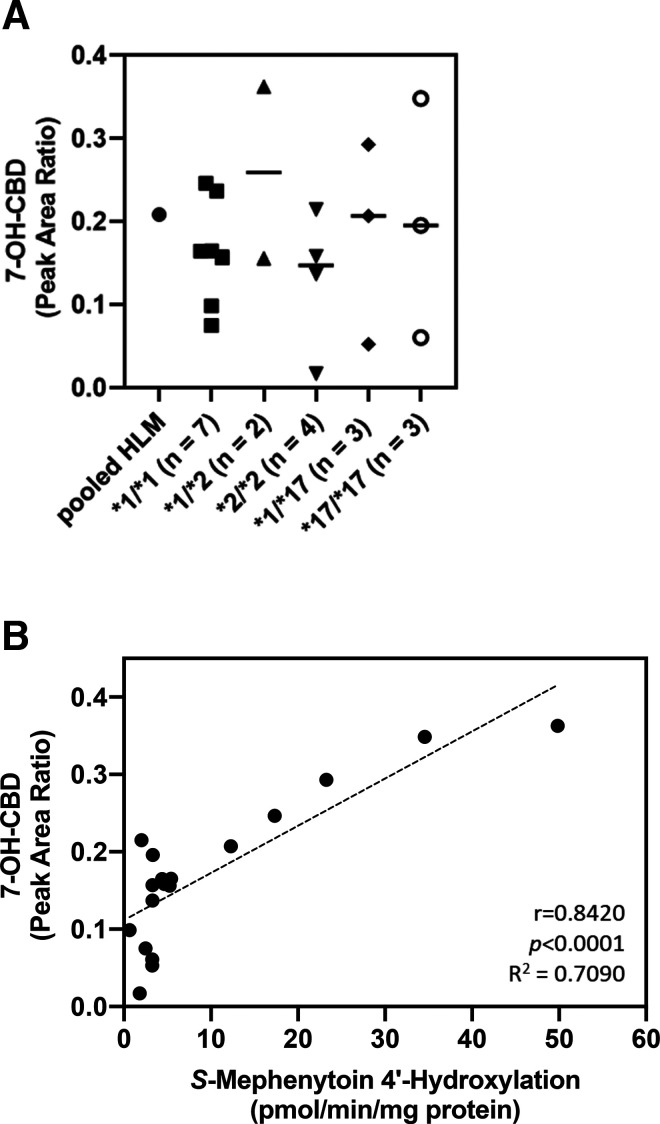
Cannabidiol (CBD) is a naturally occurring nonpsychotoxic phytocannabinoid that has gained increasing attention as a popular consumer product and for its use in Food and Drug Administration-approved Epidiolex (CBD oral solution) for the treatment of Lennox-Gastaut syndrome and Dravet syndrome. CBD was previously reported to be metabolized primarily by CYP2C19 and CYP3A4, with minor contributions from UDP-glucuronosyltransferases. 7-Hydroxy-CBD (7-OH-CBD) is the primary active metabolite with equipotent activity compared with CBD. Given the polymorphic nature of CYP2C19, we hypothesized that variable CYP2C19 expression may lead to interindividual differences in CBD metabolism to 7-OH-CBD. The objectives of this study were to further characterize the roles of cytochrome P450 enzymes in CBD metabolism, specifically to the active metabolite 7-OH-CBD, and to investigate the impact of CYP2C19 polymorphism on CBD metabolism in genotyped human liver microsomes. The results from reaction phenotyping experiments with recombinant cytochrome P450 enzymes and cytochrome P450-selective chemical inhibitors indicated that both CYP2C19 and CYP2C9 are capable of CBD metabolism to 7-OH-CBD. CYP3A played a major role in CBD metabolic clearance via oxidation at sites other than the 7-position. In genotyped human liver microsomes, 7-OH-CBD formation was positively correlated with CYP2C19 activity but was not associated with CYP2C19 genotype. In a subset of single-donor human liver microsomes with moderate to low CYP2C19 activity, CYP2C9 inhibition significantly reduced 7-OH-CBD formation, suggesting that CYP2C9 may play a greater role in CBD 7-hydroxylation than previously thought. Collectively, these data indicate that both CYP2C19 and CYP2C9 are important contributors in CBD metabolism to the active metabolite 7-OH-CBD. SIGNIFICANCE STATEMENT: This study demonstrates that both CYP2C19 and CYP2C9 are involved in CBD metabolism to the active metabolite 7-OH-CBD and that CYP3A4 is a major contributor to CBD metabolism through pathways other than 7-hydroxylation. 7-OH-CBD formation was associated with human liver microsomal CYP2C19 activity, but not CYP2C19 genotype, and CYP2C9 was found to contribute significantly to 7-OH-CBD generation. These findings have implications for patients taking CBD who may be at risk for clinically important cytochrome P450-mediated drug interactions.


Figures

Fig. 1.
Fig. 1.
Metabolism of CBD by hepatic cytochrome P450 and UGT enzymes. Conversion to the active metabolite 7-OH-CBD has been outlined.
Fig. 2.
Fig. 2.
CBD substrate depletion and 7-OH-CBD formation in pooled HLM. CBD substrate depletion (A) and 7-hydroxylation (B) were measured in the presence and absence of the metabolic cofactors NADPH and UDPGA. CBD (1 µM) was incubated with 150-donor pooled HLM (0.2 mg/ml protein) for 0, 2, 5, 10, 20, 30, 45, and 60 minutes. (A) Rates of CBD depletion were calculated using natural log-transformed depletion data. Generation of 7-OH-CBD is expressed in (B) as the ratio of metabolite to internal standard, cannabidiol-d9. Data points represent the mean ± S.D. of duplicate experiments.
Fig. 3.
Fig. 3.
Effect of cytochrome P450–selective chemical inhibitors on CBD metabolism. CBD (1 to 2 µM) was incubated with pooled HLM (0.2 mg/ml protein) for 10 minutes. Formation of 7-OH-CBD (A) and 6α-OH-CBD (B) was measured in the presence of cytochrome P450–selective chemical inhibitors and compared with vehicle control incubations without inhibitor. The rate of 7-OH-CBD formation with vehicle control was 13.1 ± 2.30 pmol/min per milligram protein. Rates of metabolite formation were calculated using a standard curve in the range of 5–500 ng/ml (limit of quantitation = 25 ng/ml for 7-OH-CBD). The affected enzyme(s) for each inhibitor are listed in parentheses. Bars represent the mean ± S.D. of a single experiment performed in triplicate.
Fig. 4.
Fig. 4.
Effect of CYP2C9, CYP2C19, and CYP3A inhibition on CBD depletion and metabolite formation. CBD (1 µM) was incubated with 150-donor pooled HLM (0.2 mg/ml protein) in the presence of cytochrome P450–selective chemical inhibitors (sulfaphenazole, 5 µM; (+)-N-3-benzylnirvanol, 5 µM; ketoconazole, 1 µM; and CYP3cide, 0.5 µM) and a vehicle control for 2, 5, 10, 15, 20, and 30 minutes. For reactions containing the time-dependent inhibitor CYP3cide, a 10-minute preincubation with CYP3cide and HLM was performed prior to addition of substrate. CBD depletion (A) and 7-OH-CBD formation (B) were quantified using a standard curve ranging from 5 to 500 ng/ml (limit of quantitation = 25 ng/ml) and measured as a peak area ratio with respect to internal standard (CBD-d9 and 7-OH-CBD-d3, respectively). Rates of CBD depletion were calculated using natural log-transformed depletion data, and rates of metabolite formation were calculated in the linear range of formation (over 15 minutes for 7-OH-CBD). Points represent the mean ± S.D. of a single experiment performed in triplicate.
Fig. 5.
Fig. 5.
Metabolism of CBD by recombinant cytochrome P450 enzymes. CBD (1 µM) was incubated with cytochrome P450 Supersomes (20 pmol/ml) for 10 minutes, and formation of 7-OH-CBD was measured by LC-MS/MS. Rates of formation were extrapolated from a 7-OH-CBD standard curve in the range of 5–500 ng/ml (limit of quantitation = 5 ng/ml). Bars represent the mean ± S.D. of two experiments performed in triplicate.
Fig. 6.
Fig. 6.
Kinetic analysis of CBD 7-hydroxylation in pooled HLM (A), recombinant CYP2C19 (B), and recombinant CYP2C9 (C). CBD (0.1, 0.2, 1, 2, 5, 10, 20, 50, 100, and 200 µM) was incubated with 150-donor pooled HLM (0.2 mg/ml protein), rCYP2C19 (10 pmol/ml), and rCYP2C9 (10 pmol/ml) for 10 minutes, 2 minutes, and 5 minutes, respectively. Formation of 7-OH-CBD was measured by LC-MS/MS analysis using a standard curve in the range of 5–1000 ng/ml (limit of quantitation = 25 ng/ml for reactions with pooled HLM, 10 ng/ml for CYP2C19, and 25 ng/ml for CYP2C9). For pooled HLM and recombinant CYP2C19, Km and Vmax for 7-OH-CBD formation were calculated using GraphPad Prism 8 software using the following equation to describe substrate inhibition: Y= Vmax/(Km/X + 1 + X/Ki) (see Data Analysis). Data points represent mean ± S.D. of three experiments performed in triplicate.
Fig. 7.
Fig. 7.
CBD metabolite formation in individual CYP2C19-genotyped HLMs. CBD (2 µM) was incubated with individual CYP2C19-genotyped HLM (0.2 mg/ml protein) for 5 minutes. (A) Formation of 7-OH-CBD was measured by LC-MS/MS analysis as a peak area ratio with respect to internal standard (CBD-d9). Data points represent the mean, and bars represent the median metabolite formation of three experiments performed in triplicate. (B) Correlation of 7-OH-CBD formation with CYP2C19 activity in individual CYP2C19-genotyped HLM. 7-OH-CBD formation was compared with CYP2C19 activity as measured by the rate of 4′-hydroxymephenytoin formation. Pearson r correlation coefficients, R2 values, and two-tailed P values were calculated using GraphPad Prism 8 software.
Fig. 8.
Fig. 8.
Effect of cytochrome P450–selective chemical inhibitors on CBD metabolism by individual CYP2C19-genotyped HLMs. CBD (2 µM) was incubated with 150-donor pooled HLM and individual HLMs (diluted with 100 mM potassium phosphate buffer to 0.2 mg/ml protein) for 10 minutes. Formation of 7-OH-CBD was measured in the presence of sulfaphenazole (5 µM), (+)-N-3-benzylnirvanol (5 µM), or ketoconazole (1 µM) and compared with vehicle control incubations without inhibitor. Rates of metabolite formation were calculated using a standard curve in the range of 10–1000 ng/ml (limit of quantitation = 25 ng/ml for 7-OH-CBD; indicated by dotted line). The CYP2C19 genotype for each donor is shown in parentheses. Bars represent the mean ± S.D. of a single experiments performed in triplicate.

References

    1. Achour BBarber J, Rostami-Hodjegan A (2014) Expression of hepatic drug-metabolizing cytochrome p450 enzymes and their intercorrelations: a meta-analysis. Drug Metab Dispos 42:1349–1356. - PubMed
    1. Bansal S, Maharao N, Paine MF, Unadkat JD (2020) Predicting the potential for cannabinoids to precipitate pharmacokinetic drug interactions via reversible inhibition or inactivation of major cytochromes p450. Drug Metab Dispos 48:1008–1017. - PMC - PubMed
    1. Copeland RA (2000) Enzymes: A Practical Introduction to Structure, Mechanism, and Data Analysis, Ed. 2nd. Wiley-VCH, Inc., New York.
    1. Damkier P, Lassen D, Christensen MMH, Madsen KG, Hellfritzsch M, Pottegård A(2019) Interaction between warfarin and cannabis. Basic Clin Pharmacol Toxicol 124:28–31. - PubMed
    1. Gaston TE, Bebin EM, Cutter GR, Liu Y, Szaflarski JP; UAB CBD Program (2017) Interactions between cannabidiol and commonly used antiepileptic drugs. Epilepsia 58:1586–1592. - PubMed

Publication types

MeSH terms

LinkOut - more resources