. 2021 Jul 30;12(1):4634.
doi: 10.1038/s41467-021-24900-4.

Endo-lysosomal Aβ concentration and pH trigger formation of Aβ oligomers that potently induce Tau missorting

Affiliations

Endo-lysosomal Aβ concentration and pH trigger formation of Aβ oligomers that potently induce Tau missorting

Marie P Schützmann et al. Nat Commun. .

Abstract

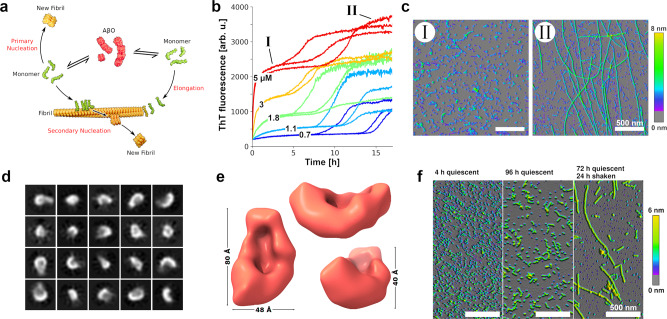
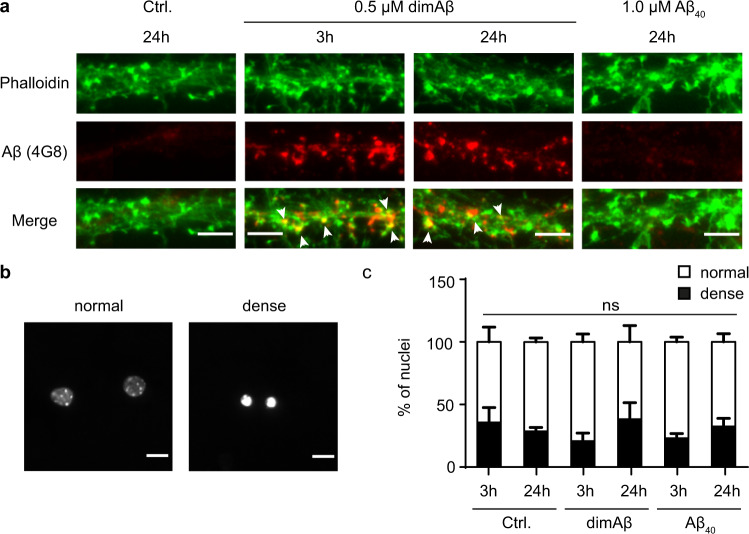
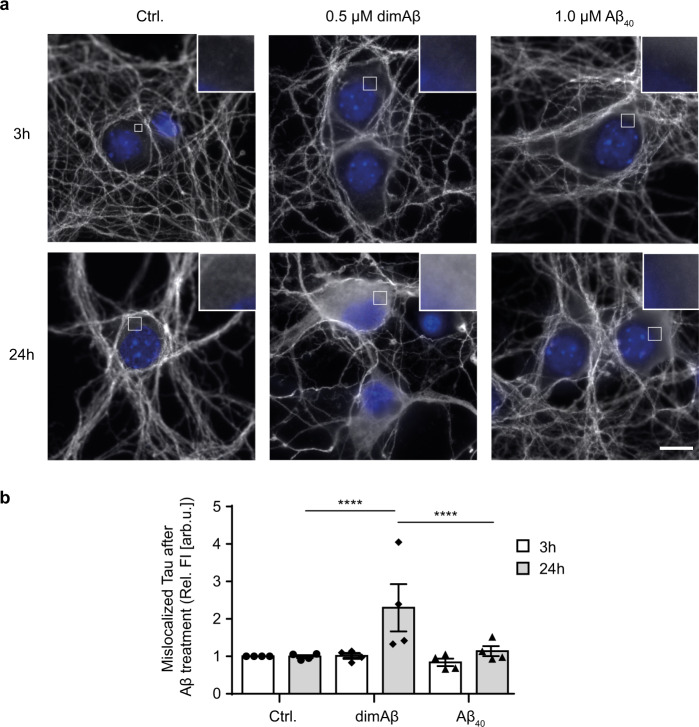
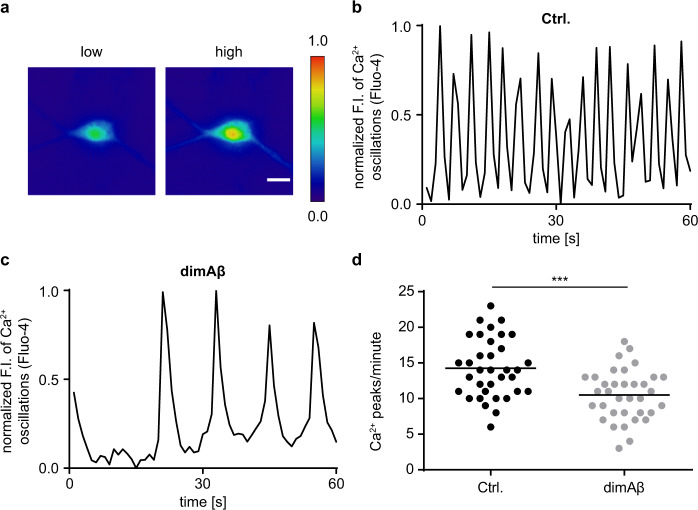
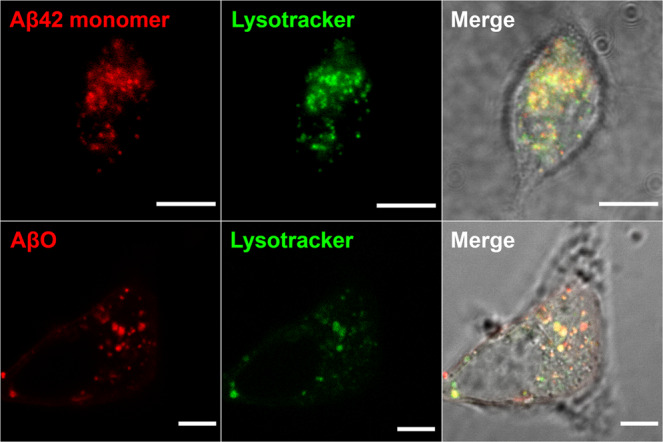
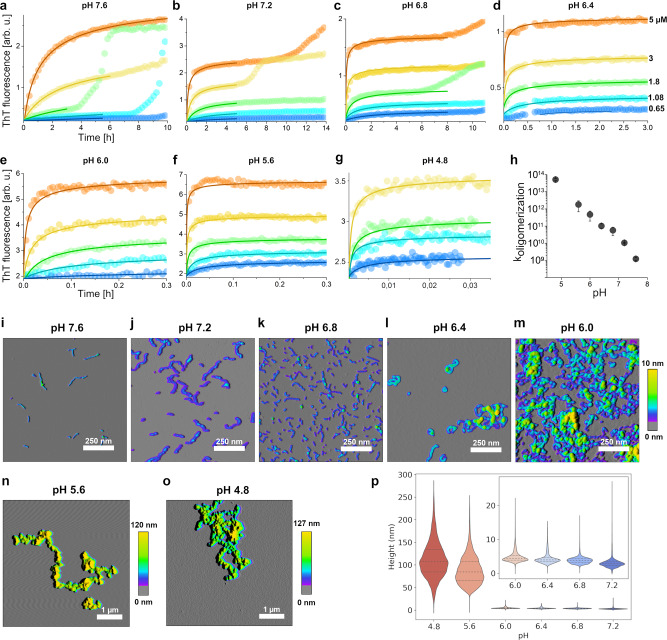
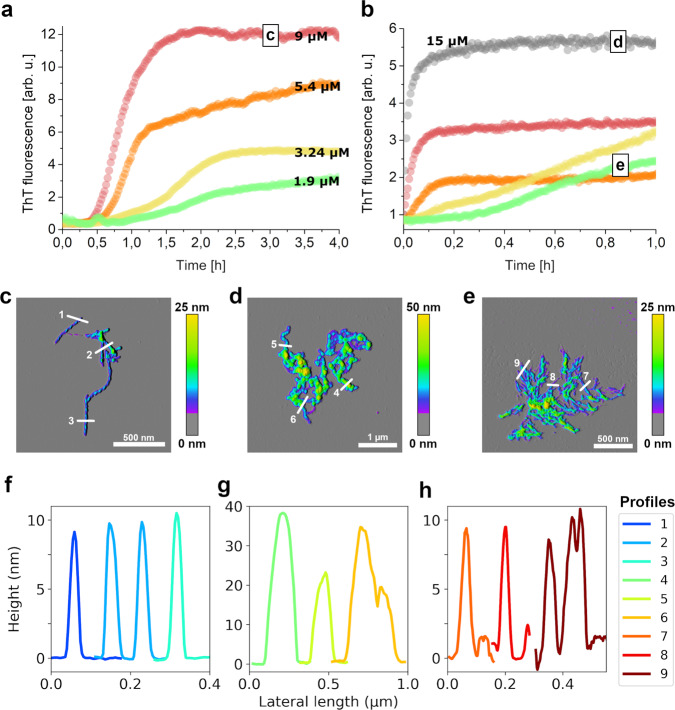
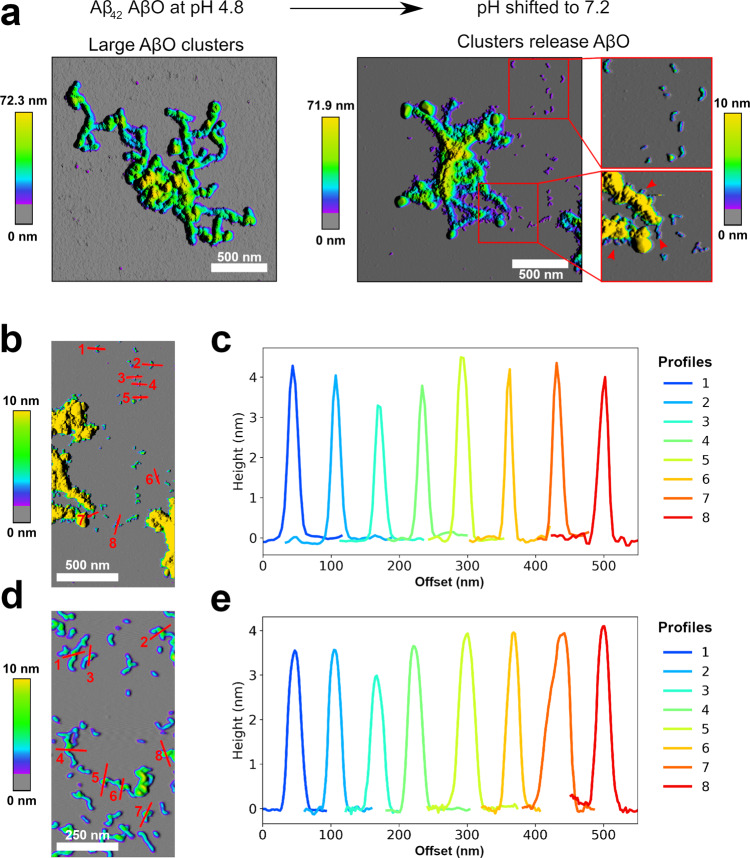
Amyloid-β peptide (Aβ) forms metastable oligomers >50 kDa, termed AβOs, that are more effective than Aβ amyloid fibrils at triggering Alzheimer's disease-related processes such as synaptic dysfunction and Tau pathology, including Tau mislocalization. In neurons, Aβ accumulates in endo-lysosomal vesicles at low pH. Here, we show that the rate of AβO assembly is accelerated 8,000-fold upon pH reduction from extracellular to endo-lysosomal pH, at the expense of amyloid fibril formation. The pH-induced promotion of AβO formation and the high endo-lysosomal Aβ concentration together enable extensive AβO formation of Aβ42 under physiological conditions. Exploiting the enhanced AβO formation of the dimeric Aβ variant dimAβ we furthermore demonstrate targeting of AβOs to dendritic spines, potent induction of Tau missorting, a key factor in tauopathies, and impaired neuronal activity. The results suggest that the endosomal/lysosomal system is a major site for the assembly of pathomechanistically relevant AβOs.


Conflict of interest statement

The authors declare no competing interests.

Figures

Fig. 1
Fig. 1. AβOs assemble from dimAβ in a lag-free oligomerization reaction.
a Scheme of AβO and amyloid fibril formation. b Biphasic assembly kinetics of dimAβ at pH 7.4 and indicated concentrations monitored by ThT fluorescence. The experimental replicates illustrate the good reproducibility of the nucleation-free oligomerization phase and the stochastic nature of the nucleation-dependent fibril growth phase. c AFM images corresponding to the two kinetic phases as indicated in b. d Exemplary 2D classes of the smallest dimAβ AβO species observed in cryo-EM micrographs. e 3D density reconstruction of this dimAβ AβO species at a resolution of 17 Å by cryo-EM. The comparatively low resolution is due to the small size and high degree of heterogeneity of the dimAβ AβO species. Consequently, only a rough estimate to size and volume can be made. f AFM images of dimAβ assemblies formed upon incubation at pH 7.4 in microcentrifuge tubes. Kinetics data as shown in b was obtained from at least three independently prepared assays with two to three replicates for each concentration for reproducibility. AFM images in c were prepared from two independent assays and at least three areas at different positions on the mica surface were scanned. The experiment in f was done once and at least two sections of the mica surface were scanned.
Fig. 2
Fig. 2. DimAβ AβOs bind to dendrites and postsynaptic spines but have no direct cytotoxic effect on primary mouse neurons.
Primary mouse neurons (DIV15–22) were treated with 0.5 µM dimAβ AβOs or 1 µM Aβ40 for 3 and 24 h. a DimAβ AβOs localized to neuronal dendrites both after 3 and 24 h of treatment, where they partially co-localized with phalloidin, a marker for synaptic spines. Arrows indicate co-localization of dimAβ with phalloidin. Scale bar, 5 µm. The experiment was independently repeated four times with similar results. b Nuclei of primary neurons were stained with NucBlue and analyzed with respect to shape and size. Representative images of normal and dense nuclei. Scale bar, 10 µm. c Quantification of normal and dense nuclei of primary neurons after vehicle control, Aβ40, or dimAβ AβO treatment revealed no direct cytotoxicity. N = 3; around 300 nuclei were analyzed for each condition. Error bars represent SEM. Statistical analysis was done by two-way ANOVA with Tukey’s test for multiple comparisons and yielded no significant differences between the experimental groups.
Fig. 3
Fig. 3. DimAβ AβOs induce pathological somatodendritic missorting of Tau.
Primary mouse neurons (DIV15–22) were treated with 0.5 µM dimAβ AβOs or 1 µM Aβ40 for 3 and 24 h. a Representative images of cell bodies of primary neurons after treatment with Aβ. Neurons were stained with anti-Tau (K9JA) antibody; nuclei were stained with NucBlue. DimAβ AβO-treated neurons show strong enrichment of fluorescence signal of Tau in the soma only after 24 h of treatment. Insets show magnification of white boxed areas in the somata. Scale bar, 10 µm. b Quantification of Tau enrichment in the soma of primary neurons. Fluorescence intensities of cell bodies were quantified and normalized to control-treated neurons after 3 h of treatment. N = 4, 30 cells were analyzed for each condition. Error bars represent SEM. Statistical analysis was done by two-way ANOVA with Tukey’s test for multiple comparisons. Statistical significance: ****p < 0.0001.
Fig. 4
Fig. 4. DimAβ AβOs decrease spontaneous calcium oscillations of primary mouse neurons.
Primary mouse neurons (DIV15–22) were treated with 0.5 µM dimAβ AβOs for 24 h. Cells were labeled with calcium-sensitive Fluo-4 dye and spontaneous calcium oscillations were recorded by time‐lapse movies. a Representative ratiometric images of low and high calcium concentrations in the soma of a neuron. Scale bar, 20 µm. b, c Representative graphs of spontaneous Ca2+ oscillations in b vehicle control- and c dimAβ AβO-treated primary neurons. Fluorescence intensities were normalized to minimum values and plotted over time. d Quantification of spontaneous Ca2+ oscillations in primary neurons after vehicle control or dimAβ AβO treatment. Fluorescence intensities were normalized to minimum values and peaks per minute were counted for each sample. In total, 35 cells were analyzed; statistical analysis was done by two-tailed unpaired t test. Statistical significance: ***p = 0.0001.
Fig. 5
Fig. 5. Aβ42 and dimAβ AβOs accumulate in endosomes/lysosomes.
SH-SY5Y cells were treated with Aβ42 monomers (top row) or dimAβ AβOs (bottom row) and co-localization with endo-lysosomal compartments was analyzed. 1.1 µM Aβ42 (containing 9% HiLyte 647-labeled Aβ42, top row) or 1.1 µM dimAβ AβOs (in monomer equivalents, formed from a dimAβ solution containing 9% AbberiorStar 520SXP-labeled dimAβ, bottom row) were added to the cells. After 24 h, the medium was exchanged with fresh medium supplemented with 50 nM Yellow HCK-123 LysoTracker dye. Scale bar, 5 µm. N = 3, at least three images were acquired for each treatment to ensure reproducibility.
Fig. 6
Fig. 6. pH dependence of dimAβ assembly kinetics.
ag DimAβ assembly at concentrations between 0.65 and 5 µM and at pH values between 4.8 and 7.6 monitored by ThT fluorescence. Solid lines represent global fits to the data using a one-step oligomerization model with a shared reaction order of 3 for all pH values and concentrations and an individual oligomerization rate constant per pH value. h Logarithmic plot of the obtained oligomerization rate constants vs. pH. The rate constants were obtained from global fits to n concentration dependence data sets obtained from m independently prepared assays, with n/m being 2/2 (pH 4.8), 6/4 (pH 5.6), 8/4 (pH 6.0), 5/4 (pH 6.4), 6/2 (pH 6.8), 6/2 (pH 7.2), and 6/2 (pH 7.6). One of the n repeats is shown in ag. Replicates are given in Supplementary Fig. 8. Data points represent mean and standard deviation, except for pH 4.8, where the error bar indicates the higher and lower value of the n = 2 experiments. io AFM images of dimAβ AβO formed at different pH values. Note the dramatic change in the height scale bar upon pH decrease to <6.0 due to formation of large AβO clusters. Between 7 and 25 micrographs of at least 2 independent assays were recorded for each pH value to ensure reproducibility. p Particle height distributions determined from AFM images, displayed as violin plots. All pixels assigned to AβOs by the image analysis software in five micrographs per pH value were evaluated. Dashed lines represent medians; dotted lines represent interquartile ranges. Inset, zoom on the data for pH 6.0 to pH 7.2.
Fig. 7
Fig. 7. Aβ42 rapidly forms AβOs at endo-lysosomal pH.
a, b Aβ42 assembly at a pH 7.2 or b pH 4.5 at concentrations between 1.9 and 15 µM monitored by ThT fluorescence. Replicates are given in Supplementary Fig. 9. ce AFM images of c amyloid fibrils formed by 9 µM Aβ42 at pH 7.2, d AβOs formed by 15 µM Aβ42 at pH 4.5, and e amyloid fibril networks formed by 1.9 µM Aβ42 at pH 4.5. At least three micrographs each of two independently prepared sample repeats were recorded to ensure reproducibility of the AFM data. fh Height profiles of the sections indicated in ce.
Fig. 8
Fig. 8. Stability of AβOs formed by Aβ42 at endo-lysosomal pH after shifting to neutral pH.
a AFM images of AβOs formed by 10 µM Aβ42 at pH 4.5 before (left) and after (right) shift to pH 7.2. Red arrowheads point to a few of the sites where AβOs seem to detach from AβO clusters. In all, 3–7 micrographs were recorded per condition to ensure reproducibility. b, c Height profiles of small AβOs after pH shift to neutral pH. Height profiles in c correspond to the sections in b. d, e Height profiles of AβOs formed by 110 µM Aβ42 at pH 7.2. Height profiles in e correspond to the sections in d.
Fig. 9
Fig. 9. Scheme of intracellular APP processing, Aβ uptake, and AβO formation.
This is an extension of previous schemes of APP processing and Aβ uptake,,, now including potential formation of AβOs especially in endo-lysosomal compartments. Using a conservative estimate of the endo-lysosomal Aβ concentration of 2.5 µM and assuming an endosome volume of 0.3 µm3, there are on average 450 Aβ molecules in an endosome. Protein structure images were prepared using pdb entries 1OWT, 1IYT, 1RW6, 3DXC, 4UIS, and 1SGZ. TGN trans-Golgi network.

Similar articles

Cited by

References

    1. Gremer L, et al. Fibril structure of amyloid-β(1-42) by cryo-electron microscopy. Science. 2017;358:116–119. doi: 10.1126/science.aao2825. - DOI - PMC - PubMed
    1. Kollmer M, et al. Cryo-EM structure and polymorphism of Aβ amyloid fibrils purified from Alzheimer’s brain tissue. Nat. Commun. 2019;10:4760. doi: 10.1038/s41467-019-12683-8. - DOI - PMC - PubMed
    1. Selkoe DJ, Hardy J. The amyloid hypothesis of Alzheimer’s disease at 25 years. EMBO Mol. Med. 2016;8:595–608. doi: 10.15252/emmm.201606210. - DOI - PMC - PubMed
    1. Cline EN, Bicca MA, Viola KL, Klein WL. The Amyloid-β oligomer hypothesis: beginning of the third decade. J. Alzheimers Dis. 2018;64:S567–S610. doi: 10.3233/JAD-179941. - DOI - PMC - PubMed
    1. Ono, K. & Tsuji, M. Protofibrils of amyloid-β are important targets of a disease-modifying approach for Alzheimer’s disease. Int. J. Mol. Sci. 21, 952 (2020). - PMC - PubMed

Publication types