. 2021 Jul 30;12(1):4643.
doi: 10.1038/s41467-021-24810-5.

Stress-primed secretory autophagy promotes extracellular BDNF maturation by enhancing MMP9 secretion

Affiliations

Stress-primed secretory autophagy promotes extracellular BDNF maturation by enhancing MMP9 secretion

Silvia Martinelli et al. Nat Commun. .

Abstract

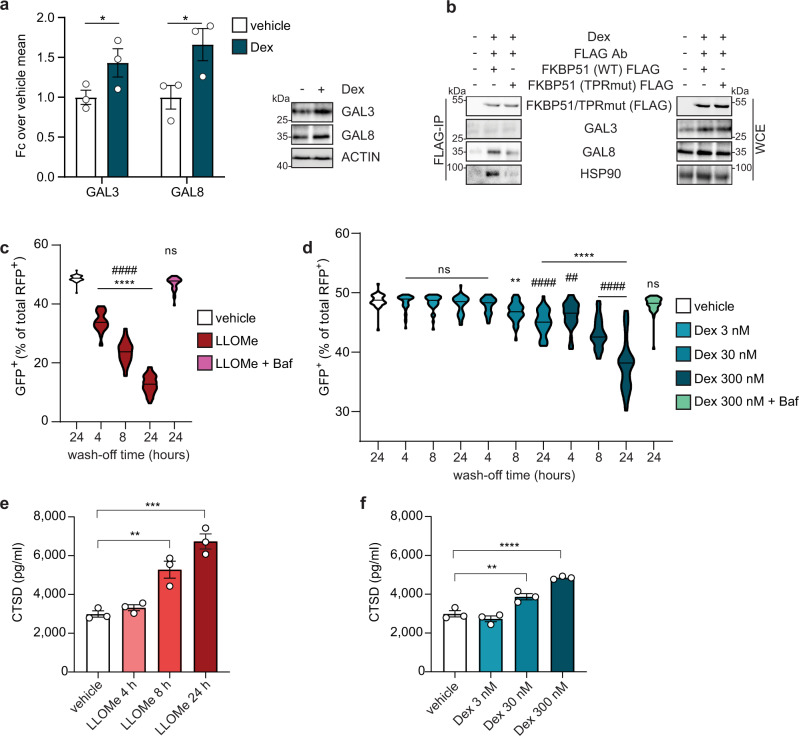
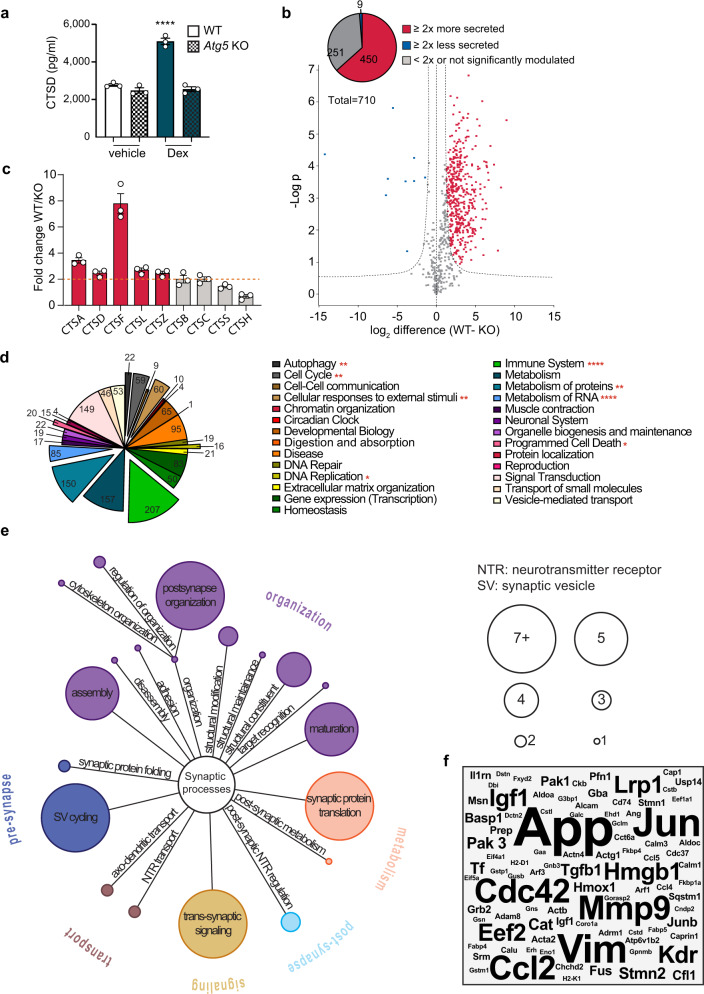
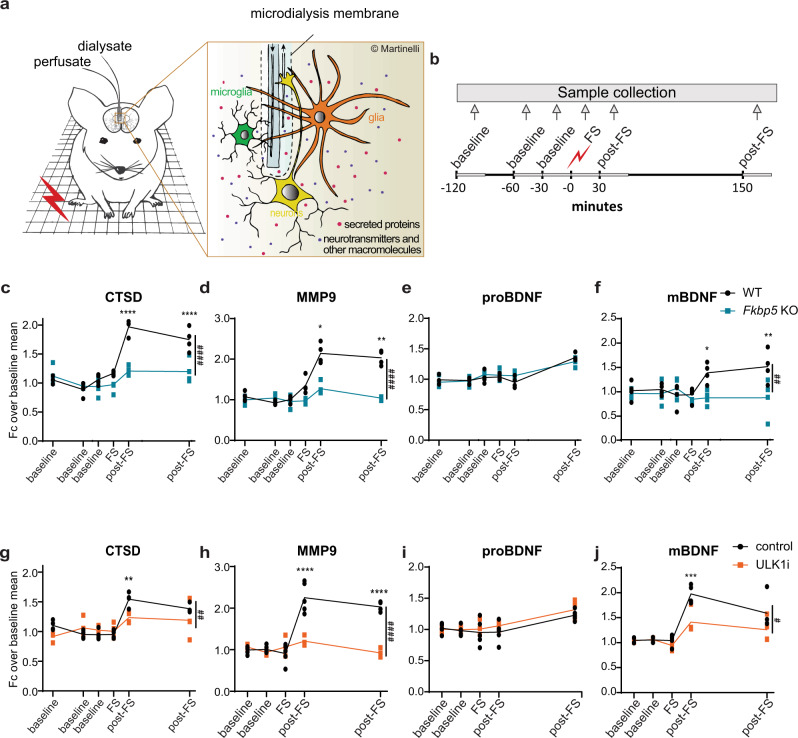
The stress response is an essential mechanism for maintaining homeostasis, and its disruption is implicated in several psychiatric disorders. On the cellular level, stress activates, among other mechanisms, autophagy that regulates homeostasis through protein degradation and recycling. Secretory autophagy is a recently described pathway in which autophagosomes fuse with the plasma membrane rather than with lysosomes. Here, we demonstrate that glucocorticoid-mediated stress enhances secretory autophagy via the stress-responsive co-chaperone FK506-binding protein 51. We identify the matrix metalloproteinase 9 (MMP9) as one of the proteins secreted in response to stress. Using cellular assays and in vivo microdialysis, we further find that stress-enhanced MMP9 secretion increases the cleavage of pro-brain-derived neurotrophic factor (proBDNF) to its mature form (mBDNF). BDNF is essential for adult synaptic plasticity and its pathway is associated with major depression and posttraumatic stress disorder. These findings unravel a cellular stress adaptation mechanism that bears the potential of opening avenues for the understanding of the pathophysiology of stress-related disorders.


Conflict of interest statement

The authors declare no competing interests.

Figures

Fig. 1
Fig. 1. FKBP51 links stress to secretory autophagy.
a Results of automated literature mining of FKBP51 interactors in association to “autophagy”, “proteostasis” and “ubiquitin-proteasome system” (UPS) or none of them. b Western blotting of FKBP51 and SEC22B in GFP-tagged SEC22B co-IP (GFP-IP) and whole-cell extract (WCE) as control; c Western blotting of FKBP51 and SEC22B in FLAG-tagged FKBP51 co-IP (FLAG-IP) and WCE as control. d Western blotting of FKBP51, TRIM16, LC3B, and CTSD in FLAG-tagged FKBP51 co-IP (FLAG-IP) and WCE as control. e Western blotting for TRIM16, CTSD, and SEC22B in FLAG-tagged TRIM16 co-IP (FLAG-IP) and WCE as control performed in WT and FKBP5 KO SH-SY5Y cells. f Quantifications of e with n = 3 biologically independent samples. g Western blotting of TRIM16, CTSD, and SEC22B in FLAG-tagged TRIM16 co-IP (FLAG-IP) and WCE as control performed in cells treated with 100 nM dexamethasone or vehicle for 4 h. h Quantifications of g with n = 3 biologically independent samples. i Western blotting for FKBP51, SNAP23, SNAP29, STX3, and STX4 in FLAG-tagged FKBP51 co-IP (FLAG-IP) and WCE as control. j Western blotting of SEC22B, SNAP23, SNAP29, STX3, and STX4 in GFP-tagged SEC22B co-IP (GFP-IP) and WCE as control performed in WT and FKBP5 KO cells treated with 100 nM dexamethasone or vehicle for 4 h. k Quantifications of j with n = 3 biologically independent samples. bk All experiments were performed in SH-SY5Y cells. l Schematic model of the interactions of FKBP51 in the secretory autophagy pathway. Unpaired, one-tailed t-tests were performed for all quantifications; ns not significant, **P < 0.01, ***P < 0.001. Data shown as mean ± s.e.m. Ab antibody, Fc fold change.
Fig. 2
Fig. 2. FKBP51 mediates regulatory mechanisms underlying secretory autophagy.
a Quantification of western blot analyses and representative blots of GAL3 and GAL8 normalized to actin from WT cells treated with 100 nM dexamethasone (Dex) or vehicle for 4 h. n = 3 biologically independent samples. Unpaired, one-tailed t-tests were performed; *p < 0.05. Data shown as mean ± s.e.m. b Western blotting of FKBP51, GAL3, GAL8, and HSP90 in FLAG-tagged WT or mutant (TPRmut) FKBP51 co-IP (FLAG-IP) and whole cell extract (WCE) as control performed in cells treated with 100 nM dexamethasone or vehicle. c, d Quantification of GFP+ puncta expressed as a percentage of total RFP+ puncta in cells (n = 40 cells per group) transfected with tfGal3 construct and treated with 1 mM LLOMe or 300 nM dexamethasone (Dex) for 3 h, followed by 4, 8, and 24 h wash-off, and with co-treatment of bafilomycin (Baf) for 3 h followed by 24 h wash-off. Kruskal–Wallis multiple comparison test was performed; **P < 0.01; ****P < 0.0001. Asterisk symbol indicates comparisons to vehicle; hash symbol indicates comparisons to treatment + Baf. ad All experiments were performed in SH-SY5Y cells. e, f CTSD from supernatants measured via ELISA after SIM-A9 cells were treated with LLOMe for 4, 8, and 24 h or vehicle for 24 h, or with 3, 30, and 300 nM Dex or vehicle for 4 h. n = 3 per group. Tukey’s multiple comparison test was performed; **P < 0.01; ***P < 0.001; ****P < 0.0001. Only significant comparisons are shown. Data shown as mean ± s.e.m. Fc fold change, Ab antibody.
Fig. 3
Fig. 3. Detection of novel cargo proteins regulated by stress-induced secretory autophagy.
a CTSD from supernatants measured with ELISA after WT or Atg5 KO SIM-A9 cells were treated with 300 nM dexamethasone (Dex) or vehicle for 4 h. Tukey’s multiple comparison test was performed; ****p < 0.0001. Significance refers to WT Dex compared to every other condition. Data shown as mean ± s.e.m. of n = 3 biologically independent samples. b Volcano plot representation of a multiple t-test analysis of the secretome in which each dot represents the replicates’ mean (difference of WT-Atg5 KO); FDR = 0.01, s0 = 1 of n = 3 biologically independent samples. c Secretion levels of detected cathepsins indicated as fold change of WT over Atg5 KO. Data shown as mean ± s.e.m. of n = 3 biologically independent samples. d GO results performed with Reactome. e GO results performed with SynGO. f Word cloud representation of automated literature mining results in association with “neuroplasticity”.
Fig. 4
Fig. 4. Stress enhances mBDNF production promoting proBDNF cleavage via MMP9.
a MMP9, b proBDNF, c mBDNF levels from supernatants measured via ELISA after WT or Atg5 KO SIM-A9 cells were treated with 300 nM dexamethasone (Dex) or vehicle for 4 h. d MMP9, e proBDNF, f mBDNF levels from supernatants measured via ELISA after WT SIM-A9 cells were treated with 300 nM Dex, Dex + MMP9 inhibitor I (MMP9i), or vehicle for 4 h. g CTSD, h MMP9, i proBDNF, and j mBDNF levels from supernatants measured with ELISA after WT SIM-A9 cells were transfected with FKBP51 expressing plasmid (ect. FKBP51) or control vector. k CTSD, l MMP9, m proBDNF, n mBDNF levels from supernatants measured via ELISA after WT SIM-A9 cells were treated with vehicle, SAFit, 300 nM dexamethasone (Dex), and 300 nM Dex + SAFit for 4 h. For d, Mann–Whitney, one-tailed test; for g, i, j unpaired, one-tailed t-tests and for h unpaired, one-tailed Welch’s test were performed; for all the others, Tukey’s multiple comparison test was used; *p < 0.05; **p < 0.01; ***p < 0.001; ****p < 0.0001. Only significant comparisons are shown. Data shown as mean ± s.e.m. n = 3 biologically independent samples.
Fig. 5
Fig. 5. Stress enhances secretory autophagy and increases the mBDNF/proBDNF ratio in vivo.
a Schematic overview of in vivo microdialysis. b Experimental design and timeline; each sample was collected over 30 min indicated by the light gray lines. Quantifications of c CTSD, d MMP9, e proBDNF, and f mBDNF from in vivo mPFC microdialyses of WT and Fkbp5 KO mice. Quantifications of g CTSD, h MMP9, i proBDNF, and j mBDNF from in vivo mPFC microdialyses of WT mice injected intraperetoneally with ULK1 inhibitor (ULK1i) or saline. n = 4 mice per group. Two-way ANOVA with Šídák’s multiple t-test was performed; *P < 0.05; **P < 0.01; ***P < 0.001; ****P < 0.0001. Hash symbol refers to time × genotype/treatment interaction. Data shown as mean ± s.e.m. FS foot shock, Fc fold change.
Fig. 6
Fig. 6. Acute stress effects on hippocampal spine dynamics are mediated by MMP9-dependent BDNF maturation ex vivo.
a Experimental timeline of OHSC preparation, treatment and time lapse two-photon imaging of CA1. After 13–15 days in culture (DIC), OHSC are treated for 4-6 h with 1 µM Dex or vehicle and during the last 30 min additionally with 50 nM MMP9i or vehicle. After the treatment has ended, media is harvested for molecular analysis and dendrites of pyramidal neurons are imaged twice (t0 and t30 min) for capturing spine dynamics. Quantification of western blotting for b CTSD, c MMP9, d proBDNF, e mBDNF from harvested OHSC medium. Data shown as mean ± s.e.m. of n = 3 biologically independent samples. One-Way ANOVA with Tukey’s multiple comparisons test was performed. *P < 0.05; ***P < 0.001; ****P < 0.0001. f Representative time lapse images of GFP-expressing dendritic segments in hippocampal region CA1 treated with either vehicle, 1 µM Dex and Dex 1 µM + 50 nM MMP9i (scale bar 5 µm). Orange arrowheads indicate disappearing spines, while blue arrowheads indicate novel spines appearing between t0 and t30. g Quantification and Chi-square analyses of dendritic spines classified into changed and unchanged between t0 and t30. h Quantitative representation of increasing spine densities only in different conditions, expressed as percentage of total spines counted.
Fig. 7
Fig. 7. Proposed model based on the findings.
a Glucocorticoid-mediated stress induces lysosomal damage, which leads to the association of FKBP51 with the cargo receptor TRIM16 and the cargo protein (e.g., MMP9). This complex is transported on the autophagosome membrane via the interaction of FKBP51 with SEC22B. The cargo protein is internalized into the autophagosome which is transported to the plasma membrane. The vesicle-plasma membrane fusion is mediated via the SNARE-protein complex assembly, which is regulated by FKBP51 and sensitive to glucocorticoids. The membrane fusion leads to the release of the cargo proteins into the extracellular milieu. The increased secretion of extracellular MMP9 induces the cleavage of proBDNF to its mature form, which becomes the prevailing form in the extracellular space; b A first response to stress triggers lytic autophagy. In case the stress persists, a second defense line is activated which switches the stress response from lytic to secretory autophagy. If stress further persists (e.g. chronic stress), the initially beneficial proteins secreted in response to stress, might lead to neuroinflammation and psychiatric disorders.

References

    1. de Kloet ER, Joëls M, Holsboer F. Stress and the brain: from adaptation to disease. Nat. Rev. Neurosci. 2005;6:463–475. doi: 10.1038/nrn1683. - DOI - PubMed
    1. Belvederi Murri M, et al. The HPA axis in bipolar disorder: systematic review and meta-analysis. Psychoneuroendocrinology. 2016;63:327–342. doi: 10.1016/j.psyneuen.2015.10.014. - DOI - PubMed
    1. Koenig JI, Kirkpatrick B, Lee P. Glucocorticoid hormones and early brain development in schizophrenia. Neuropsychopharmacol. Publ. Am. Coll. Neuropsychopharmacol. 2002;27:309–318. doi: 10.1016/S0893-133X(01)00396-7. - DOI - PubMed
    1. Limanaqi, F. et al. Cell clearing systems bridging neuro-immunity and synaptic plasticity. Int. J. Mol. Sci. 20, 2197 (2019). - PMC - PubMed
    1. Wang Y-C, Lauwers E, Verstreken P. Presynaptic protein homeostasis and neuronal function. Curr. Opin. Genet. Dev. 2017;44:38–46. doi: 10.1016/j.gde.2017.01.015. - DOI - PubMed

Publication types