

A neural pathomics framework for classifying colorectal cancer histopathology images based on wavelet multi-scale texture analysis
- PMID: 34330946
- PMCID: PMC8324876
- DOI: 10.1038/s41598-021-94781-6
A neural pathomics framework for classifying colorectal cancer histopathology images based on wavelet multi-scale texture analysis
Abstract
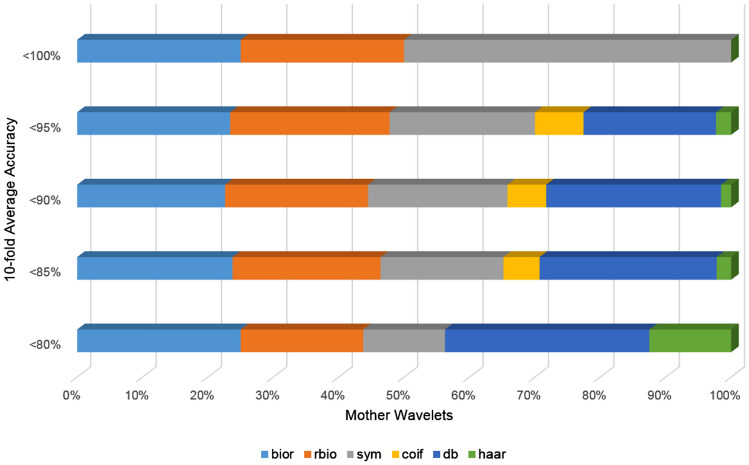
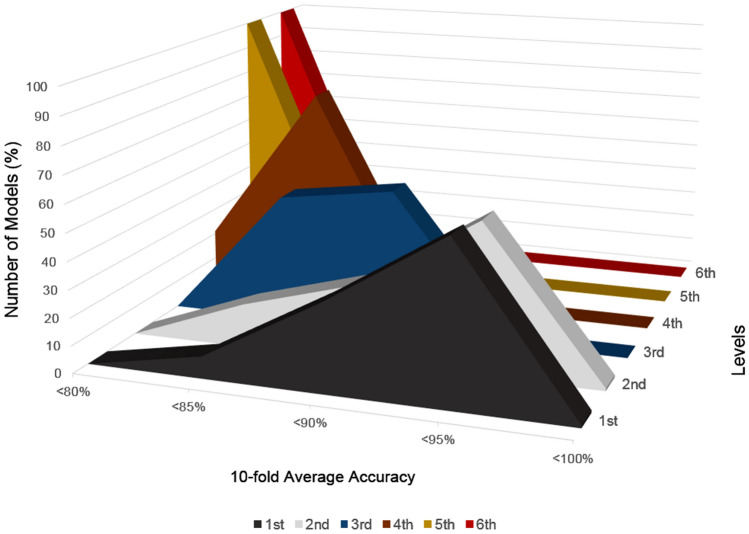
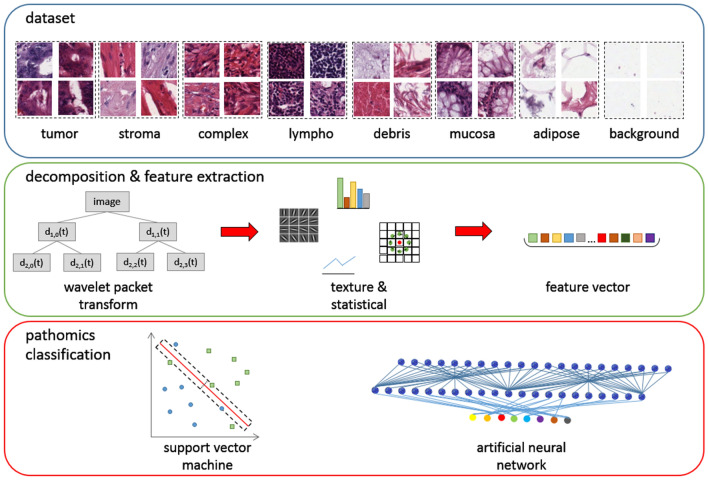
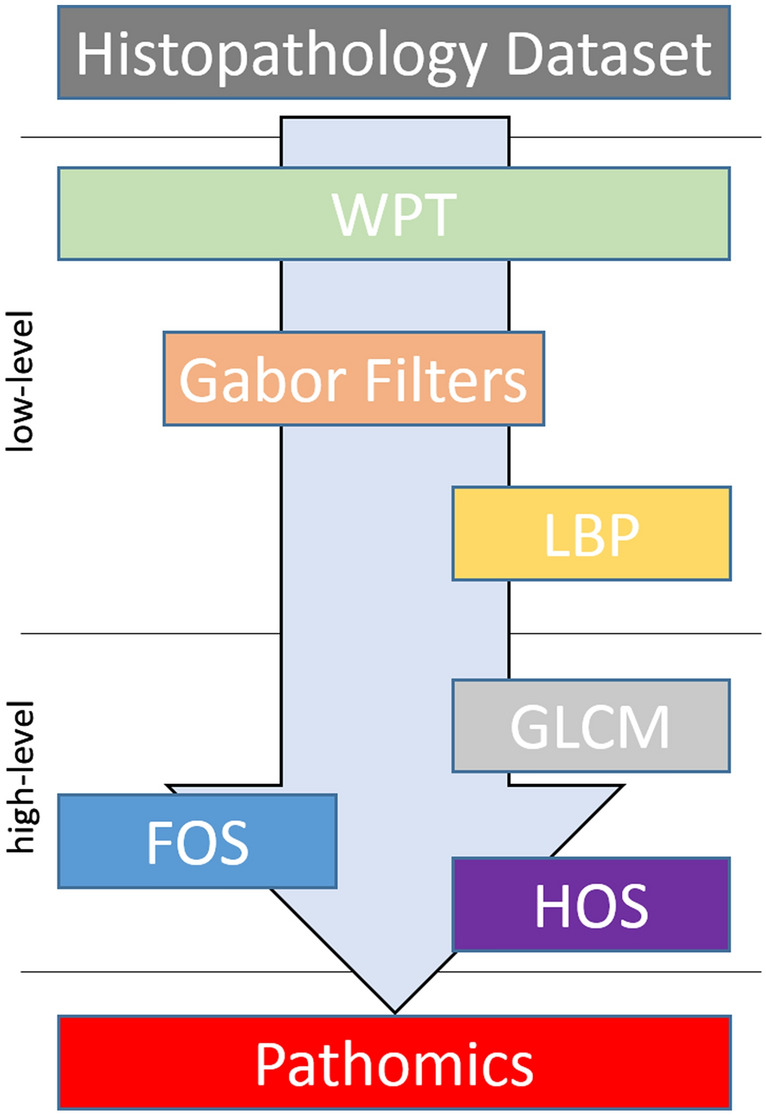
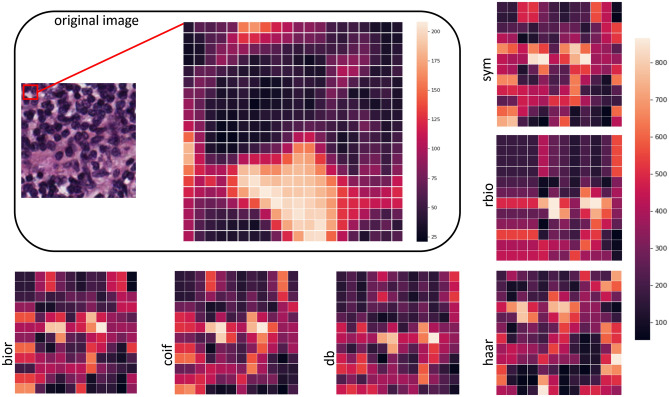
Colorectal cancer (CRC) constitutes the third most commonly diagnosed cancer in males and the second in females. Precise histopathological classification of CRC tissue pathology is the cornerstone not only for diagnosis but also for patients' management decision making. An automated system able to accurately classify different CRC tissue regions may increase diagnostic precision and alleviate clinical workload. However, tissue classification is a challenging task due to the variability in morphological and textural characteristics present in histopathology images. In this study, an artificial neural network was trained to classify between eight classes of CRC tissue image patches derived from a public dataset with 5000 CRC histopathology image tiles. A total of 532 multi-level pathomics features examined at different scales were extracted by visual descriptors such as local binary patterns, wavelet transforms and Gabor filters. An exhaustive evaluation involving a variety of wavelet families and parameters was performed in order to shed light on the impact of scale on pathomics based CRC tissue differentiation. Our model achieved a performance accuracy of 95.3% with tenfold cross validation demonstrating superior performance compared to 87.4% reported in recent studies. Furthermore, we experimentally showed that the first and the second levels of the wavelet approximations can be used without compromising classification performance.
© 2021. The Author(s).
Conflict of interest statement
The authors declare no competing interests.
Figures
References
-
- Ferro CJS, Warner TA. Scale and texture in digital image classification. Photogramm. Eng. Remote Sensing. 2002;68:51–63.
-
- de Siqueira FR, RobsonSchwartz W, Pedrini H. Multi-scale gray level co-occurrence matrices for texture description. Neurocomputing. 2013;120:336–345. doi: 10.1016/j.neucom.2012.09.042. - DOI
-
- Gao, R. X. & Yan, R. Wavelet Packet Transform. in Wavelets 69–81 (Springer, 2011). 10.1007/978-1-4419-1545-0_5.
-
- Sharma, S., Jain, S. & Bhusri, S. Classification of breast lesions using gabor wavelet filter for three classes. in 4th International Conference on “Computing for Sustainable Global Development” 6282–6284 (2017).
Publication types
MeSH terms
LinkOut - more resources
Full Text Sources
Medical
