

Protein structure prediction using deep learning distance and hydrogen-bonding restraints in CASP14
- PMID: 34331351
- PMCID: PMC8616857
- DOI: 10.1002/prot.26193
Protein structure prediction using deep learning distance and hydrogen-bonding restraints in CASP14
Abstract
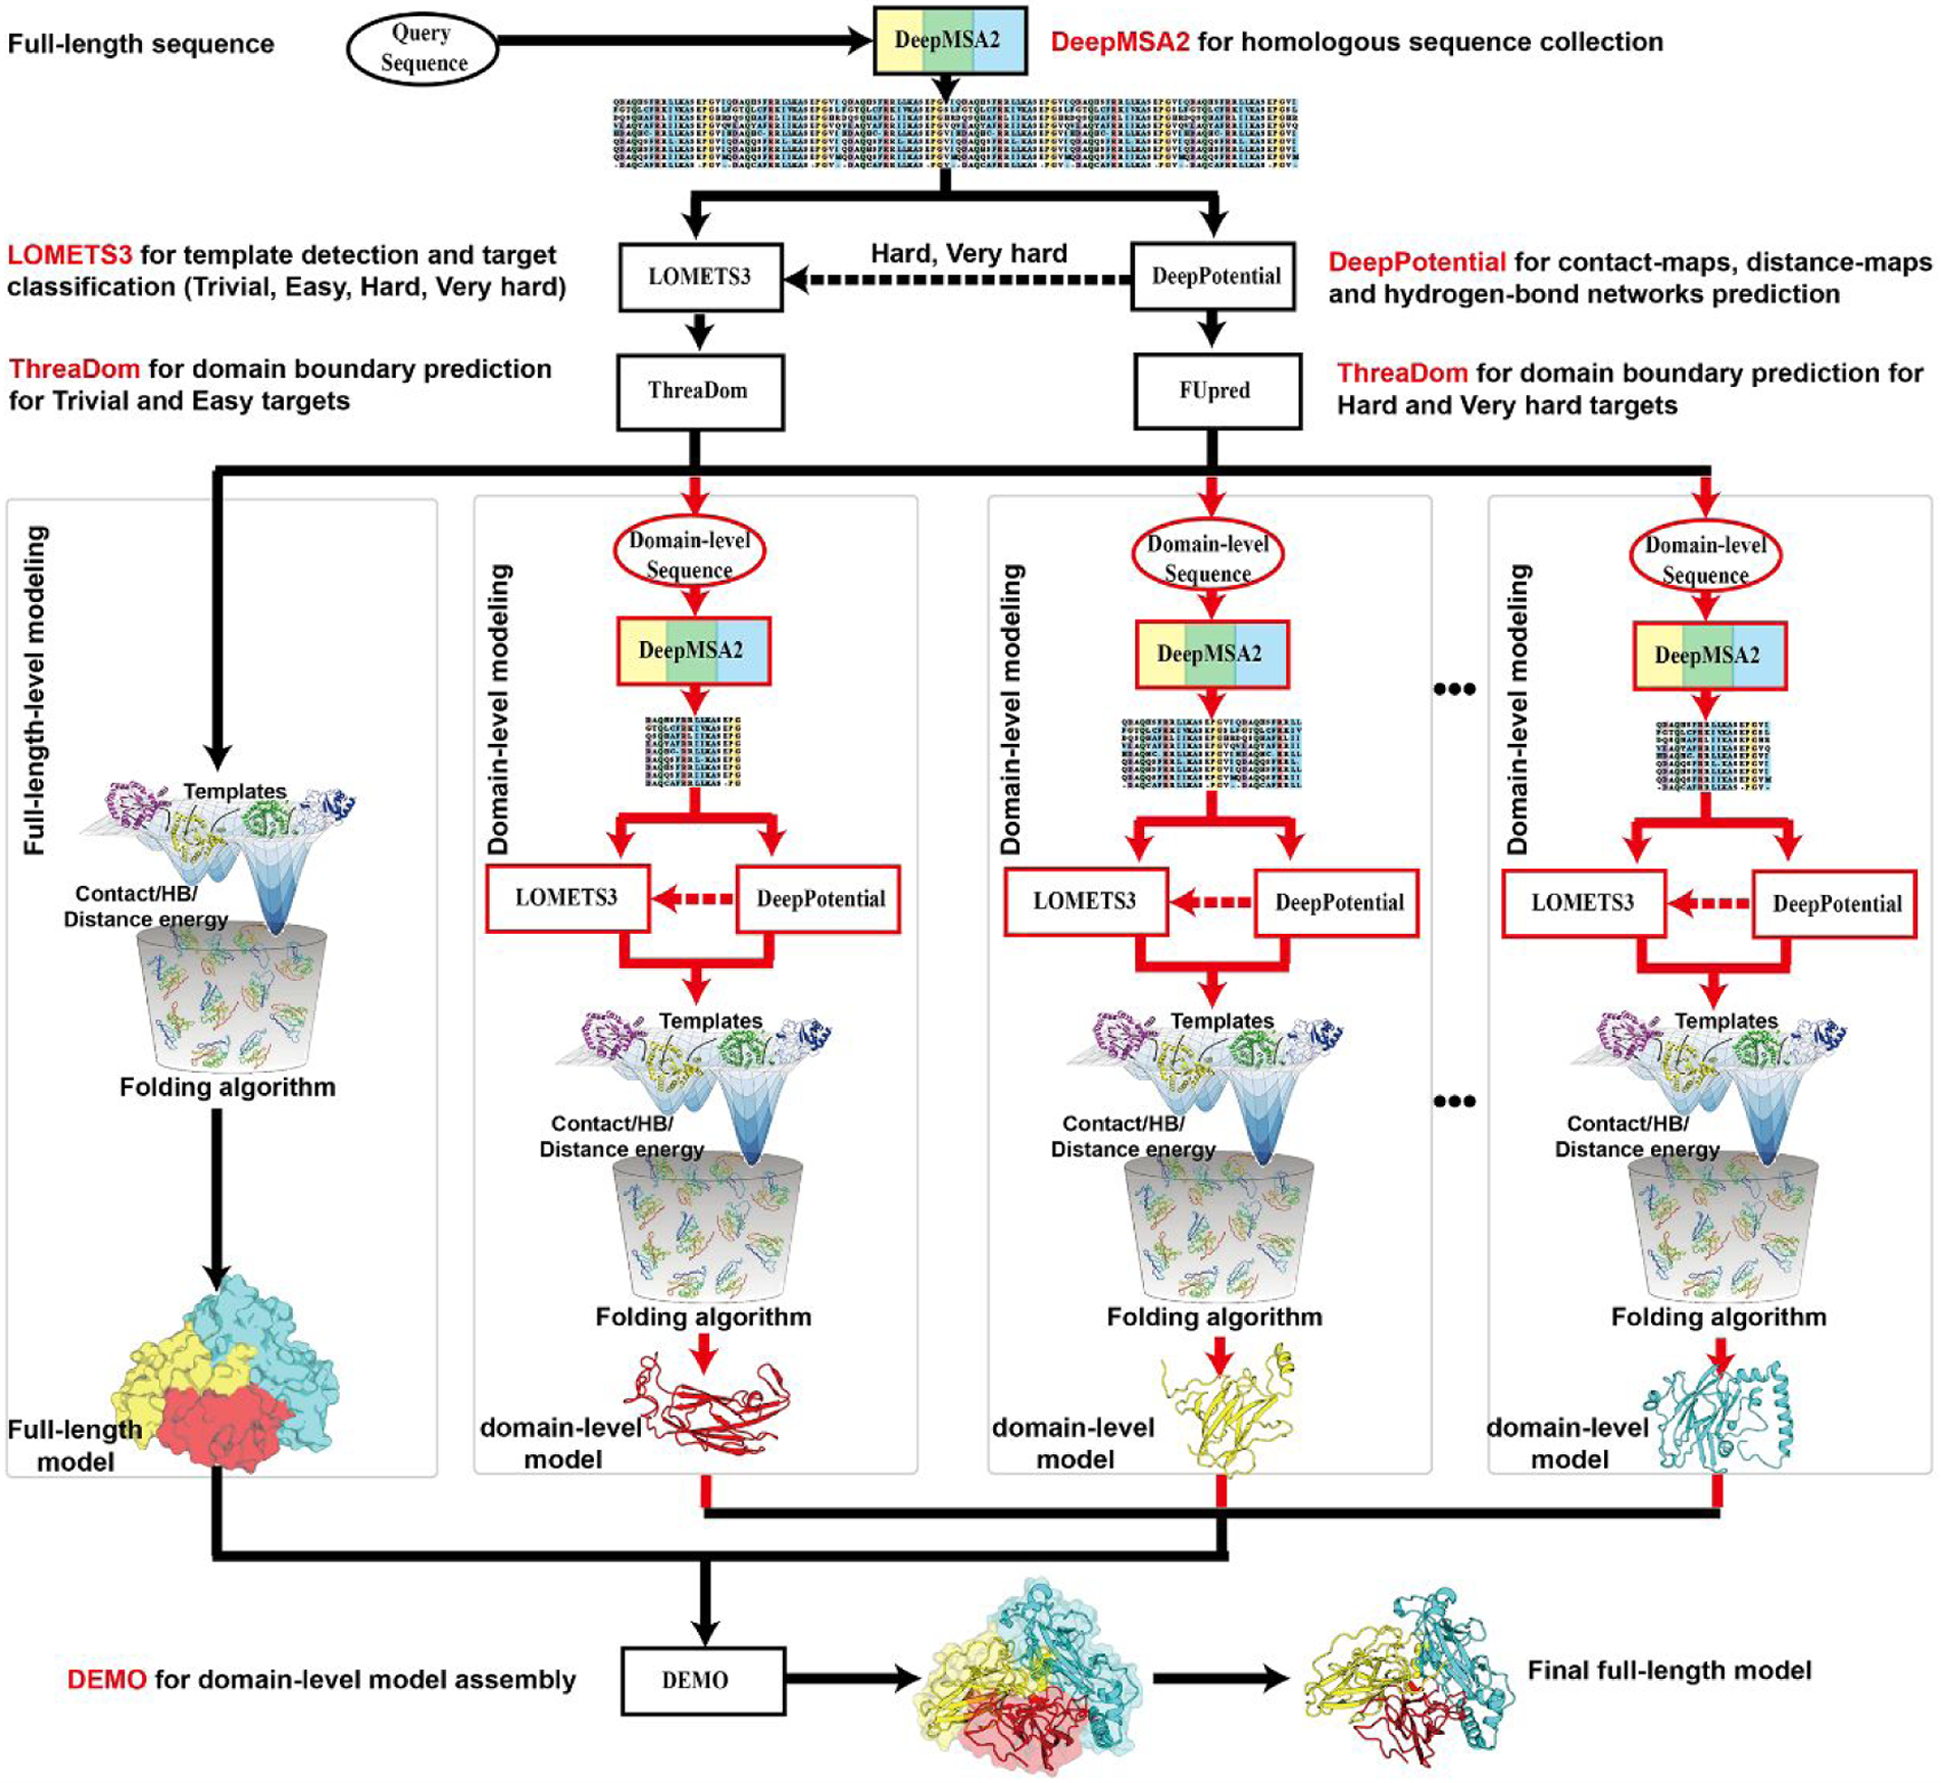
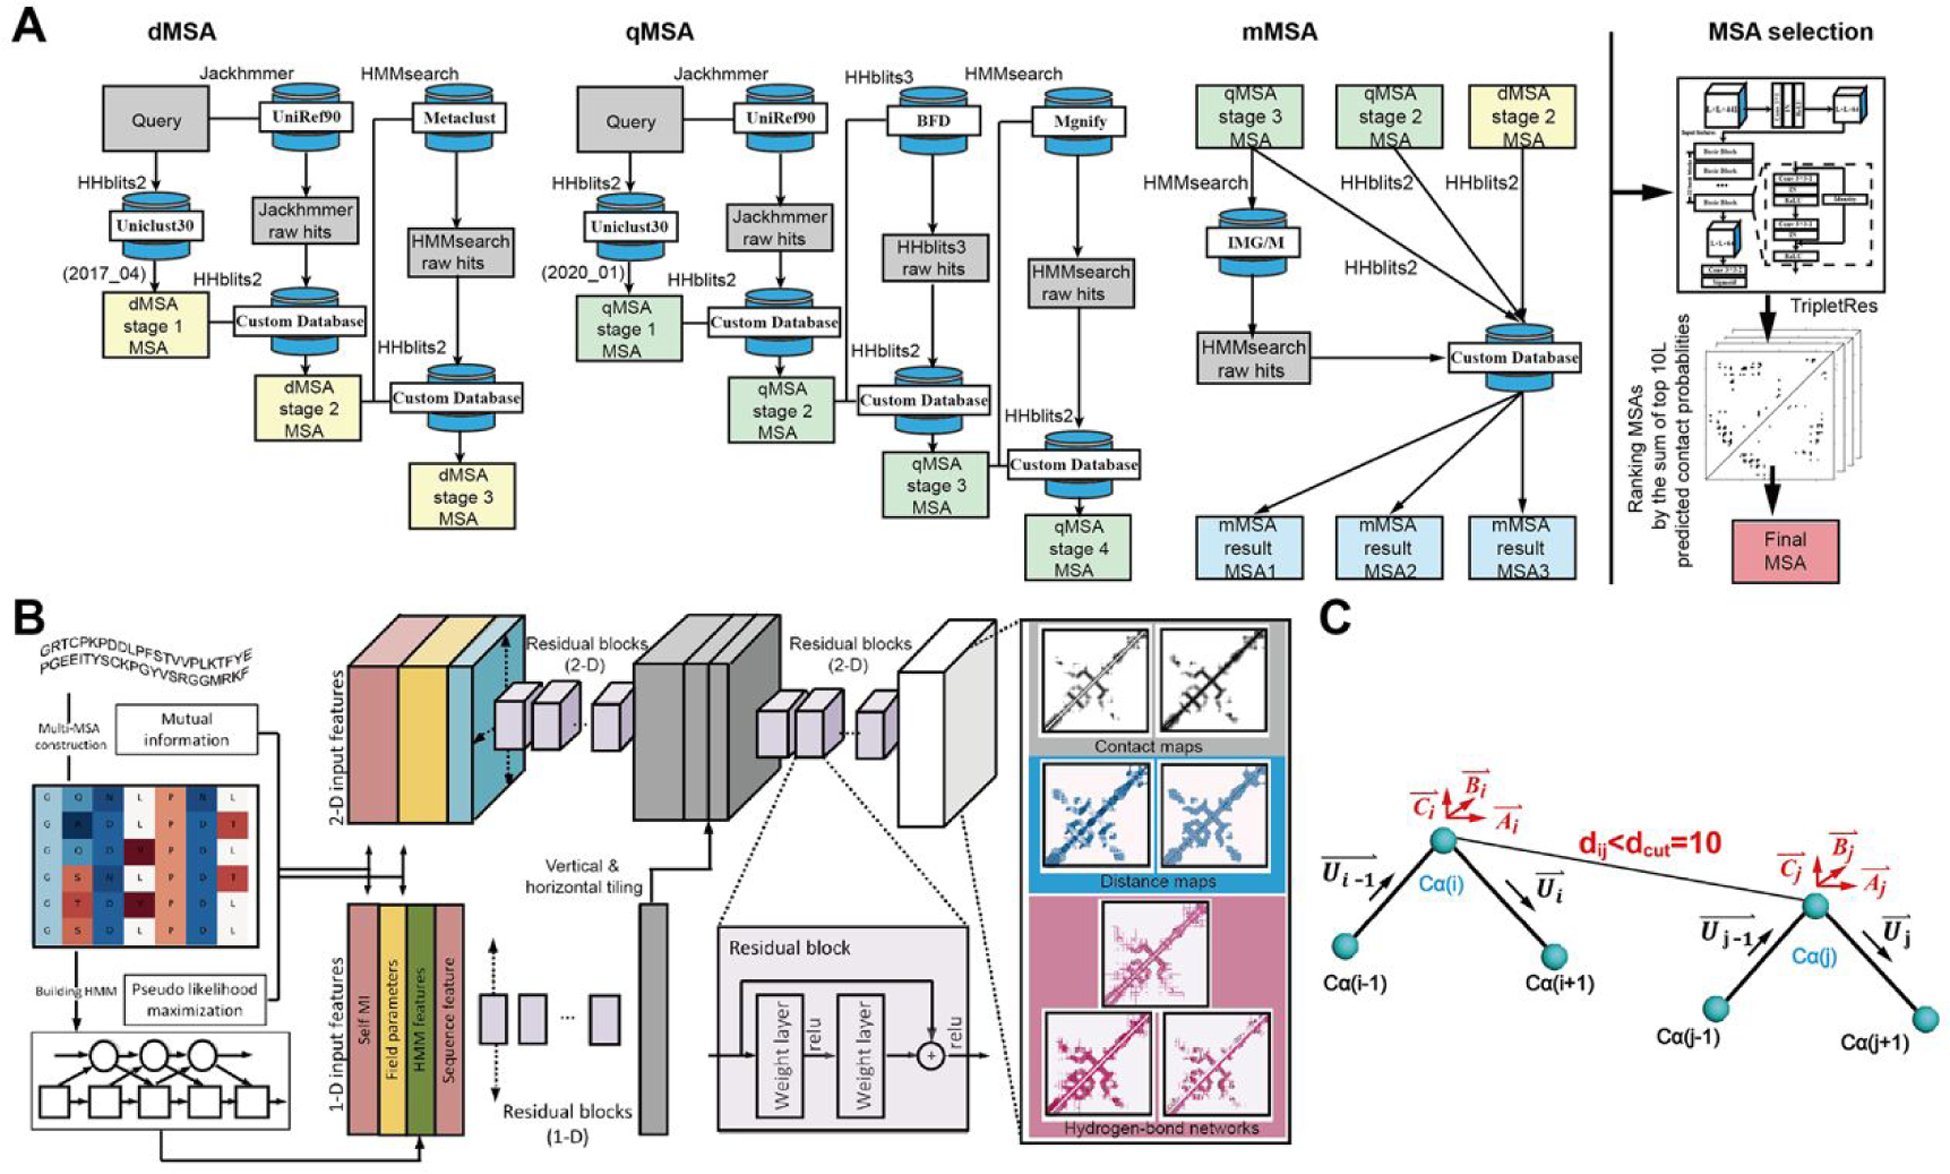
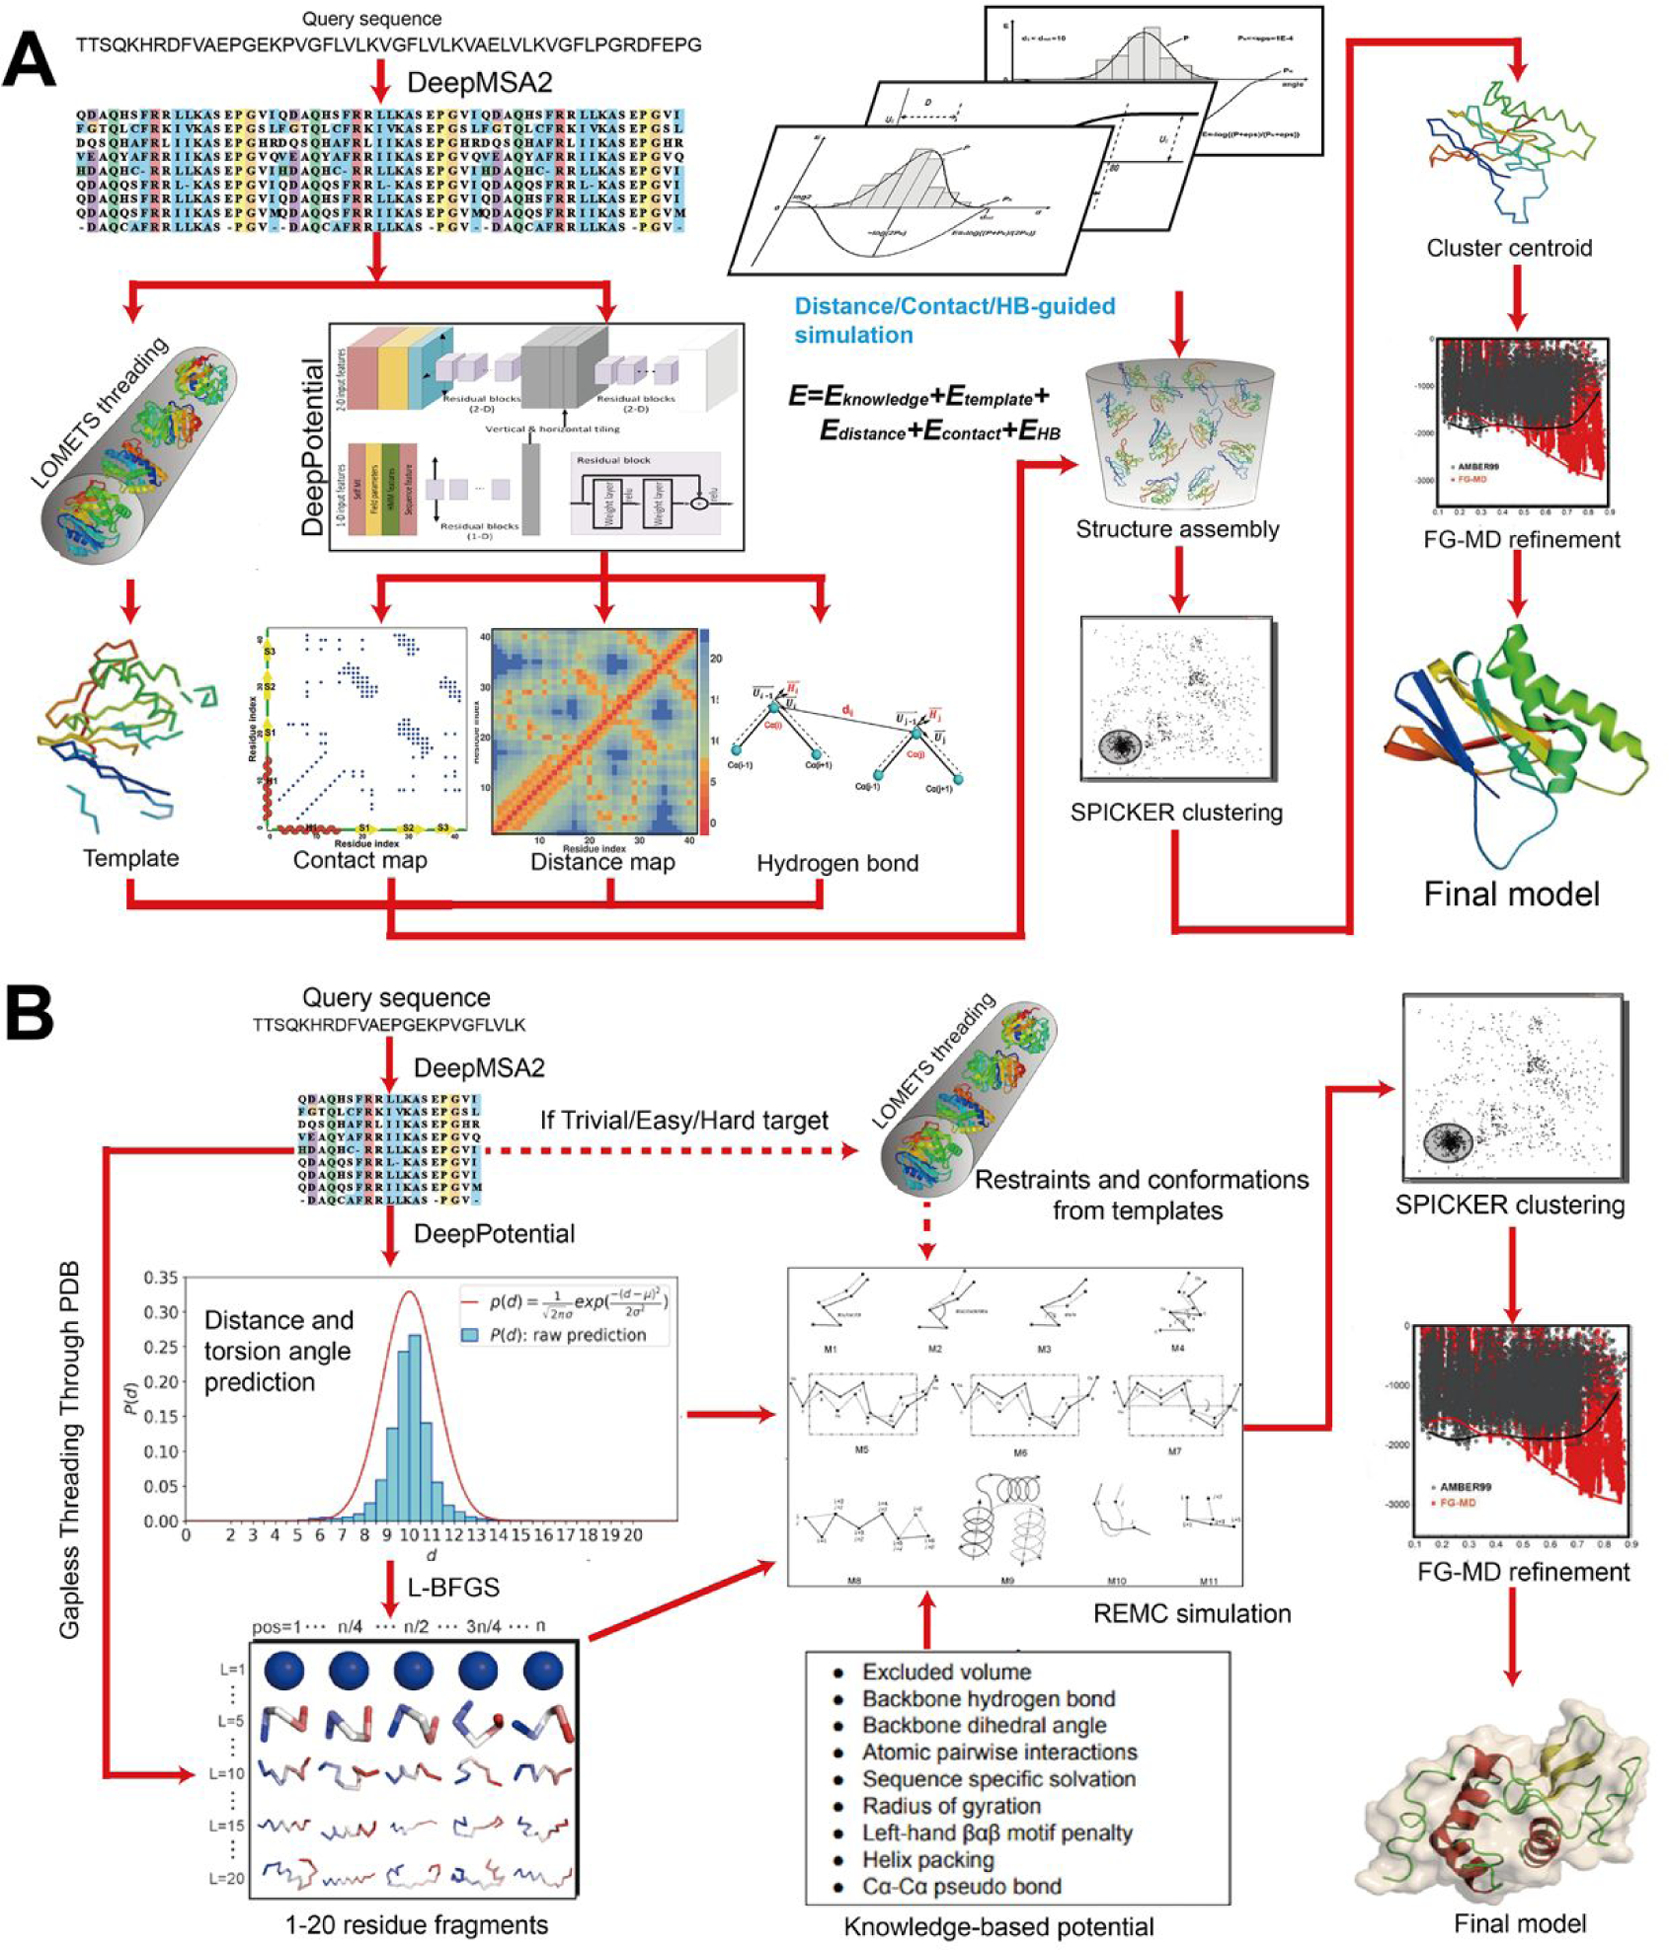
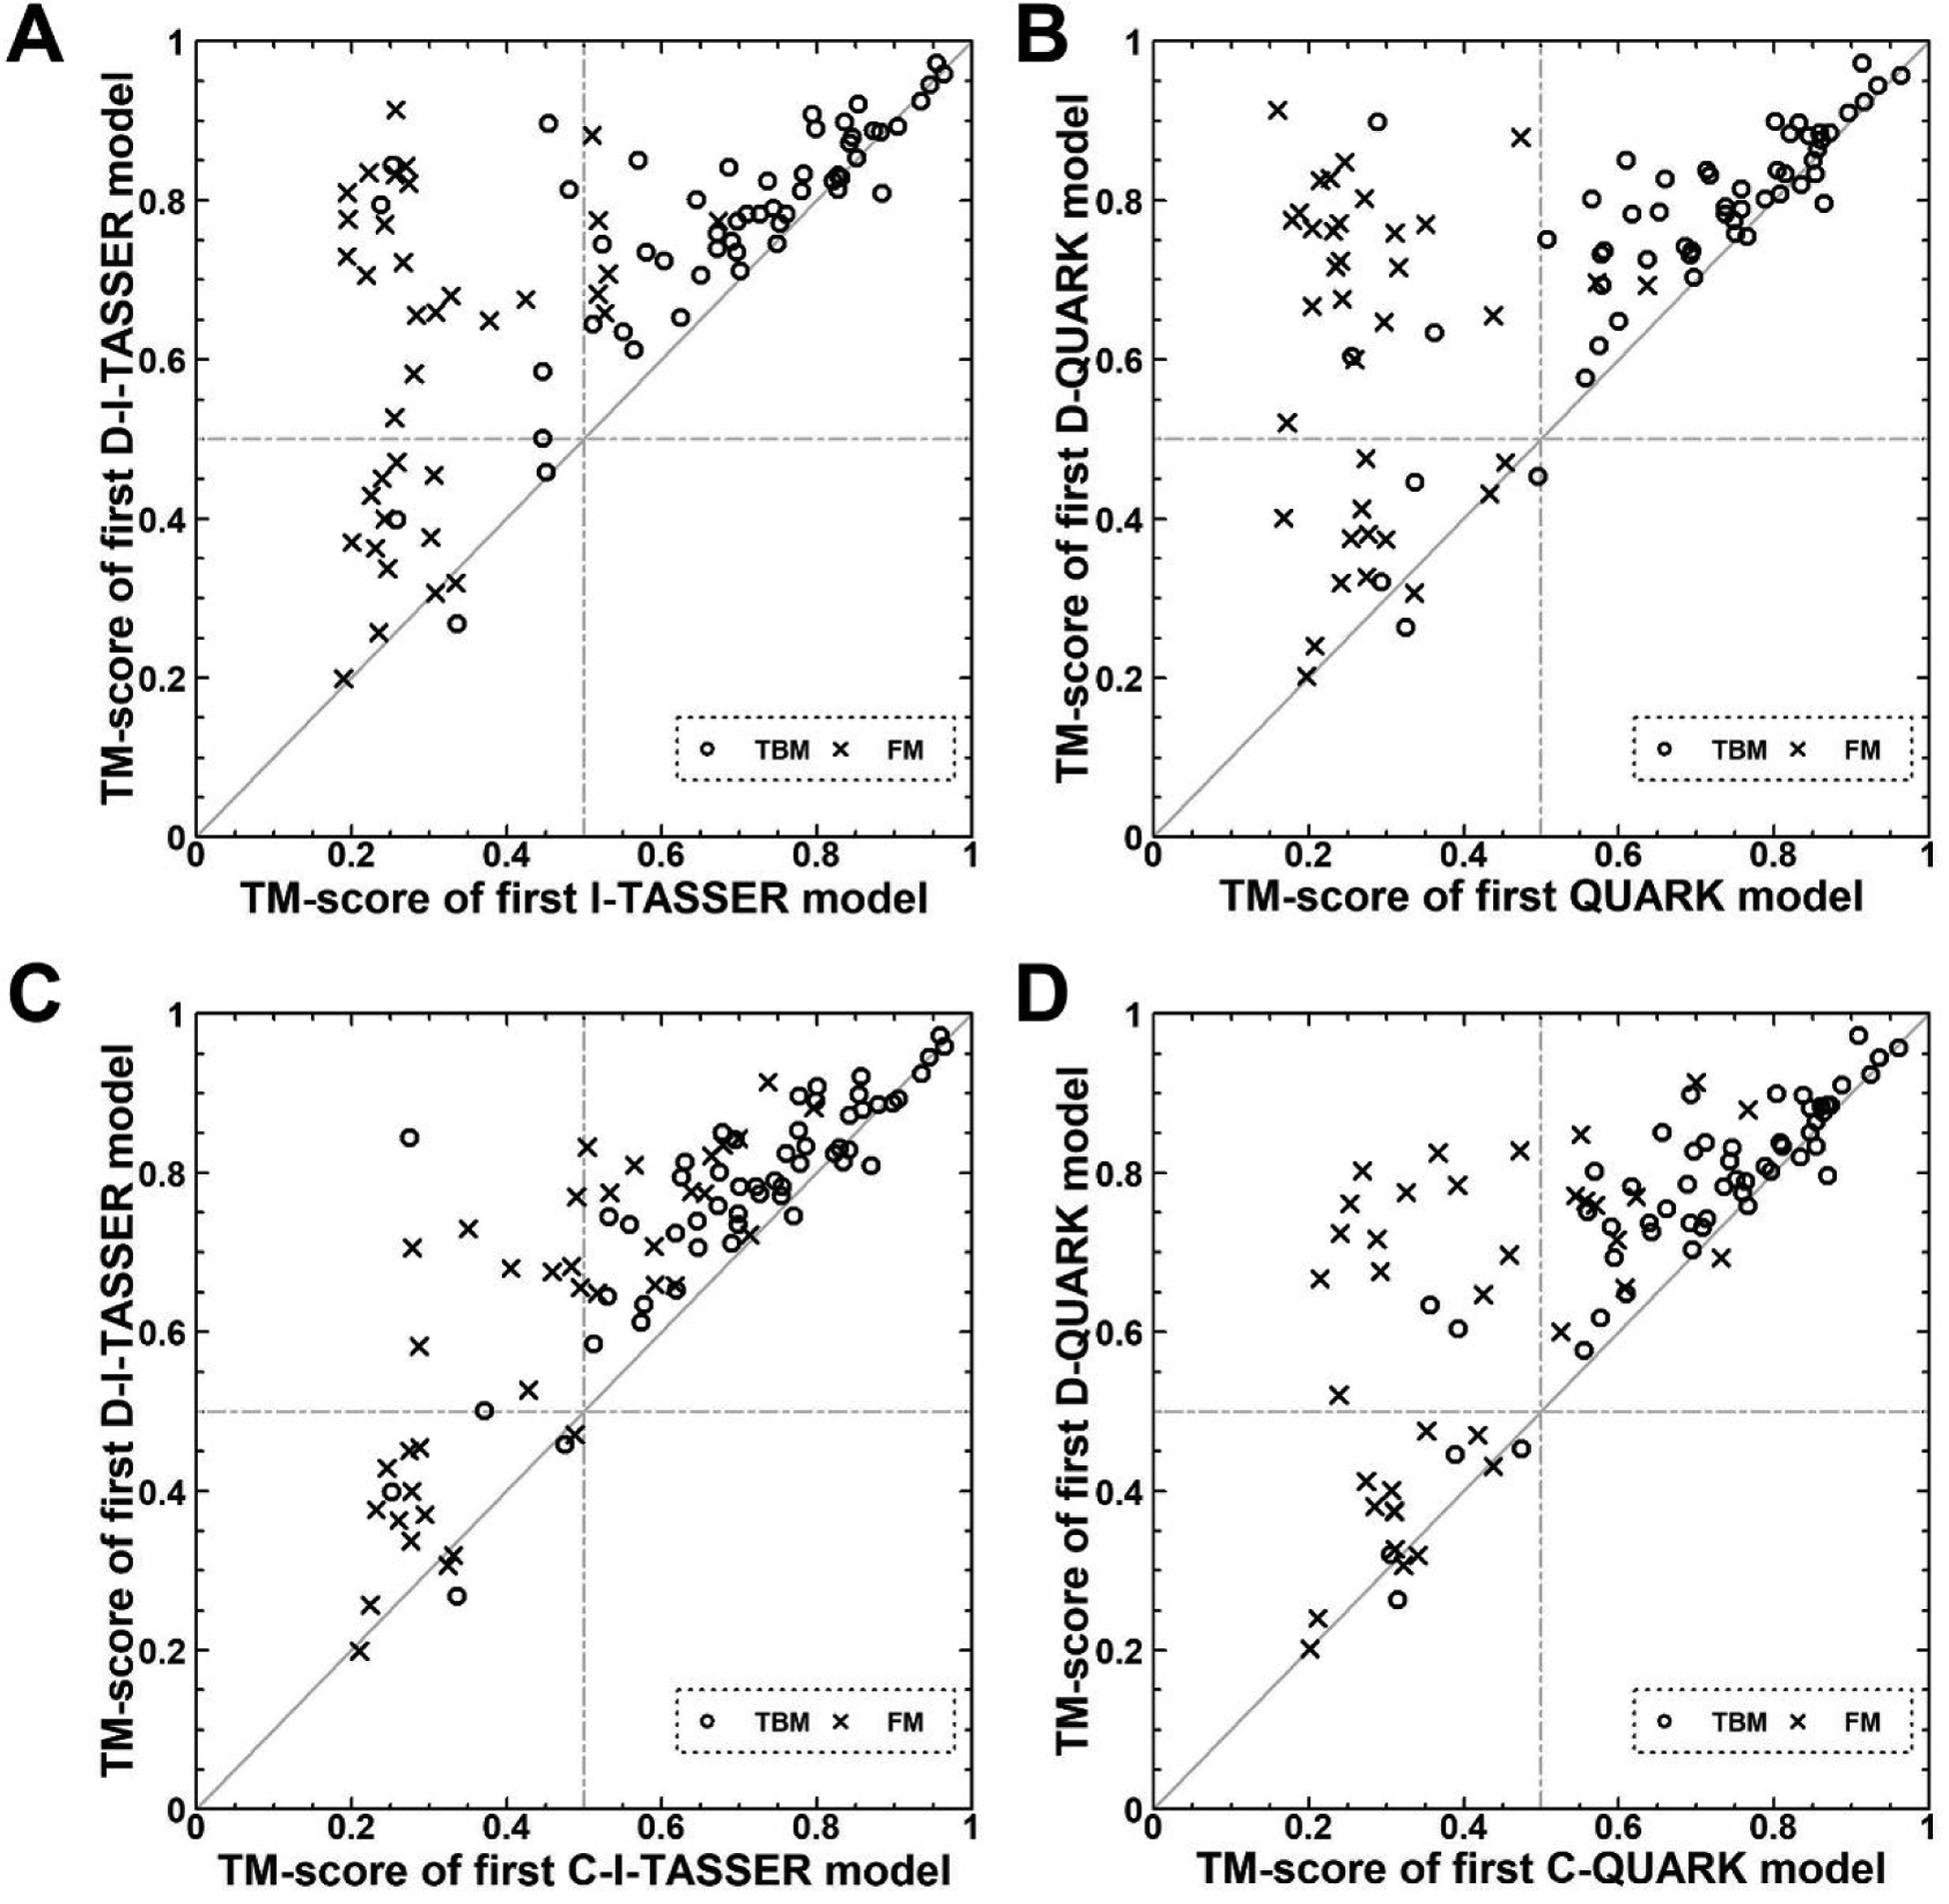
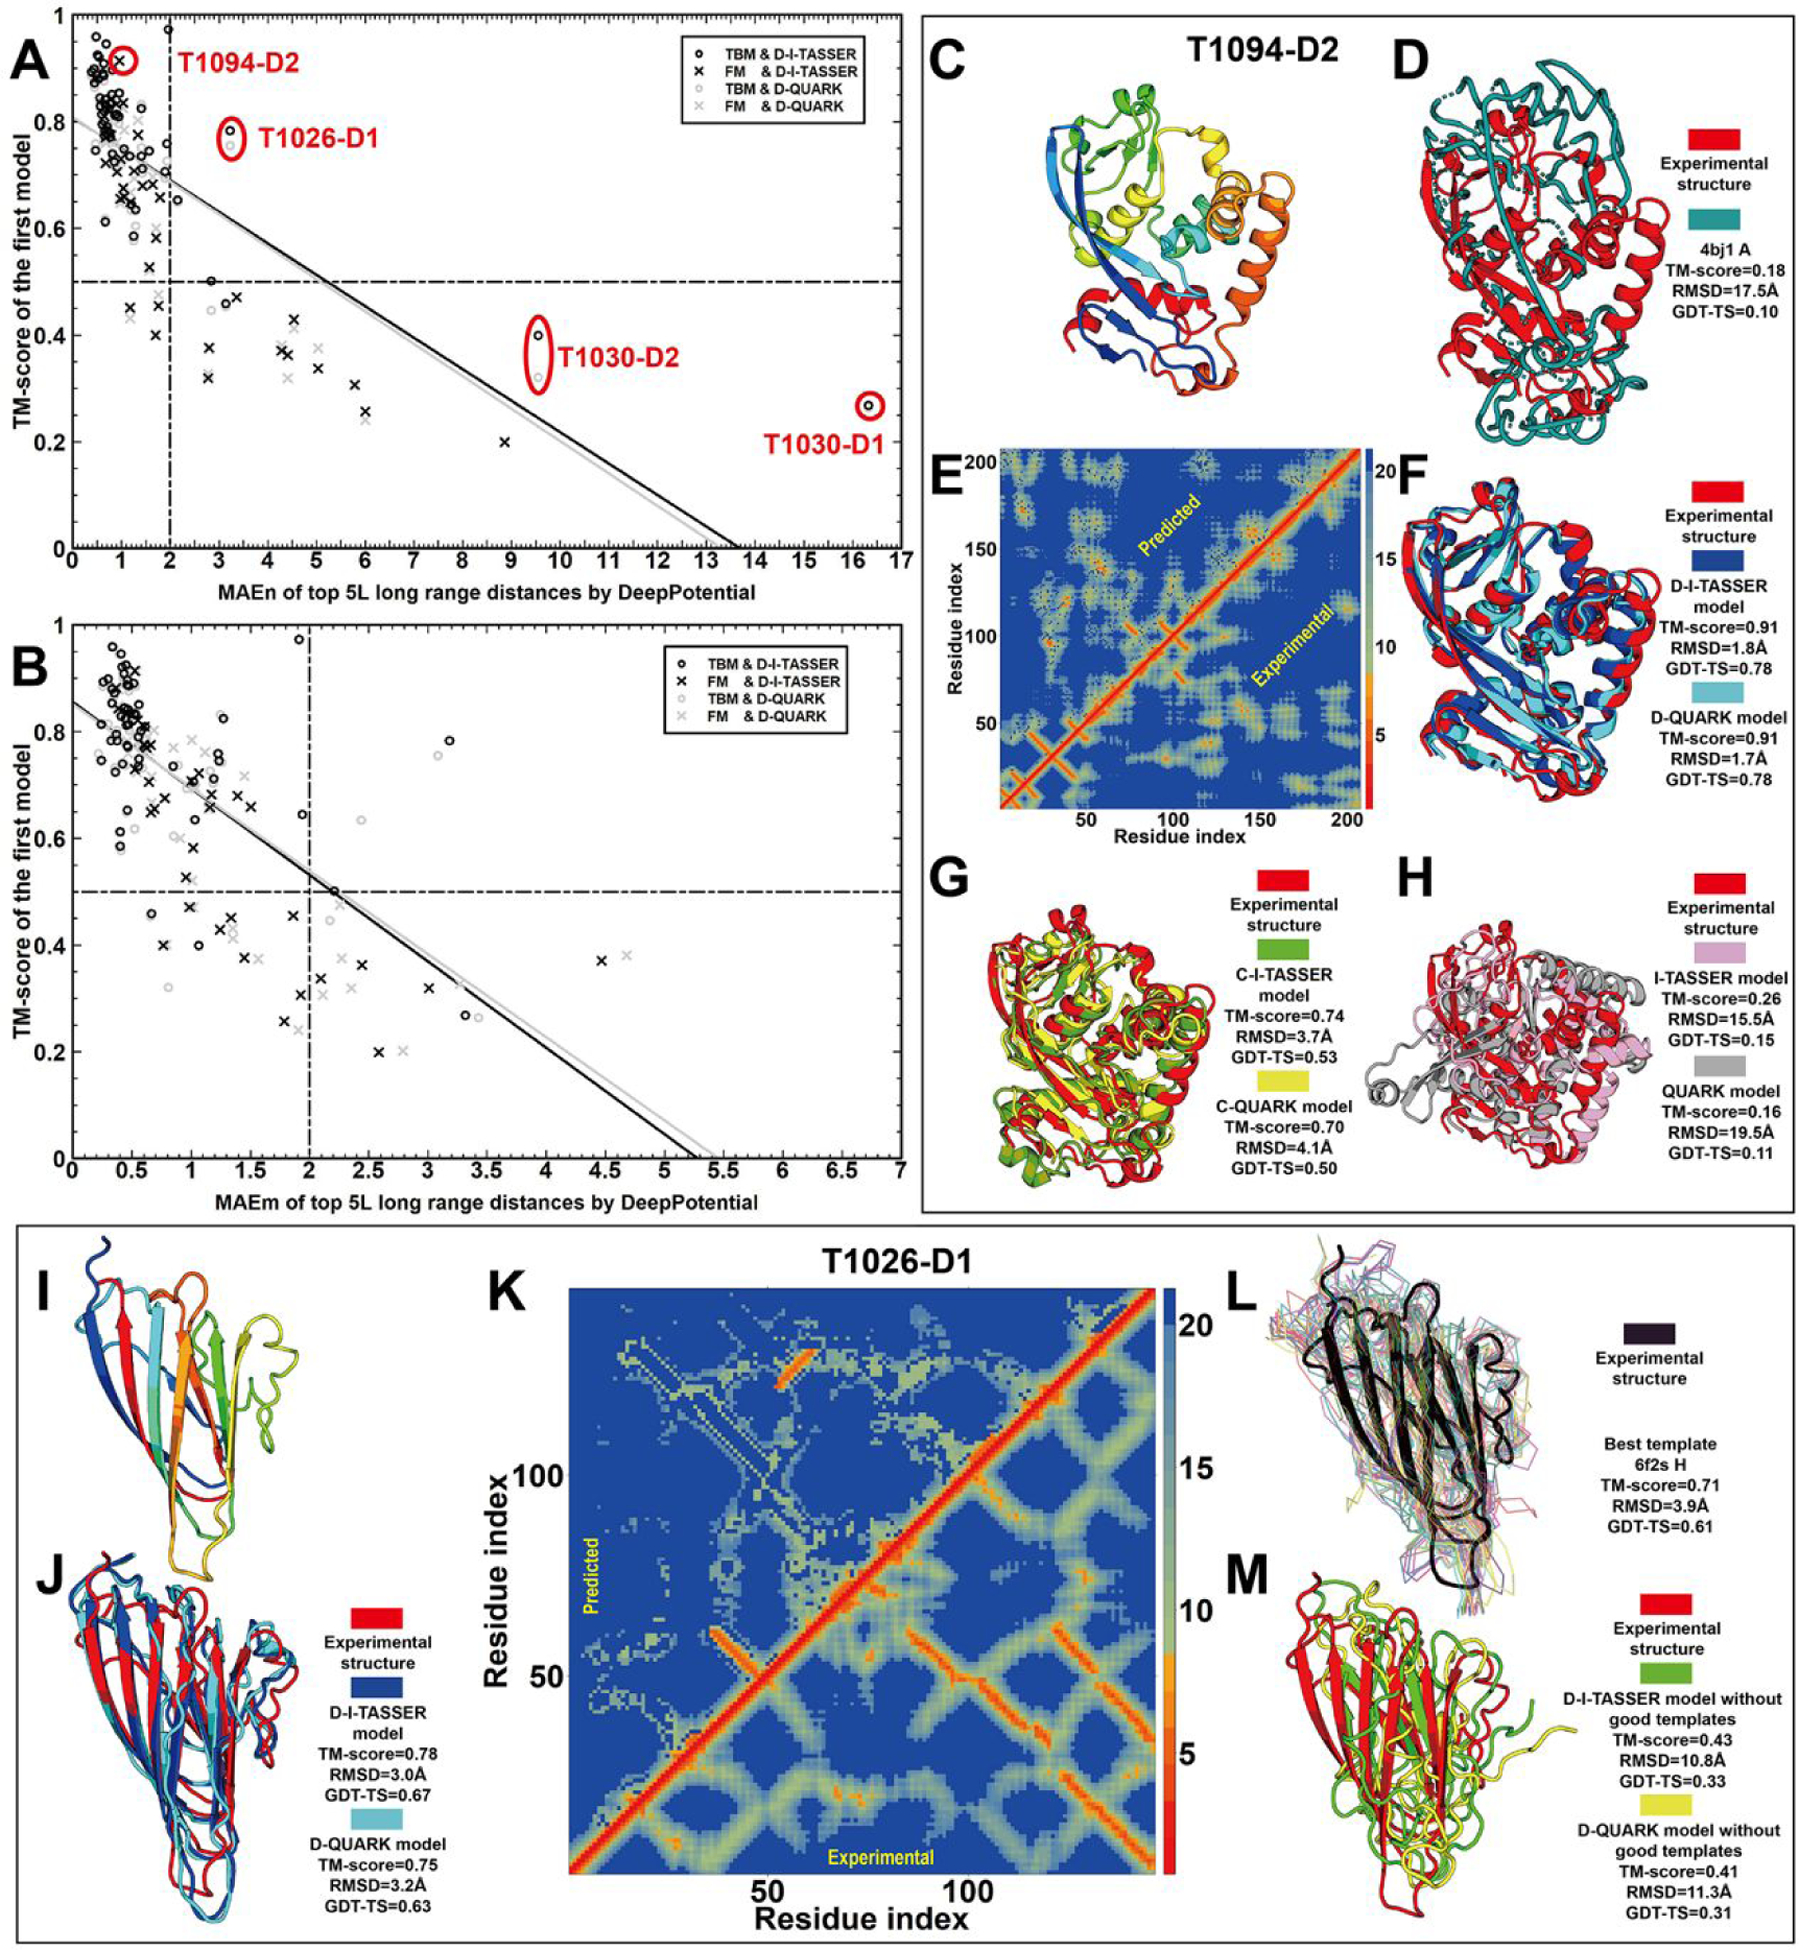
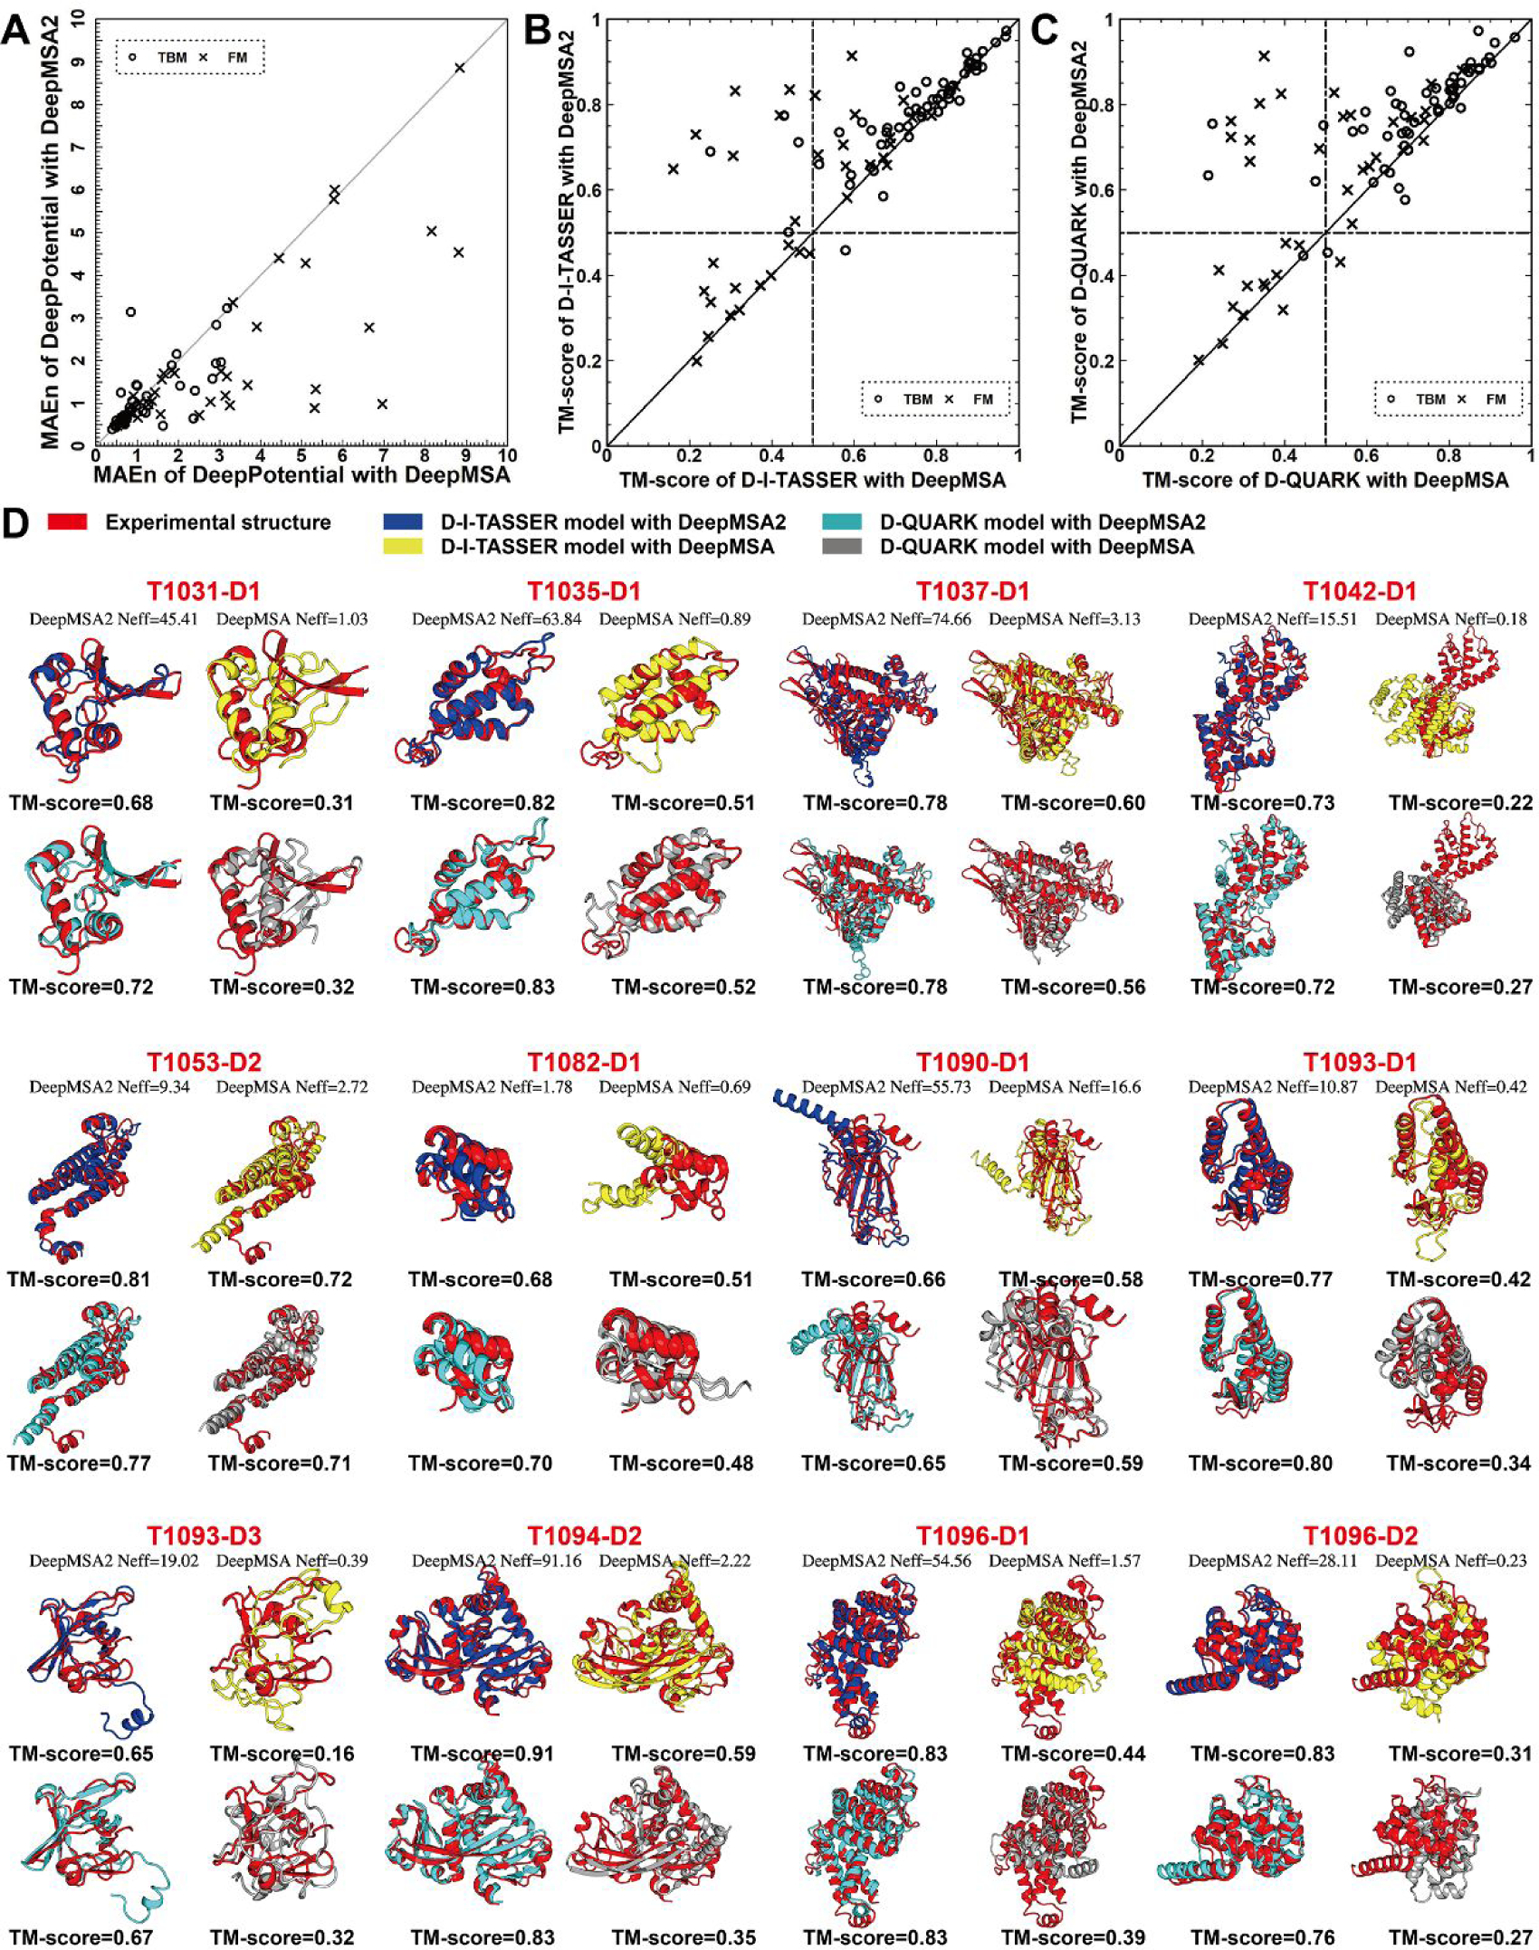
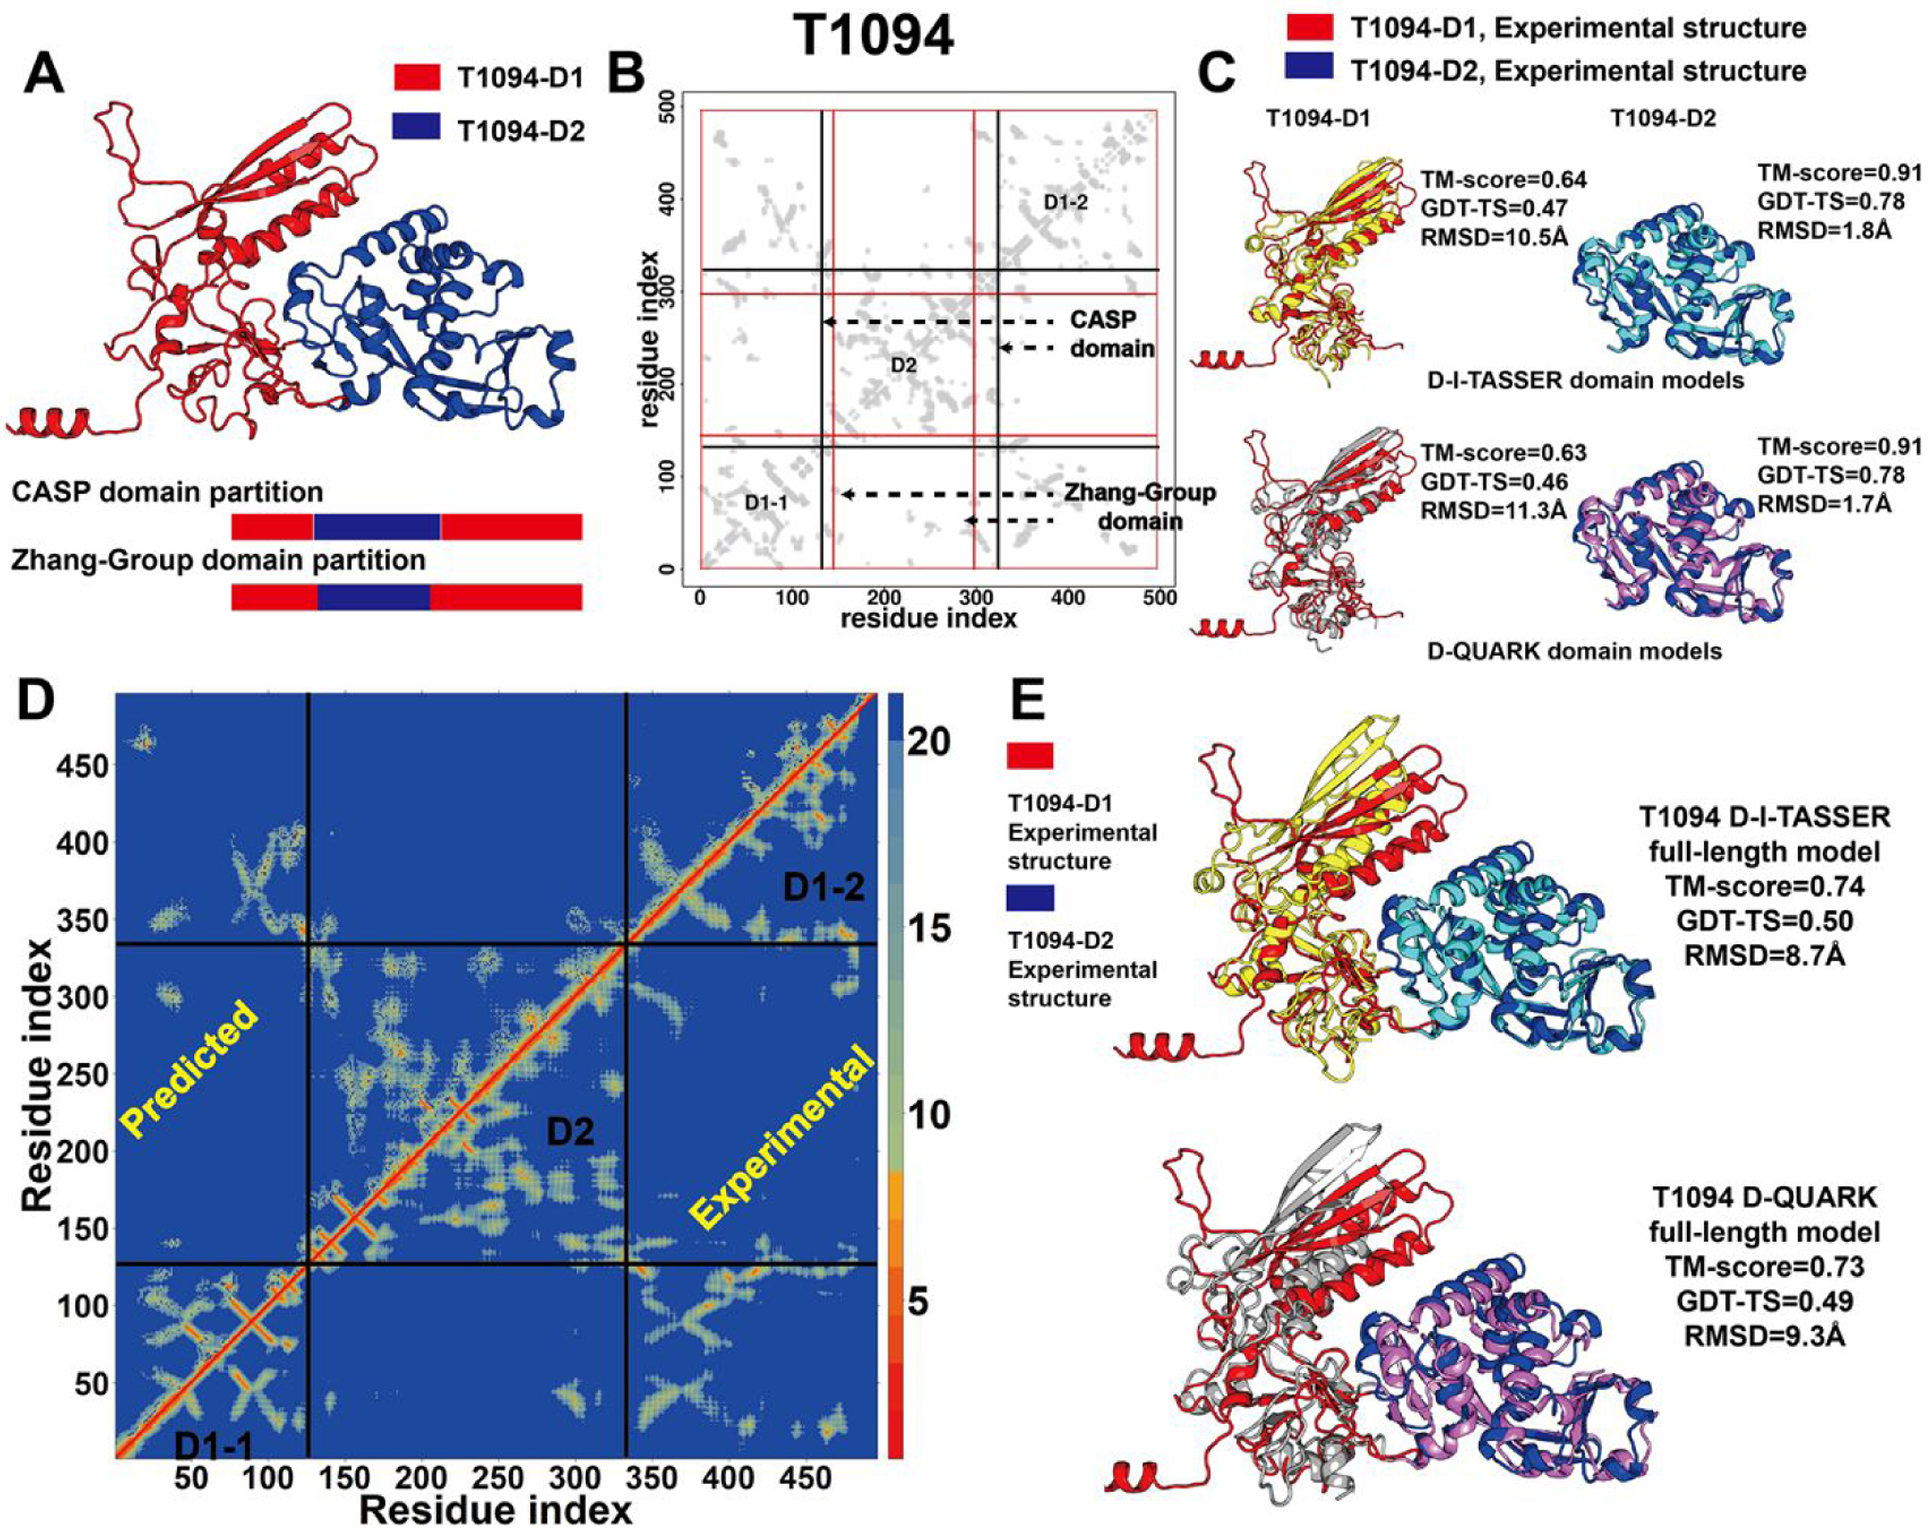
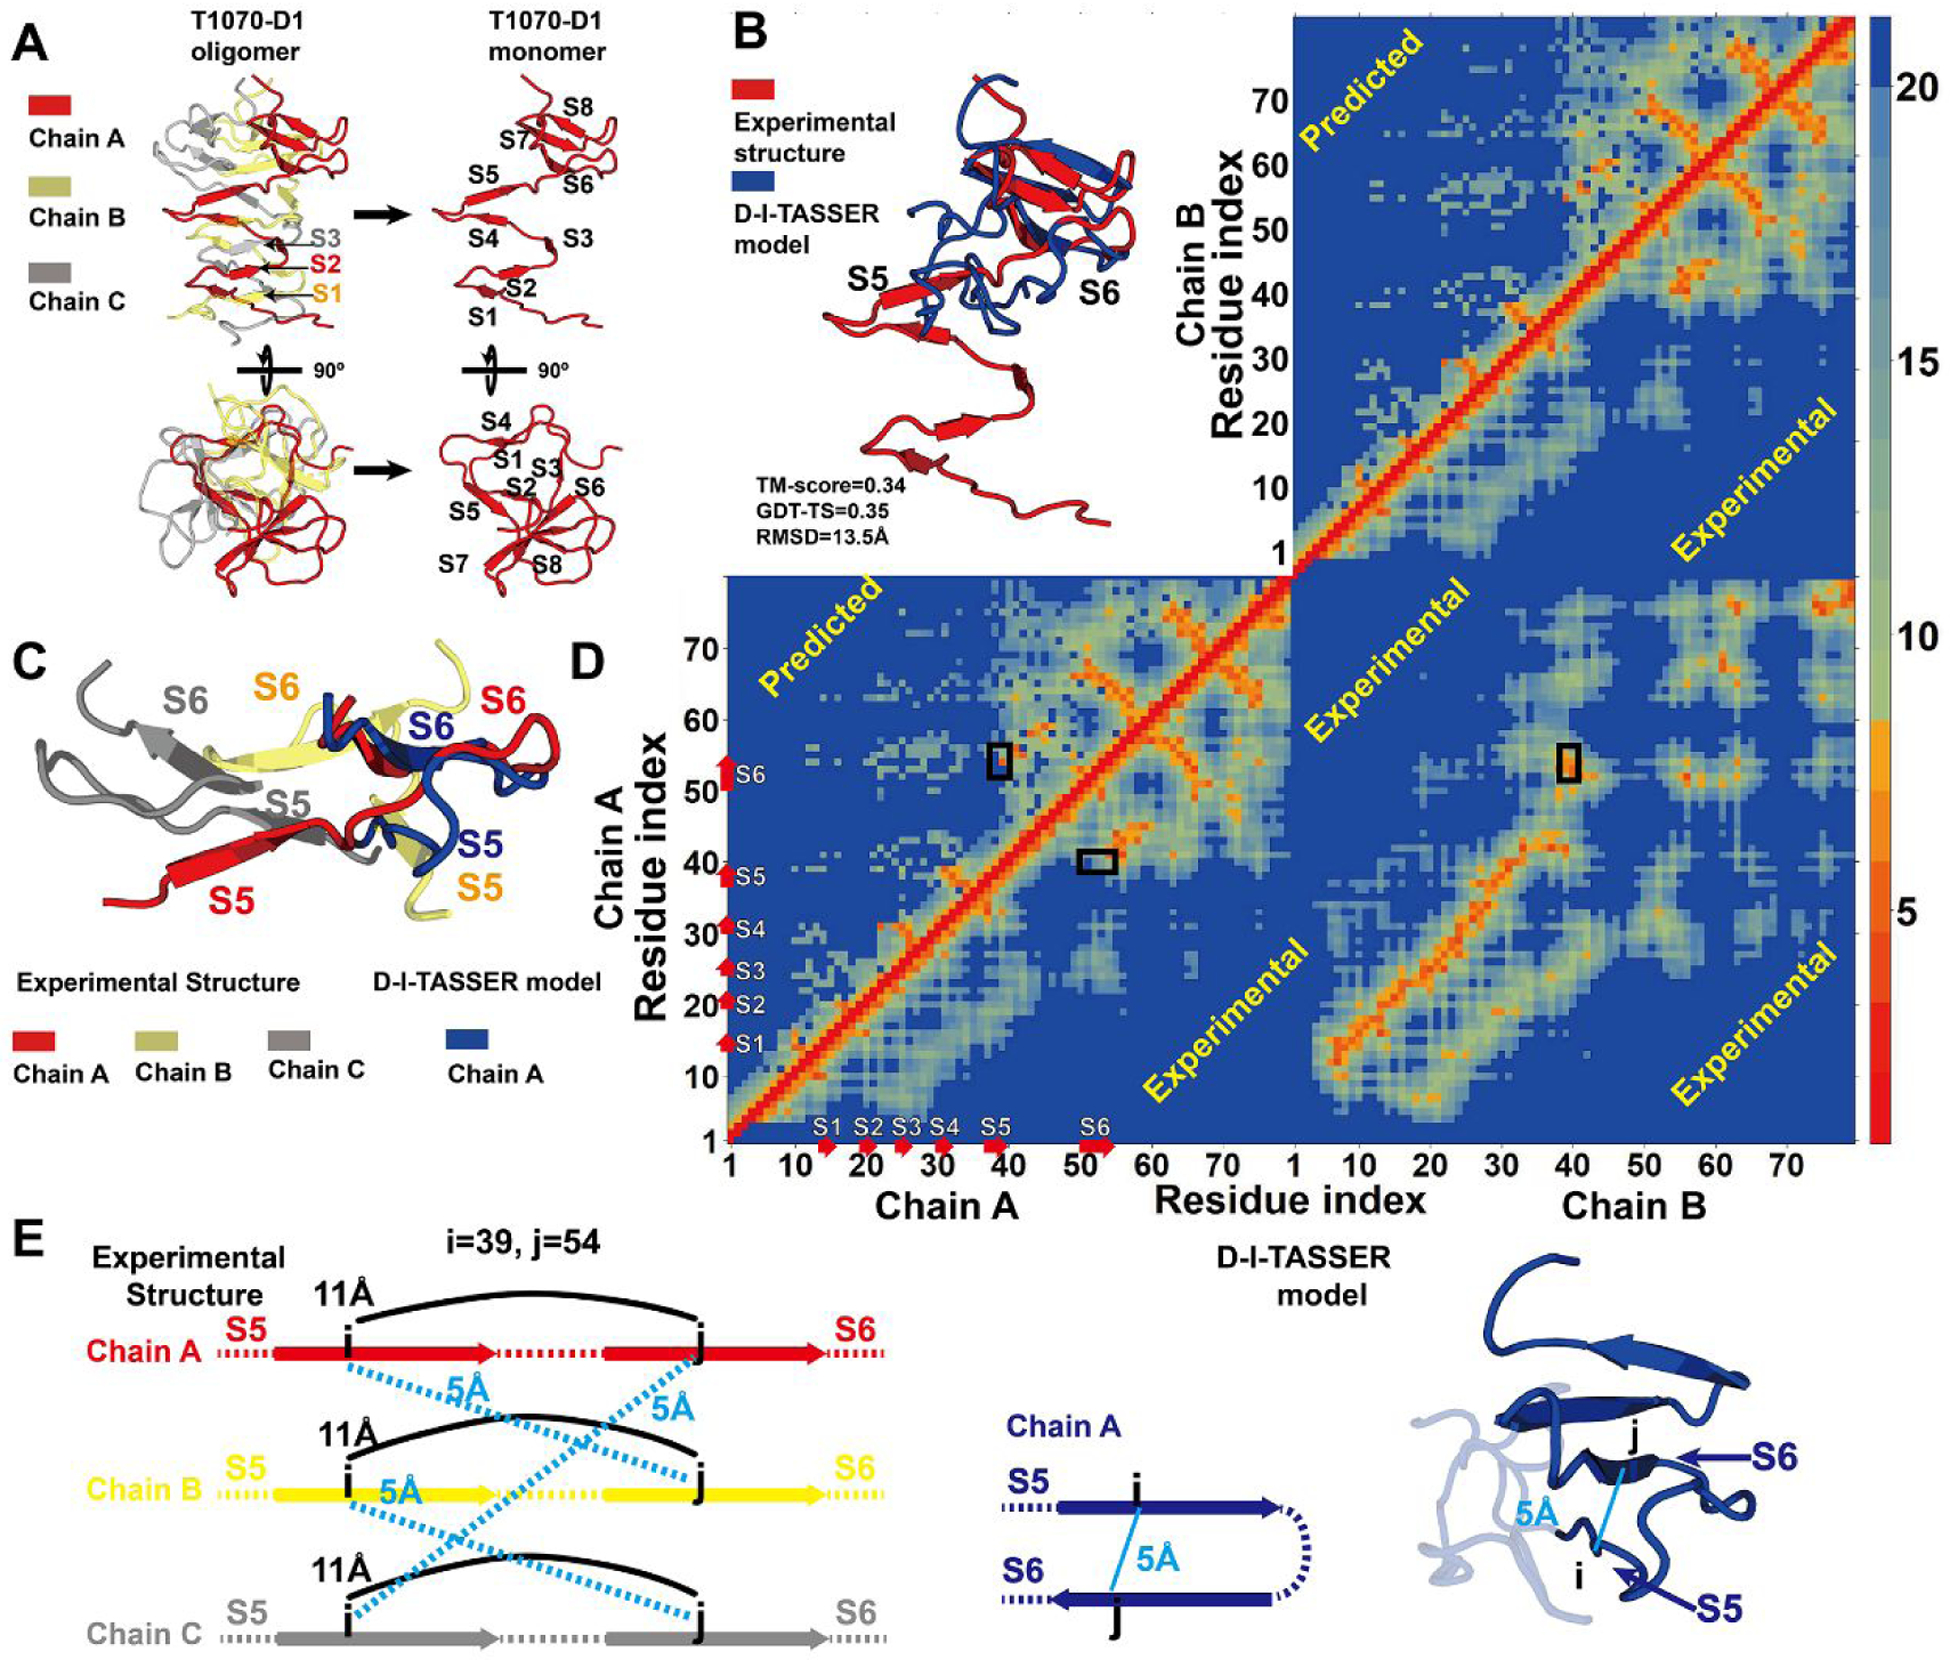
In this article, we report 3D structure prediction results by two of our best server groups ("Zhang-Server" and "QUARK") in CASP14. These two servers were built based on the D-I-TASSER and D-QUARK algorithms, which integrated four newly developed components into the classical protein folding pipelines, I-TASSER and QUARK, respectively. The new components include: (a) a new multiple sequence alignment (MSA) collection tool, DeepMSA2, which is extended from the DeepMSA program; (b) a contact-based domain boundary prediction algorithm, FUpred, to detect protein domain boundaries; (c) a residual convolutional neural network-based method, DeepPotential, to predict multiple spatial restraints by co-evolutionary features derived from the MSA; and (d) optimized spatial restraint energy potentials to guide the structure assembly simulations. For 37 FM targets, the average TM-scores of the first models produced by D-I-TASSER and D-QUARK were 96% and 112% higher than those constructed by I-TASSER and QUARK, respectively. The data analysis indicates noticeable improvements produced by each of the four new components, especially for the newly added spatial restraints from DeepPotential and the well-tuned force field that combines spatial restraints, threading templates, and generic knowledge-based potentials. However, challenges still exist in the current pipelines. These include difficulties in modeling multi-domain proteins due to low accuracy in inter-domain distance prediction and modeling protein domains from oligomer complexes, as the co-evolutionary analysis cannot distinguish inter-chain and intra-chain distances. Specifically tuning the deep learning-based predictors for multi-domain targets and protein complexes may be helpful to address these issues.
Keywords: CASP14; ab initio folding; deep learning; domain partition; multiple sequence alignment; protein structure prediction; residue-residue distance prediction.
© 2021 Wiley Periodicals LLC.
Figures
Similar articles
-
I-TASSER-MTD: a deep-learning-based platform for multi-domain protein structure and function prediction.Nat Protoc. 2022 Oct;17(10):2326-2353. doi: 10.1038/s41596-022-00728-0. Epub 2022 Aug 5. Nat Protoc. 2022. PMID: 35931779 Review.
-
Deep-learning contact-map guided protein structure prediction in CASP13.Proteins. 2019 Dec;87(12):1149-1164. doi: 10.1002/prot.25792. Epub 2019 Aug 14. Proteins. 2019. PMID: 31365149 Free PMC article.
-
Template-based and free modeling of I-TASSER and QUARK pipelines using predicted contact maps in CASP12.Proteins. 2018 Mar;86 Suppl 1(Suppl 1):136-151. doi: 10.1002/prot.25414. Epub 2017 Nov 14. Proteins. 2018. PMID: 29082551 Free PMC article.
-
Integrating deep learning, threading alignments, and a multi-MSA strategy for high-quality protein monomer and complex structure prediction in CASP15.Proteins. 2023 Dec;91(12):1684-1703. doi: 10.1002/prot.26585. Epub 2023 Aug 31. Proteins. 2023. PMID: 37650367 Free PMC article.
-
Toward the solution of the protein structure prediction problem.J Biol Chem. 2021 Jul;297(1):100870. doi: 10.1016/j.jbc.2021.100870. Epub 2021 Jun 11. J Biol Chem. 2021. PMID: 34119522 Free PMC article. Review.
Cited by
-
I-TASSER-MTD: a deep-learning-based platform for multi-domain protein structure and function prediction.Nat Protoc. 2022 Oct;17(10):2326-2353. doi: 10.1038/s41596-022-00728-0. Epub 2022 Aug 5. Nat Protoc. 2022. PMID: 35931779 Review.
-
Revolutionizing Medicinal Chemistry: The Application of Artificial Intelligence (AI) in Early Drug Discovery.Pharmaceuticals (Basel). 2023 Sep 6;16(9):1259. doi: 10.3390/ph16091259. Pharmaceuticals (Basel). 2023. PMID: 37765069 Free PMC article. Review.
-
Progressive assembly of multi-domain protein structures from cryo-EM density maps.Nat Comput Sci. 2022 Apr;2(4):265-275. doi: 10.1038/s43588-022-00232-1. Epub 2022 Apr 28. Nat Comput Sci. 2022. PMID: 35844960 Free PMC article.
-
Using multiple computer-predicted structures as molecular replacement models: application to the antiviral mini-protein LCB2.IUCrJ. 2025 Jul 1;12(Pt 4):488-501. doi: 10.1107/S2052252525005123. IUCrJ. 2025. PMID: 40549150 Free PMC article.
-
Protein Function Analysis through Machine Learning.Biomolecules. 2022 Sep 6;12(9):1246. doi: 10.3390/biom12091246. Biomolecules. 2022. PMID: 36139085 Free PMC article. Review.
References
Publication types
MeSH terms
Substances
Grants and funding
LinkOut - more resources
Full Text Sources
