. 2021 Oct 15;42(15):5113-5129.
doi: 10.1002/hbm.25607. Epub 2021 Jul 31.

Investigating the spectral features of the brain meso-scale structure at rest

Affiliations

Investigating the spectral features of the brain meso-scale structure at rest

Riccardo Iandolo et al. Hum Brain Mapp. .

Abstract

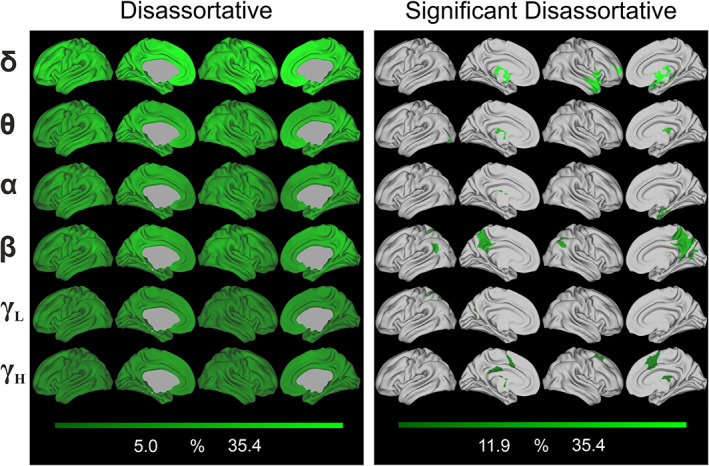
Recent studies provide novel insights into the meso-scale organization of the brain, highlighting the co-occurrence of different structures: classic assortative (modular), disassortative, and core-periphery. However, the spectral properties of the brain meso-scale remain mostly unexplored. To fill this knowledge gap, we investigated how the meso-scale structure is organized across the frequency domain. We analyzed the resting state activity of healthy participants with source-localized high-density electroencephalography signals. Then, we inferred the community structure using weighted stochastic block-model (WSBM) to capture the landscape of meso-scale structures across the frequency domain. We found that different meso-scale modalities co-exist and are diversely organized over the frequency spectrum. Specifically, we found a core-periphery structure dominance, but we also highlighted a selective increase of disassortativity in the low frequency bands (<8 Hz), and of assortativity in the high frequency band (30-50 Hz). We further described other features of the meso-scale organization by identifying those brain regions which, at the same time, (a) exhibited the highest degree of assortativity, disassortativity, and core-peripheriness (i.e., participation) and (b) were consistently assigned to the same community, irrespective from the granularity imposed by WSBM (i.e., granularity-invariance). In conclusion, we observed that the brain spontaneous activity shows frequency-specific meso-scale organization, which may support spatially distributed and local information processing.

Keywords: community detection; frequency-specificity; meso-scale; network neuroscience; resting state.


Figures

FIGURE 1
FIGURE 1
Organization of the meso‐scale structure in the frequency domain. Each row represents the K = 5 community assignments in each of the considered frequency band: δ (a1), θ (a2), α (a3), β (a4), γ L (a5), γ H (a6). Left side of each row contains the re‐ordered group level adjacency matrix after WSBM estimation while the right side the spatial distribution of the same five partitions overlaid onto the brain. Colors on the left side and at the bottom of each re‐reordered adjacency matrix match with the colors overlaid on the brain. The anatomo‐functional information (according to the AICHA atlas) for each node of the six re‐ordered adjacency matrices—one for each of the considered frequency bands—is reported in the Tables S2–S7
FIGURE 2
FIGURE 2
Organization of the meso‐scale structure in the frequency domain. (a) Boxplots representing distributions across participants of the three meso‐scale motifs for each frequency band. Red: assortative; green: disassortative; and light blue: core‐periphery. Between‐subject variability is depicted thanks to boxplots showing upper and lower bound of the distributions at 25th and 75th percentile. Whiskers extend to the most extreme data points not considered outliers. The black horizontal lines represent the median, while the small colored squares indicate the mean of the distributions. (b1) Median values of each meso‐scale structure distributions (black horizontal lines in panel a) across frequency bands. (b2) Median values of each meso‐scale structure distributions for each frequency in the range 1–80 Hz binned at 1 Hz, obtained by fixing K = 5. (c,d) Post‐hoc comparison of mean ranks across frequencies. Tables highlight statistically significant assortative and disassortative between‐communities interaction, panels c and d, respectively. Note that, core‐periphery interactions across bands were nonstatistically significant and thus we did not perform the multiple comparison test
FIGURE 3
FIGURE 3
Global mean assortative community interactions in the frequency domain across participants. (Left panel) spatial distribution of assortativity overlaid onto the brain. Each row indicates the considered frequency band. The color‐bar is customized between minimum and maximum values within the considered meso‐scale modality. (Right panel) significant nodes according to the community motif, as revealed by the nonparametric permutation test. Columns and rows as in the left panel. See also Tables S8–S13, for further information about each significant node's name and MNI coordinate, according to the definition given in the AICHA atlas
FIGURE 4
FIGURE 4
Global mean disassortative community interactions in the frequency domain across participants. (Left panel) spatial distribution of disassortativity overlaid onto the brain. Each row indicates the considered frequency band. The color‐bar is customized between minimum and maximum values within the considered meso‐scale modality. (Right panel) significant nodes according to the community motifs, as revealed by the nonparametric permutation test. Columns and rows as in the left panel. See also Tables S8–S13, for further information about each significant node's name and MNI coordinate, according to the definition given in the AICHA
FIGURE 5
FIGURE 5
Global mean core‐periphery community interactions in the frequency domain across participants. (Left panel) Spatial distribution of core‐periphery overlaid onto the brain. Each row indicates the considered frequency band. The color‐bar is customized between minimum and maximum values within the considered meso‐scale modality. (Right panel) Significant nodes according to the community motifs, as revealed by the nonparametric permutation test. Columns and rows as in the left panel. See also Tables S8–S13, for further information about each significant node's name and MNI coordinate, according to the definition given in the AICHA
FIGURE 6
FIGURE 6
Communities reconfiguration across K‐th partitions. Alluvial plots indicating three set of nodes (light‐red, yellow, and dark blue) assigned to the same community regardless of the partitions in each band—δ (a1), θ (a2), α (a3), β (a4), γ L (a5), and γ H (a6). Gray flows indicate nodes failing to address the criteria defining main flows across partitions. Every time a colored flow's branch fades toward gray indicates that nodes terminated in a different cluster. Vertical black lines on each side of the transitions indicates originating (from the lower‐grain partition—left side) and arrival clusters (to the adjacent higher‐grain partition—right side)
FIGURE 7
FIGURE 7
Participation and granularity invariant regions. Highlighted areas indicate areas that both belong to an invariant community across partitions and show significant level of assortativity (PGI‐assortative areas, orange), disassortativity (PGI‐disassortative, dark red) and core‐peripheriness (white, PGI‐core‐periphery). Each row indicates a frequency band—δ (a1), θ (a2), α (a3), β (a4), γ L (a5), γ H (a6). For a complete description of PGI areas, see also Tables S14–S19 as some subcortical regions are not depicted

Similar articles

References

    1. Ahmadlou, M., & Adeli, H. (2011). Functional community analysis of brain: A new approach for EEG‐based investigation of the brain pathology. NeuroImage, 58(2), 401–408. - PubMed
    1. Aicher, C., Jacobs, A. Z., & Clauset, A. (2015). Learning latent block structure in weighted networks. Journal of Complex Networks, 3(2), 221–248.
    1. Babiloni, C., Barry, R. J., Başar, E., Blinowska, K. J., Cichocki, A., Drinkenburg, W. H., … Nunez, P. (2020). International Federation of Clinical Neurophysiology (IFCN)–EEG research workgroup: Recommendations on frequency and topographic analysis of resting state EEG rhythms. Part 1: Applications in clinical research studies. Clinical Neurophysiology, 131(1), 285–307. - PubMed
    1. Barbey, A. K., Colom, R., & Grafman, J. (2013). Dorsolateral prefrontal contributions to human intelligence. Neuropsychologia, 51(7), 1361–1369. 10.1016/j.neuropsychologia.2012.05.017 - DOI - PMC - PubMed
    1. Betzel, R. F., & Bassett, D. S. (2017). Multi‐scale brain networks. NeuroImage, 160, 73–83. - PMC - PubMed

Publication types