. 2021 Dec;52(4):1733-1744.
doi: 10.1007/s42770-021-00584-2. Epub 2021 Jul 31.

Highly specific and rapid molecular detection of Candida glabrata in clinical samples

Affiliations

Highly specific and rapid molecular detection of Candida glabrata in clinical samples

Oscar Hernández-Carreón et al. Braz J Microbiol. 2021 Dec.

Abstract

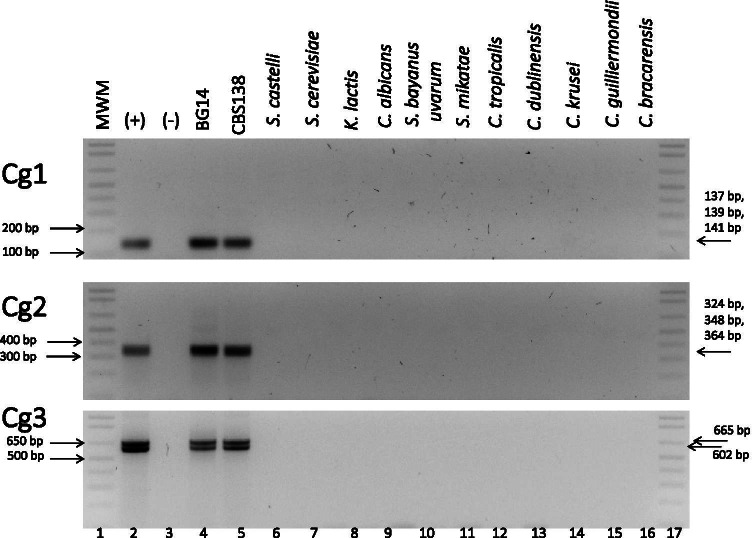
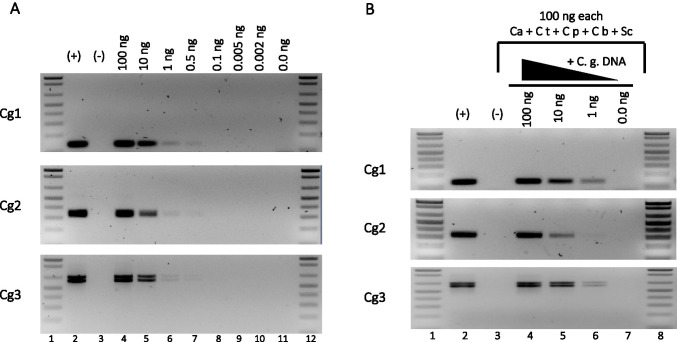
The most common nosocomial fungal infections are caused by several species of Candida, of which Candida glabrata is the second most frequently isolated species from bloodstream infections. C. glabrata displays relatively high minimal inhibitory concentration values (MIC) to the antifungal fluconazole and is associated with high mortality rates. To decrease mortality rates, the appropriate treatment must be administered promptly. C. glabrata contains in its genome several non-identical copies of species-specific sequences. We designed three pairs of C. glabrata-specific primers for endpoint PCR amplification that align to these species-specific sequences and amplify the different copies in the genome. Using these primers, we developed a fast, sensitive, inexpensive, and highly specific PCR-based method to positively detect C. glabrata DNA in a concentration-dependent manner from mixes of purified genomic DNA of several Candida species, as well as from hemocultures and urine clinical samples. This tool can be used for positive identification of C. glabrata in the clinic.

Keywords: Candida glabrata; Molecular detection; PCR amplification; Responsible Editor: Sandro Rogerio de Almeida; Species-specific sequences.


Figures

Fig. 1
Fig. 1
Chromosomal localization of NE copies. Schematic representation of the chromosomal localization of 5 copies of the NE associated with subtelomeric genes encoding cell wall proteins and the position of the C. glabrata-specific primer pairs Cg1, Cg2, and Cg3. Line 1: right telomere and subtelomeric region of chromosome E (Chr E-R) and its subtelomeric region where the EPA1, EPA2, and EPA3 gene cluster is localized. The telomere (T) is indicated. Primer pairs (small arrows) Cg1 (primers #242 and #245) and Cg2 (primers #246 and #245) share the reverse primer and they align just downstream of the functional NE associated with EPA1 generating 139-bp and 324-bp fragments respectively. Line 2: alignment of Cg1 and Cg2 primer pairs on the right subtelomere of chromosome H (Chr H-R) where AWP13 is located. Cg1 and Cg2 amplification products of this region generate 141-bp and 364-bp fragments respectively. Line 3: left telomere of chromosome K (Chr K-L), Cg1 and Cg2 align between EPA22 and AWP2 with amplification products of 137 and 348 bp. Lines 4 and 5: left and right subtelomeric regions of chromosome C respectively (Chr C-L Chr E-R). Cg3 pair (primers #244 and #243) aligns downstream of both EPA6 and EPA7 with 602-bp and 665-bp expected amplification products as indicated
Fig. 2
Fig. 2
Primer pairs Cg1, Cg2, and Cg3 specifically detect only C. glabrata. Genomic DNA from the indicated species from the Saccharomyces clade was used to amplify C. glabrata-specific sequences using each of the pairs Cg1, Cg2, and Cg3 as labeled in each gel. Lane 1: MWM relevant MWM bands are indicated on the left side with an arrow; lane 2: ( +) positive control (genomic DNA from strain BG14 previously tested for PCR reactions). Expected sizes of the bands obtained with each pair of primers is indicated with an arrow on the right side of the image; lane 3: (-) negative control: reaction mixture without DNA. Lanes 4 to 16: PCR reactions using genomic DNA from: parental BG14 strain, standard CBS138, Saccharomyces castellii (NC4c2829); Saccharomyces cerevisiae (S288c; ATCC 204,508); Kluyveromyces lactis (CLIB 209); Candida albicans (SC5314, ATCC MYA2876); Saccharomyces bayanus uvarum (CLI 251); Saccharomyces mikatae (IFO1815); Candida tropicalis (ATCC 750); Candida dublinensis (CD36); Candida krusei; Candida guilliermondii; Candida bracarensis (NCYC 3133) respectively; lane 17: MWM
Fig. 3
Fig. 3
C. glabrata-specific primer pairs Cg1, Cg2, and Cg3 detect small amounts of genomic DNA. (A) Amplification products obtained by endpoint PCR with primer pairs Cg1, Cg2, and Cg3 with decreasing amounts of genomic DNA as indicated (lanes 4 to 11). Lanes 1 and 12: molecular weight markers (MWM). Lanes 2 ( +) and 3 (-): positive and negative controls as described for Fig. 2B Amplification products with C. glabrata-specific primer pairs Cg1, Cg2, and Cg3 using as template mixes of 100 ng each of purified genomic DNA from C. albicans (Ca), C. tropicalis (Ct), C. parapsilosis (Cp), C. bracarensis (Cb), and S. cerevisiae (Sc), in addition to decreasing amounts of C. glabrata DNA. Lanes 1 and 8: MWM; lanes 2 ( +) and 3 (-): positive and negative controls as described for Fig. 2. Lanes 4 to 7: mixes of 100 ng each Ca, Ct, Cp, Cb, Sc genomic DNA plus 100 ng (lane 4), 10 ng (lane 5), 1 ng (lane 6), or 0 ng (lane 7) of C. glabrata genomic DNA
Fig. 4
Fig. 4
Primer pairs Cg1, Cg2, and Cg3 correctly identify C. glabrata clinical isolates. Genomic DNA from the indicated clinical isolates was used as template DNA for PCR reactions with Cg1, Cg2, and Cg3 C. glabrata-specific primer pairs. Lanes 1 and 20: molecular weight markers (MWM) and position of relevant sized bands are indicated with arrows on the left. Lanes 2 ( +) and 3 (-): positive and negative controls as described for Fig. 2. Lanes 4 through 19: genomic DNA from clinical isolates: MC1, MC2, MC3, MC4, MC5, MC6, MC7, MC8, MC10, MC11, MC12, MC13, MC14, MC15, MC16, and MC17 as indicated. The size and position (arrow) of the expected bands obtained with each pair of primers is indicated on the right side. With primer pair Cg3 over 80% of the isolates present only the 602-bp amplicon (associated with EPA6) but not the 665-bp fragment (associated with EPA7). The positive control (lane 2) shows both amplicons obtained using genomic DNA from BG14. Note that MC15 did not produce amplification bands with any of the primer pairs since it is not C. glabrata but C. albicans

Similar articles

Cited by

References

    1. Chang A, Neofytos D, Horn D. Candidemia in the 21st century. Future Microbiol. 2008;3(4):463–472. doi: 10.2217/17460913.3.4.463. - DOI - PubMed
    1. Perlroth J, Choi B, Spellberg B. Nosocomial fungal infections: epidemiology, diagnosis and treatment. Med Mycol. 2007;45(4):321–346. doi: 10.1080/13693780701218689. - DOI - PubMed
    1. Pfaller MA, Diekema DJ. Epidemiology of invasive mycoses in North America. Crit Rev Microbiol. 2010;36(1):1–53. doi: 10.3109/10408410903241444. - DOI - PubMed
    1. Kullberg BJ, Arendrup MC. Invasive Candidiasis. N Engl J Med. 2015;373(15):1445–1456. doi: 10.1056/NEJMra1315399. - DOI - PubMed
    1. Pappas PG, Lionakis MS, Arendrup MC, Ostrosky-Zeichner L, Kullberg BJ. Invasive candidiasis Nat Rev Dis Primers. 2018;4:18026. doi: 10.1038/nrdp.2018.26. - DOI - PubMed

LinkOut - more resources