Review
. 2021 Sep 2;108(9):1558-1563.
doi: 10.1016/j.ajhg.2021.07.003. Epub 2021 Jul 30.

The omnigenic model and polygenic prediction of complex traits

Affiliations
Review

The omnigenic model and polygenic prediction of complex traits

Iain Mathieson. Am J Hum Genet. .

Abstract

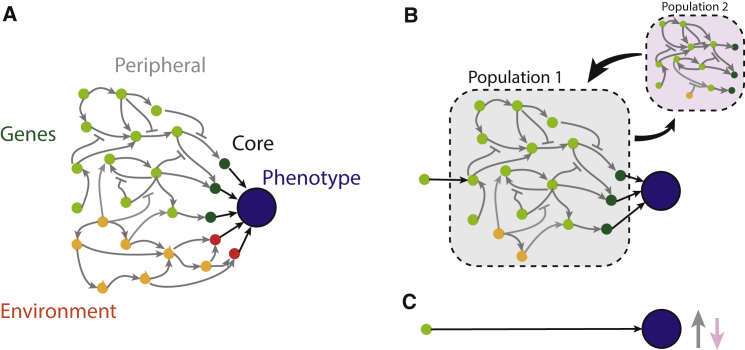
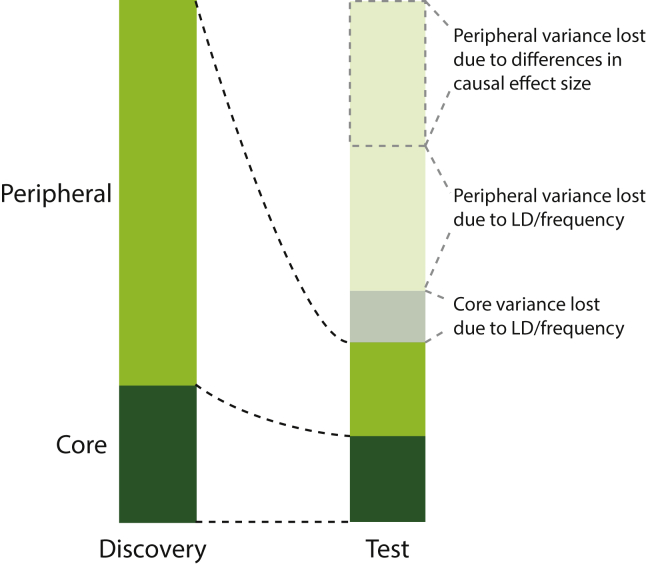
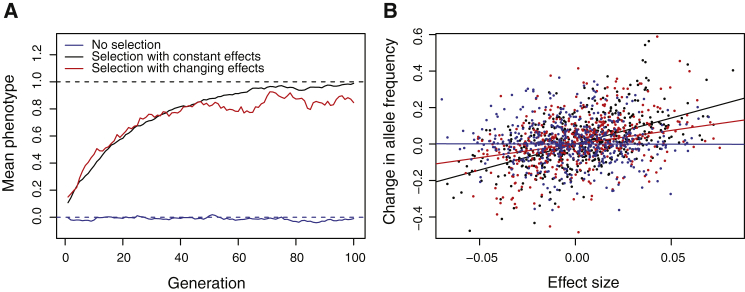
The omnigenic model was proposed as a framework to understand the highly polygenic architecture of complex traits revealed by genome-wide association studies (GWASs). I argue that this model also explains recent observations about cross-population genetic effects, specifically the low transferability of polygenic scores and the lack of clear evidence for polygenic selection. In particular, the omnigenic model explains why the effects of most GWAS variants vary between populations. This interpretation has several consequences for the evolutionary interpretation and practical use of GWAS summary statistics and polygenic scores. First, some polygenic scores may be applicable only in populations of the same ancestry and environment as the discovery population. Second, most GWAS associations will have differing effects between populations and are unlikely to be robust clinical targets. Finally, it may not always be possible to detect polygenic selection from population genetic data. These considerations make it difficult to interpret the clinical and evolutionary meanings of polygenic scores without an explicit model of genetic architecture.


Conflict of interest statement

Declaration of interests The author declares no competing interests.

Figures

Figure 1
Figure 1
The omnigenic model (A) Schematic of the omnigenic model (after Liu et al.4). Genetic factors in green and environmental factors in orange, with arrows showing interactions. Peripheral factors are lightly shaded whereas core factors with direct effects on phenotype are darkly shaded. (B) A gene’s-eye perspective. A single peripheral gene’s effect on the phenotype is filtered through part of the network (gray box). (C) The GWAS perspective. The effect of a causal variant as measured by an association study in a single population (gray arrow in C) is the expected value of its effect, with respect to the distribution of genetic (i.e., allele frequencies) and environmental factors in the population. In a different population (pink box in B), the weights and possibly structure of the network change, leading to a different expected effect size (pink arrow in C).
Figure 2
Figure 2
Conceptual schematic of the loss of variance explained in a population different to the discovery population Some of the lost variance could potentially be recovered through statistical approaches, but some (dashed outline) could not, and would provide an upper bound on the transferability of the polygenic score.
Figure 3
Figure 3
Simulation of polygenic selection When effect sizes change over time, polygenic adaption still occurs but the relationship between effect size and allele frequency change is attenuated. (A) Population mean phenotype as a function of time in a Wright-Fisher population of 1,000 sexually reproducing haploid individuals with 1,000 unlinked alleles, each with phenotypic effect drawn from a N(0, 0.025) distribution. Before generation 0 (not shown), the optimal fitness is 0 (dashed blue line) After generation 0, the optimal fitness in the no selection case (blue) remains the same, while in the selection cases (black and red), it is 1. In both cases the fitness function is a standard Gaussian distribution function around the optimum. In the case of changing effects (red), the effect of each allele changes every generation by an amount drawn from a N(0, 0.0025) distribution. (B) Change in frequency against effect size in generation 100 for alleles that are still polymorphic. Each point represents a single allele and solid lines show the regression of change in frequency against effect size for the three different scenarios. In the case of selection with changing effects (red line), the correlation between effect size and frequency change is lower compared to the case of constant effect size (black line), even though selection is equally effective. Since the correlation between effect size and frequency is the signal that drives most tests for polygenic selection, this explains why such tests may not detect selection under this model.

Similar articles

Cited by

References

    1. Visscher P.M., Wray N.R., Zhang Q., Sklar P., McCarthy M.I., Brown M.A., Yang J. 10 Years of GWAS Discovery: Biology, Function, and Translation. Am. J. Hum. Genet. 2017;101:5–22. - PMC - PubMed
    1. Boyle E.A., Li Y.I., Pritchard J.K. An Expanded View of Complex Traits: From Polygenic to Omnigenic. Cell. 2017;169:1177–1186. - PMC - PubMed
    1. Sinnott-Armstrong N., Naqvi S., Rivas M., Pritchard J.K. GWAS of three molecular traits highlights core genes and pathways alongside a highly polygenic background. eLife. 2021;10:10. - PMC - PubMed
    1. Liu X., Li Y.I., Pritchard J.K. Trans Effects on Gene Expression Can Drive Omnigenic Inheritance. Cell. 2019;177:1022–1034.e6. - PMC - PubMed
    1. Hivert V., Sidorenko J., Rohart F., Goddard M.E., Yang J., Wray N.R., Yengo L., Visscher P.M. Estimation of non-additive genetic variance in human complex traits from a large sample of unrelated individuals. Am. J. Hum. Genet. 2021;108:786–798. - PMC - PubMed

Publication types

LinkOut - more resources