. 2021 Oct;83(4):473-482.
doi: 10.1016/j.jinf.2021.07.034. Epub 2021 Jul 28.

Epidemiological data and genome sequencing reveals that nosocomial transmission of SARS-CoV-2 is underestimated and mostly mediated by a small number of highly infectious individuals

Affiliations

Epidemiological data and genome sequencing reveals that nosocomial transmission of SARS-CoV-2 is underestimated and mostly mediated by a small number of highly infectious individuals

Sheila F Lumley et al. J Infect. 2021 Oct.

Abstract

Objectives: Despite robust efforts, patients and staff acquire SARS-CoV-2 infection in hospitals. We investigated whether whole-genome sequencing enhanced the epidemiological investigation of healthcare-associated SARS-CoV-2 acquisition.

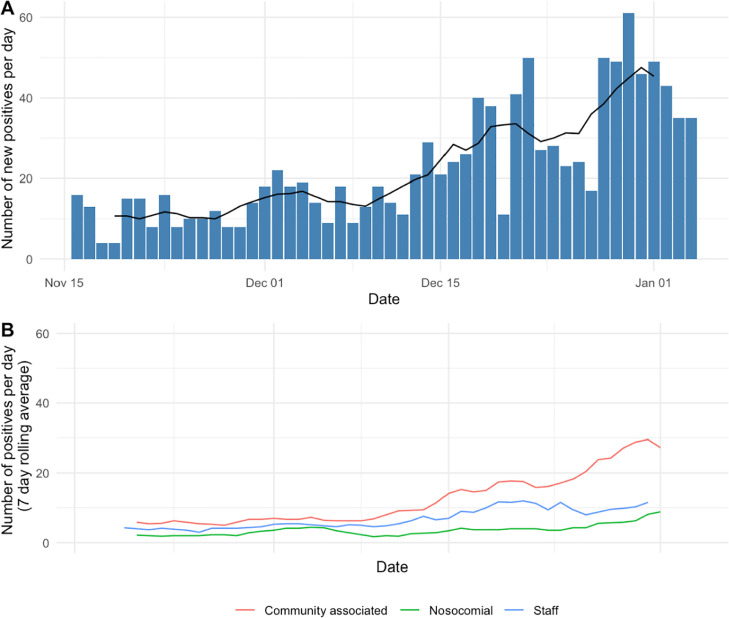
Methods: From 17-November-2020 to 5-January-2021, 803 inpatients and 329 staff were diagnosed with SARS-CoV-2 infection at four Oxfordshire hospitals. We classified cases using epidemiological definitions, looked for a potential source for each nosocomial infection, and evaluated genomic evidence supporting transmission.

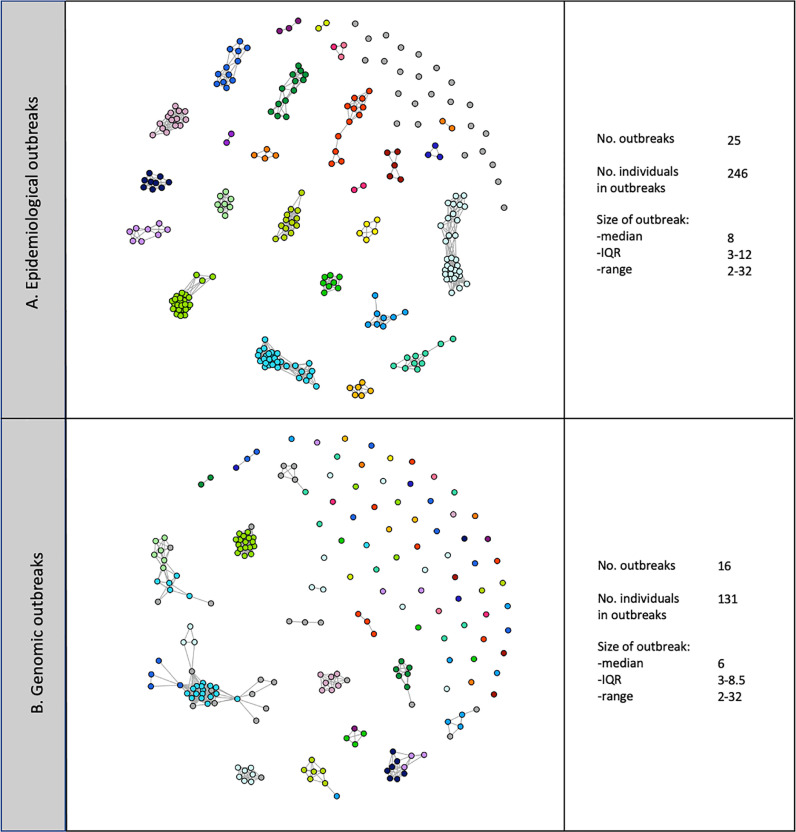
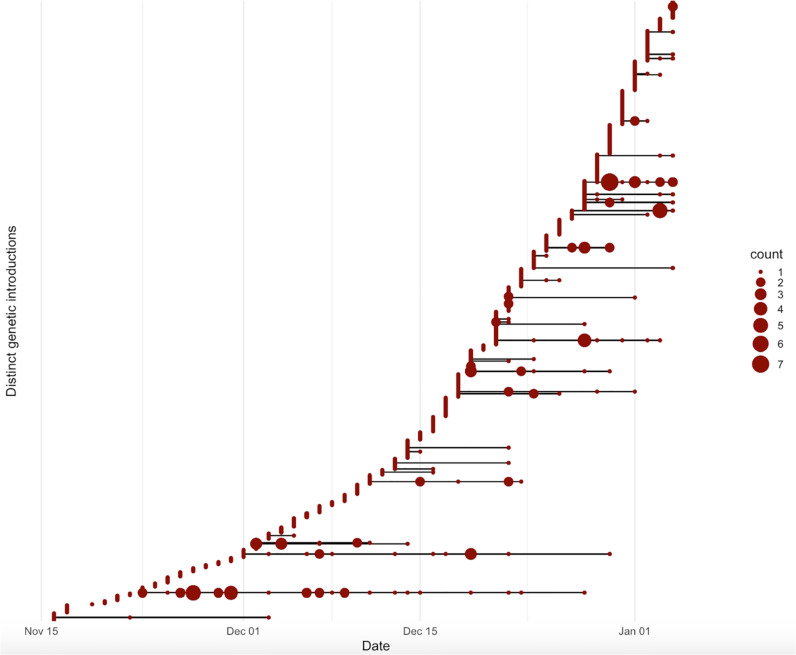
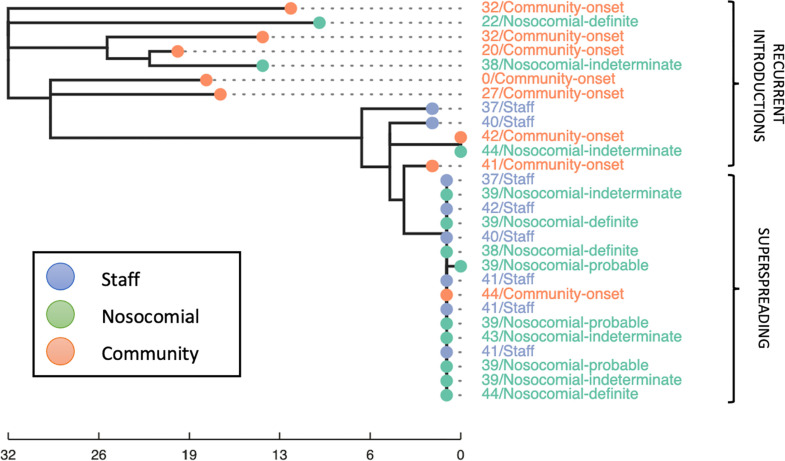
Results: Using national epidemiological definitions, 109/803(14%) inpatient infections were classified as definite/probable nosocomial, 615(77%) as community-acquired and 79(10%) as indeterminate. There was strong epidemiological evidence to support definite/probable cases as nosocomial. Many indeterminate cases were likely infected in hospital: 53/79(67%) had a prior-negative PCR and 75(95%) contact with a potential source. 89/615(11% of all 803 patients) with apparent community-onset had a recent hospital exposure. Within 764 samples sequenced 607 genomic clusters were identified (>1 SNP distinct). Only 43/607(7%) clusters contained evidence of onward transmission (subsequent cases within ≤ 1 SNP). 20/21 epidemiologically-identified outbreaks contained multiple genomic introductions. Most (80%) nosocomial acquisition occurred in rapid super-spreading events in settings with a mix of COVID-19 and non-COVID-19 patients.

Conclusions: Current surveillance definitions underestimate nosocomial acquisition. Most nosocomial transmission occurs from a relatively limited number of highly infectious individuals.

Keywords: Epidemiology; Nosocomial infection; SARS-CoV-2; Whole genome sequencing.


Conflict of interest statement

Declaration of Competing Interest DWE declares lecture fees from Gilead, outside the submitted work. No other author has a conflict of interest to declare.

Figures

Fig 1
Fig. 1
Epidemic curves showing number of new SARS-CoV-2 PCR staff and inpatient positives at Oxford University Hospitals from 17 November 2020 - 5 January 2021 based on clinical microbiology laboratory diagnosis by PCR. (A) total number of staff and inpatient positives (blue bars showing new positives per day, black line shows 7 day rolling average) (B) SARS-CoV-2 positives split by staff and patients (nosocomial (definite, probable and indeterminate) and community-onset according to national surveillance definitions), lines show 7 day rolling average. (For interpretation of the references to colour in this figure legend, the reader is referred to the web version of this article.)
Fig 2
Fig. 2
Outbreaks containing at least one definite or probable nosocomial case. (A) Using epidemiological data alone (nodes are linked purely using ward-based contacts) isolated grey nodes indicate individuals in a genomic but not epidemiologically-defined outbreak, (B) Using both epidemiological data and genomic data (nodes are linked both epidemiologically and genomically), isolated nodes indicate individuals in an epidemiological but not genomic outbreak. Each node represents an individual, all individuals in an epidemiological or genomic outbreak are shown in panel A with the sequenced subset in panel B. Node colours indicate the epidemiological group, grey nodes were not assigned to an epidemiological group. Lines indicate ward contact within an outbreak, line length is insignifiant. This demonstrates that epidemiological outbreaks consist of multiple genomic outbreaks and individual introductions, and conversely genomic outbreaks span multiple wards/epidemiological outbreaks. 69/176 (39%) nosocomial cases were not sequenced.
Fig 3
Fig. 3
Timing and size of SARS-CoV-2 genetic clusters. SARS-CoV-2 was introduced to OUH on at least 607 occasions, with evidence of onward transmission on 43 occasions. Isolates > 1 SNP from any previous sample were defined as distinct introductions and are plotted on separate horizontal lines, according to the date of the first positive sample in OUH for each individual. The size of the red dot indicates number of individuals diagnosed on each day. (For interpretation of the references to colour in this figure legend, the reader is referred to the web version of this article.)
Fig 4
Fig. 4
Example phylogeny demonstrating a superspreading event and recurrent introductions on a single ward at hospital “B”. The node and label colour indicates broad epidemiological classification (community-onset, nosocomial, staff). The tip label gives the day of the outbreak the individual tested positive followed by the full epidemiological classification. The scale bar represents SNP distance. All cases were classified as part of the same epidemiological outbreak, however WGS reveals multiple introductions. The “community-onset” case diagnosed on day 44 of the outbreak, had a previous hospital admission with exposure on this ward during a superspreading event.

Comment in

Similar articles

Cited by

References

    1. Wang D., Hu B., Hu C., Zhu F., Liu X., Zhang J. Clinical characteristics of 138 hospitalized patients with 2019 novel Coronavirus-infected pneumonia in Wuhan, China. JAMA. 2020;323:1061–1069. - PMC - PubMed
    1. Carter B., Collins J.T., Barlow-Pay F., Rickard F., Bruce E., Verduri A. Nosocomial COVID-19 infection: examining the risk of mortality. The COPE-nosocomial study (COVID in older people) J Hosp Infect. 2020;106:376–384. - PMC - PubMed
    1. Discombe M. Covid infections caught in hospital rise by a third in one week n.d. https://www.hsj.co.uk/patient-safety/covid-infections-caught-in-hospital... (accessed May 20, 2021).
    1. Campbell D., Bawden A. Up to 8,700 patients died after catching Covid in English hospitals. Guardian. 2021 https://www.theguardian.com/world/2021/may/24/up-to-8700-patients-died-a....
    1. Eyre D.W., Lumley S.F., O'Donnell D., Campbell M., Sims E., Lawson E. Differential occupational risks to healthcare workers from SARS-CoV-2 observed during a prospective observational study. Elife. 2020;9 doi: 10.7554/eLife.60675. - DOI - PMC - PubMed

Publication types