. 2021 Oct:174:73-83.
doi: 10.1016/j.freeradbiomed.2021.07.037. Epub 2021 Jul 28.

Oxidized GAPDH transfers S-glutathionylation to a nuclear protein Sirtuin-1 leading to apoptosis

Affiliations

Oxidized GAPDH transfers S-glutathionylation to a nuclear protein Sirtuin-1 leading to apoptosis

Syed Husain Mustafa Rizvi et al. Free Radic Biol Med. 2021 Oct.

Abstract

Aims: S-glutathionylation is a reversible oxidative modification of protein cysteines that plays a critical role in redox signaling. Glutaredoxin-1 (Glrx), a glutathione-specific thioltransferase, removes protein S-glutathionylation. Glrx, though a cytosolic protein, can activate a nuclear protein Sirtuin-1 (SirT1) by removing its S-glutathionylation. Glrx ablation causes metabolic abnormalities and promotes controlled cell death and fibrosis in mice. Glyceraldehyde 3-phosphate dehydrogenase (GAPDH), a key enzyme of glycolysis, is sensitive to oxidative modifications and involved in apoptotic signaling via the SirT1/p53 pathway in the nucleus. We aimed to elucidate the extent to which S-glutathionylation of GAPDH and glutaredoxin-1 contribute to GAPDH/SirT1/p53 apoptosis pathway.

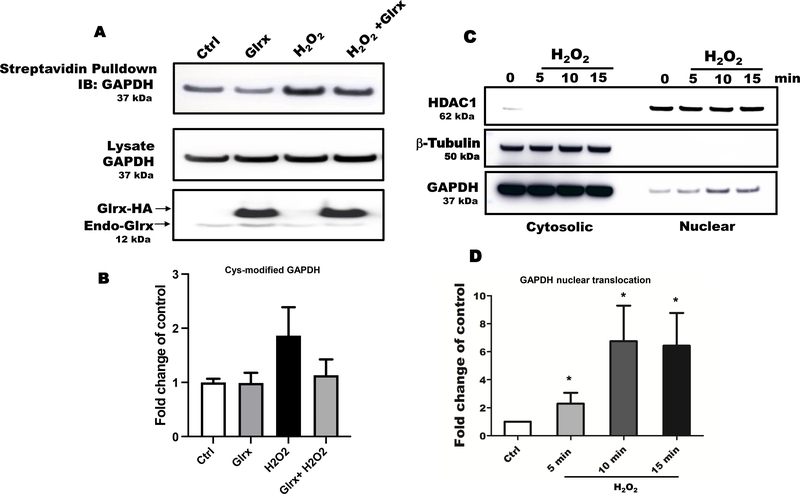
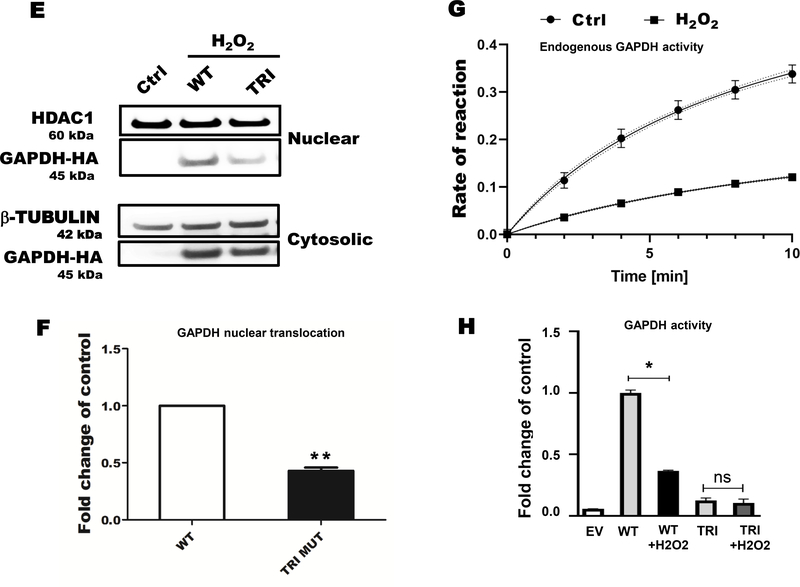
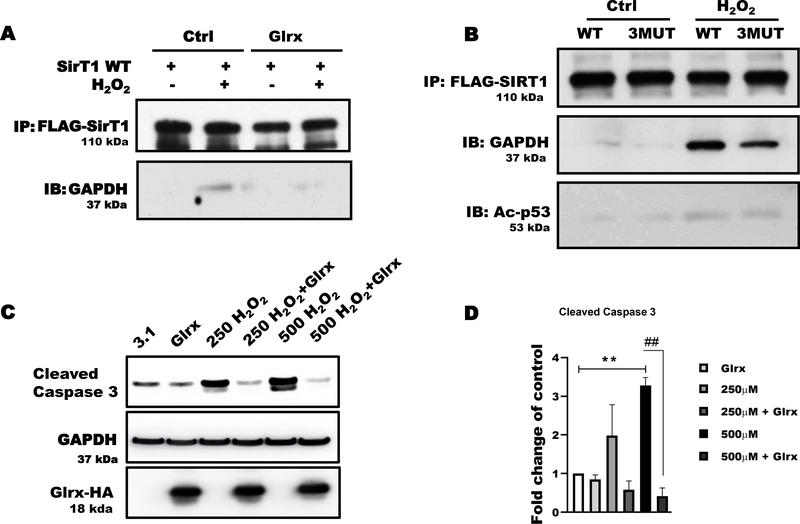
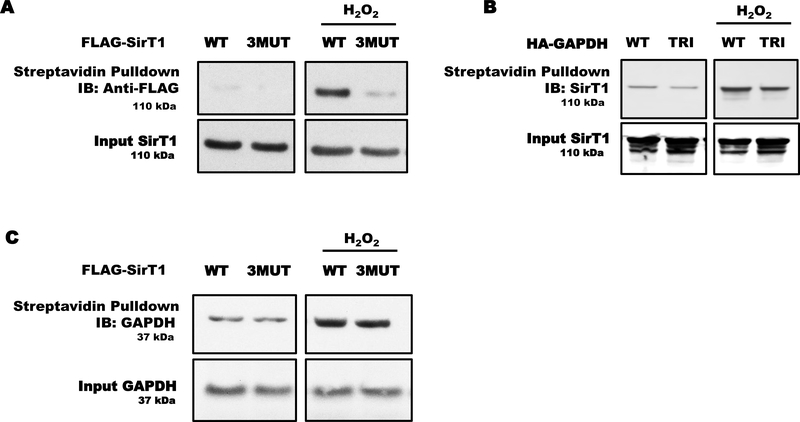
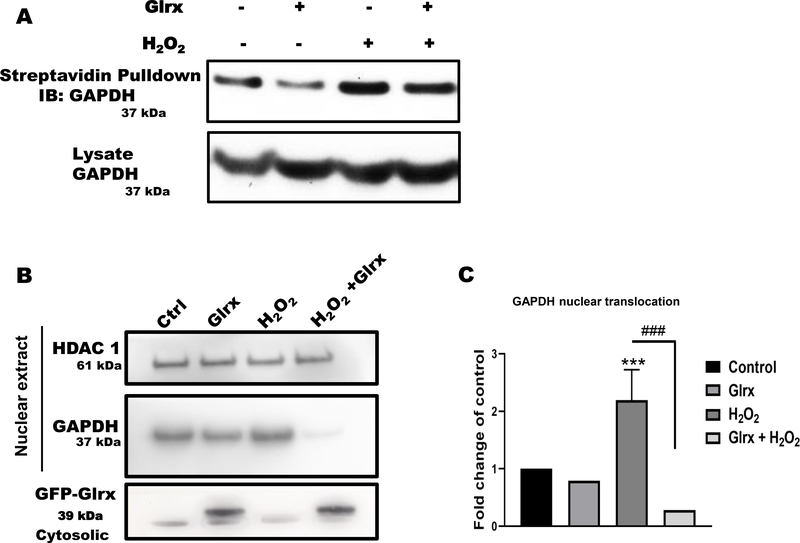
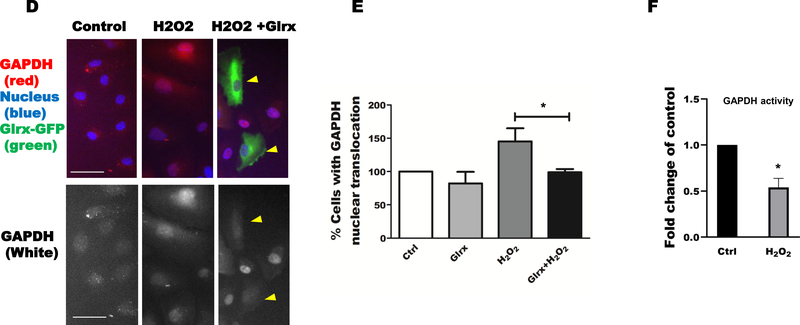
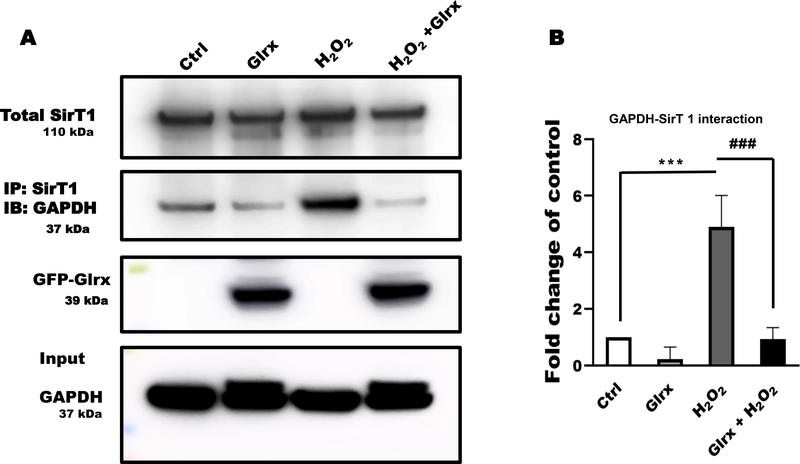
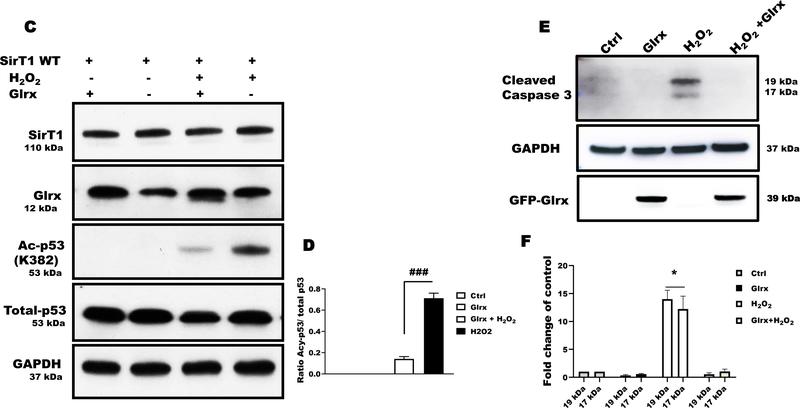
Results: Exposure of HEK 293T cells to hydrogen peroxide (H2O2) caused rapid S-glutathionylation and nuclear translocation of GAPDH. Nuclear GAPDH peaked 10-15 min after the addition of H2O2. Overexpression of Glrx or redox dead mutant GAPDH inhibited S-glutathionylation and nuclear translocation. Nuclear GAPDH formed a protein complex with SirT1 and exchanged S-glutathionylation to SirT1 and inhibited its deacetylase activity. Inactivated SirT1 remained stably bound to acetylated-p53 and initiated apoptotic signaling resulting in cleavage of caspase-3. We observed similar effects in human primary aortic endothelial cells suggesting the GAPDH/SirT1/p53 pathway as a common apoptotic mechanism.

Conclusions: Abundant GAPDH with its highly reactive-cysteine thiolate may function as a cytoplasmic rheostat to sense oxidative stress. S-glutathionylation of GAPDH may relay the signal to the nucleus where GAPDH trans-glutathionylates nuclear proteins such as SirT1 to initiate apoptosis. Glrx reverses GAPDH S-glutathionylation and prevents its nuclear translocation and cytoplasmic-nuclear redox signaling leading to apoptosis. Our data suggest that trans-glutathionylation is a critical step in apoptotic signaling and a potential mechanism that cytosolic Glrx controls nuclear transcription factors.

Keywords: GAPDH; Glutaredoxin; S-Glutathionylation; SirT1; Trans-Glutathionylation.


Conflict of interest statement

Conflict of interest

The authors declare that they have no conflict of interest.

Figures

Figure 1.
Figure 1.. Oxidative stress induced S-glutathionylation and nuclear translocation of GAPDH in HEK 293T cells
A) Hydrogen peroxide increased GAPDH S-glutathionylation in HEK 293T cells as measured by cysteine labeling. Glutaredoxin-1 overexpression attenuated GAPDH S-glutathionylation. B) The graph shows the density of biotinylated-(pulled down) GAPDH, control as 1. C) Hydrogen peroxide caused maximal GAPDH translocation to the nucleus in 5–15 minutes based on subcellular fractionation studies. The absence of β–tubulin in the nuclear fraction demonstrated minimal cross contamination. D) Bar graph showing nuclear translocation of GAPDH in a time dependent manner (n=3). For panels A-D, HEK 293T cells were transfected with Glrx or an empty vector (pcDNA 3.1) as a control, exposed with and without 500 μM H2O2 for 15 minutes. E) A cysteine-to-serine mutant GAPDH (TRI) minimally translocated to the nucleus in response to H2O2 compared to WT GAPDH. F) Bar graph showing fold change nuclear translocation WT vs mutant GAPDH compared to control (n=3). Density of nuclear HA-GAPDH after H2O2 exposure is considered as 1. **p<0.01. G) Hydrogen peroxide inhibited endogenous GAPDH activity in HEK 293T cells after 10 minutes. Kinetics were fitted using the Michaelis-Menten plugin in Prism 8.1.0. Data is presented as means ± SD of N = 3. H) Hydrogen peroxide markedly inhibited the GAPDH activity of overexpressed WT GAPDH in HEK 293T cells. Independent on H2O2 exposure, overexpressed mutant GAPDH was catalytically inactive. For panel E-F, HEK 293T cells were transfected with HA-labelled WT or 3 Cys-mutant (TRI) GAPDH or an empty vector (EV) as a control. Cells were treated with 500 μM H2O2 for 15 minutes. n=3. GAPDH activity is presented as a fold change of control. Data are presented as means ± SD of n=3 and analyzed with Mann-Whitney U test (*p<0.05). Statistical significance was determined using one-way ANOVA with Tukey’s multiple comparison test. Differences were considered statistically significant with a p-value of <0.05.
Figure 2.
Figure 2.. Glutathionylation of GAPDH occurs on cysteines in HEK 293T cells
A) Controls MS spectra is showing carbamidomethylation which represents alkylation of protein cysteines. B) Hydrogen peroxide treatment causes S-glutathionylation at cysteine 247. C) while, cysteine 152 and 156 formed reversible disulfide bonding following hydrogen peroxide exposure.
Figure 3.
Figure 3.. Glrx prevented the association of GAPDH with SirT1
A) Hydrogen peroxide induced GAPDH and SirT1 association in HEK 293T cells as demonstrated by co-immunoprecipitation. Glutaredoxin-1 (Glrx) overexpression markedly attenuated this association. B) The cysteine-to-serine mutant SirT1 (3MUT) prevented the H2O2-induced GAPDH-Ac-p53-SirT1 association demonstrated by co-immunoprecipitation. C) Different concentrations of H2O2 increased cleaved caspase-3. Glutaredoxin-1 overexpression abolished caspase-3 cleavage. GAPDH was used as a loading control. D) Quantitative assessment of cleaved-caspase 3 bands is shown as fold changes of caspase 3 activation in different groups (n=3). **p<0.01 compared to control as 1 (white bar). ##p<0.01 compared to between 500 μM H2O2 vs 500 μM H2O2 + Glrx. For panels A, B, and C, HEK 293T cells were transfected with empty vector (pcDNA 3.1), FLAG-SirT1, or Glrx with and without exposure to 500 μM H2O2 for 15 minutes. For caspase activity cells were treated with H2O2 for 8 hrs. Statistical significance was determined using one-way ANOVA with Tukey’s multiple comparison test. Differences were considered statistically significant with a p-value of <0.05.
Figure 4.
Figure 4.. GAPDH trans-glutathionylated SirT1
A) Hydrogen peroxide reversibly oxidized overexpressed WT SirT1 as measured by cysteine labeling. The overexpressed cysteine-to-serine mutant SirT1 (3MUT) showed only minor oxidation. B) Overexpressed mutant GAPDH (TRI) attenuated H2O2-induced oxidation of endogenous SirT1 in HEK 293T. C) Neither overexpressed WT nor mutant SirT1 (3MUT) affected H2O2-mediated oxidation of endogenous GAPDH. For all panels, HEK 293T cells were transfected with WT or mutant FLAG-SirT1 (3MUT) and WT or mutant HA-GAPDH (TRI).
Figure 5.
Figure 5.. Oxidative stress induced S-glutathionylation and nuclear translocation of GAPDH in HAEC
A) Hydrogen peroxide increased S-glutathionylation of GAPDH as measured by cysteine labeling. Glrx overexpression reversed GAPDH S-glutathionylation. B) Overexpression of Glrx inhibited H2O2-induced nuclear translocation of GAPDH in HAEC as detected by western blot. C) Bar graph showing fold change of nuclear translocation in western blot (n=3). Significance signs (*) compared to control and (#) compared between H2O2 vs Glrx+H2O2. D) immunofluorescence (green; Glrx, red; GAPDH; blue; nucleus, scale bar, 50 μm), representative photos showing H2O2-induced nuclear translocation, which is inhibited by Glrx overexpression (arrow heads). E) Bar graph showing fold change of nuclear translocation in immunofluorescence (n=3). Cell number with nuclear GAPDH in control is shown as 100%. F) Hydrogen peroxide inhibited endogenous GAPDH activity in HAEC. GAPDH activity is presented as a fold change of control. For all panels, HAECs were treated with 500 μM H2O2 for 15 minutes. Data are presented as means ± SD and were analyzed with Mann-Whitney U test. p-value of <0.05 (*), 0.01 (**), 0.001 (***). All the experiments repeated a minimum of three times.
Figure 6.
Figure 6.. Glrx attenuated S-glutathionylation of GAPDH and apoptotic signaling in HAEC exposed to H2O2
A) Hydrogen peroxide induced GAPDH and SirT1 interaction measured by co-immunoprecipitation that was completely abolished by adenoviral Glrx (GFP-Glrx) overexpression (n=3). B) Bar graph showing fold change of GAPDH band after IP with anti-SirT1, indicating GAPDH-SirT1 interaction (P< 0.001). C) Hydrogen peroxide induced Ac-p53 in HAEC, indicating inactive SirT1. Adenoviral Glrx overexpression inhibited the acetylation of p53. Total p53 expression levels remained unchanged as measured by Western blot. D) Bar graph showing ratio of Acy-p53 and total p53 of western blot (n=3) (P< 0.001). E) Hydrogen peroxide caused cleavage of caspase-3 that was attenuated by Glrx overexpression. F) Bar graph showing fold change activation of caspase-3 by densitometric analysis of 19/17 kDa bands (n=3). *p<0.05 compared to other groups. For all panels, HAEC were treated with 500 μM H2O2 for 15 min, except caspase 3 activation in which cells were treated with H2O2 for 8 hrs. GAPDH served as a loading control. Statistical significance was determined using one-way ANOVA with Tukey’s multiple comparison test. Differences were considered statistically significant with a p-value of <0.05 (*), 0.01 (**), 0.001 (***). Significance signs (*) compared to control and (#) compared between H2O2 vs Glrx+H2O2..

Similar articles

Cited by

References

    1. Short JD, Downs K, Tavakoli S, Asmis R, Protein Thiol Redox Signaling in Monocytes and Macrophages, Antioxid. Redox Signal. 25 (2016) 816–835. 10.1089/ars.2016.6697. - DOI - PMC - PubMed
    1. Ullevig S, Kim HS, Asmis R, S-glutathionylation in monocyte and macrophage (dys)function, Int. J. Mol. Sci. 14 (2013) 15212–15232. 10.3390/ijms140815212. - DOI - PMC - PubMed
    1. Gorelenkova Miller O, Mieyal JJ, Sulfhydryl-mediated redox signaling in inflammation: role in neurodegenerative diseases, Arch. Toxicol. 89 (2015) 1439–1467. 10.1007/s00204-015-1496-7. - DOI - PubMed
    1. Allen EMG, Mieyal JJ, Protein-thiol oxidation and cell death: regulatory role of glutaredoxins, Antioxid. Redox Signal. 17 (2012) 1748–1763. 10.1089/ars.2012.4644. - DOI - PMC - PubMed
    1. van der Vliet A, Janssen-Heininger YMW, Anathy V, Oxidative stress in chronic lung disease: From mitochondrial dysfunction to dysregulated redox signaling, Mol. Aspects Med. 63 (2018) 59–69. 10.1016/j.mam.2018.08.001. - DOI - PMC - PubMed

Publication types