

Quantification of m6A RNA methylation modulators pattern was a potential biomarker for prognosis and associated with tumor immune microenvironment of pancreatic adenocarcinoma
- PMID: 34332578
- PMCID: PMC8325189
- DOI: 10.1186/s12885-021-08550-9
Quantification of m6A RNA methylation modulators pattern was a potential biomarker for prognosis and associated with tumor immune microenvironment of pancreatic adenocarcinoma
Abstract
Background: m6A is the most prevalent and abundant form of mRNA modifications and is closely related to tumor proliferation, differentiation, and tumorigenesis. In this study, we try to conduct an effective prediction model to investigated the function of m6A RNA methylation modulators in pancreatic adenocarcinoma and estimated the potential association between m6A RNA methylation modulators and tumor microenvironment infiltration for optimization of treatment.
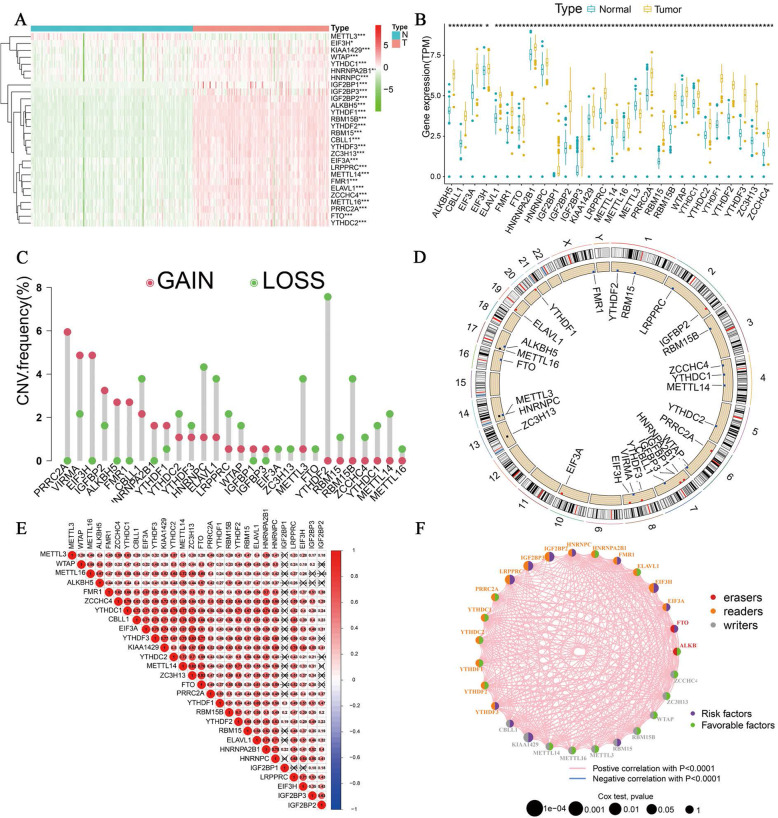
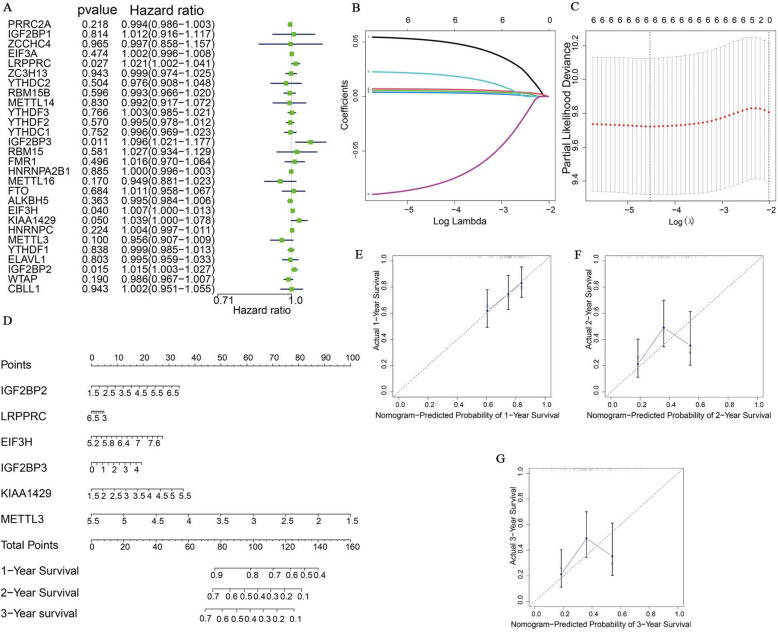
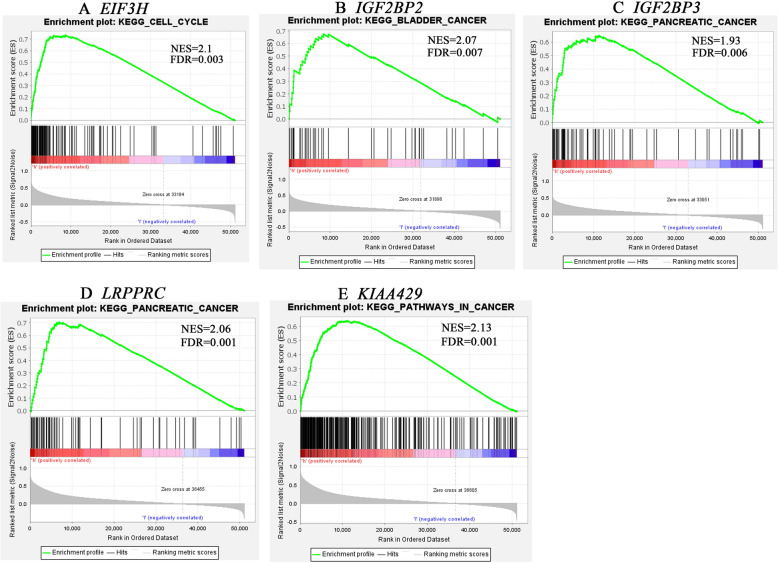
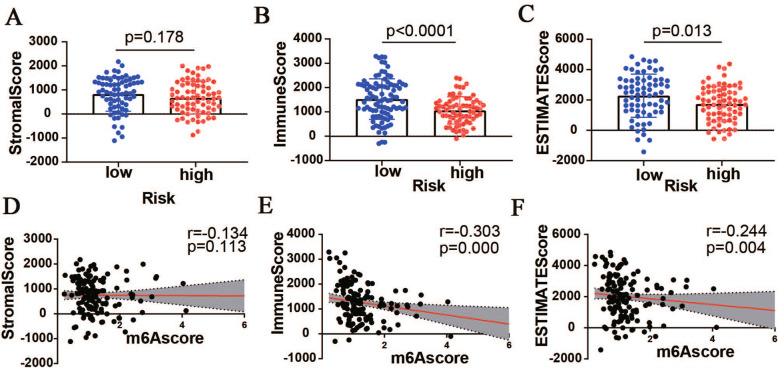
Methods: Expression of 28 m6A RNA methylation modulators and clinical data of patients with pancreatic adenocarcinoma and normal samples were obtained from TCGA and GTEx database. Differences in the expression of 28 m6A RNA methylation modulators between tumour (n = 40) and healthy (n = 167) samples were compared by Wilcoxon test. LASSO Cox regression was used to select m6A RNA methylation modulators to analyze the relationship between expression and clinical characteristics by univariate and multivariate regression. A risk score prognosis model was conducted based on the expression of select m6A RNA methylation modulators. Bioinformatics analysis was used to explore the association between the m6Ascore and the composition of infiltrating immune cells between high and low m6Ascore group by CIBERSORT algorithm. Evaluation of m6Ascore for immunotherapy was analyzed via the IPS and three immunotherapy cohort. Besides, the biological signaling pathways of the m6A RNA methylation modulators were examined by gene set enrichment analysis (GSEA).
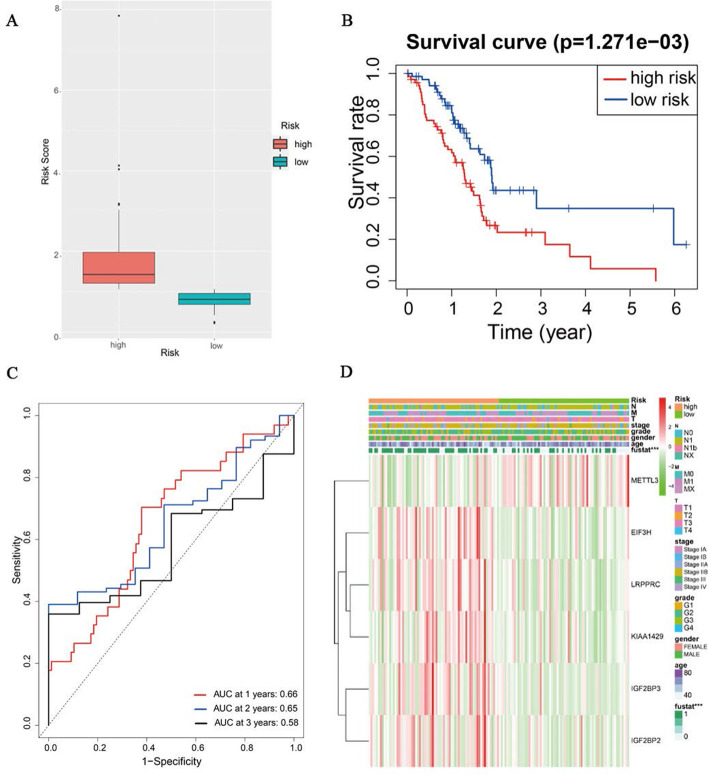
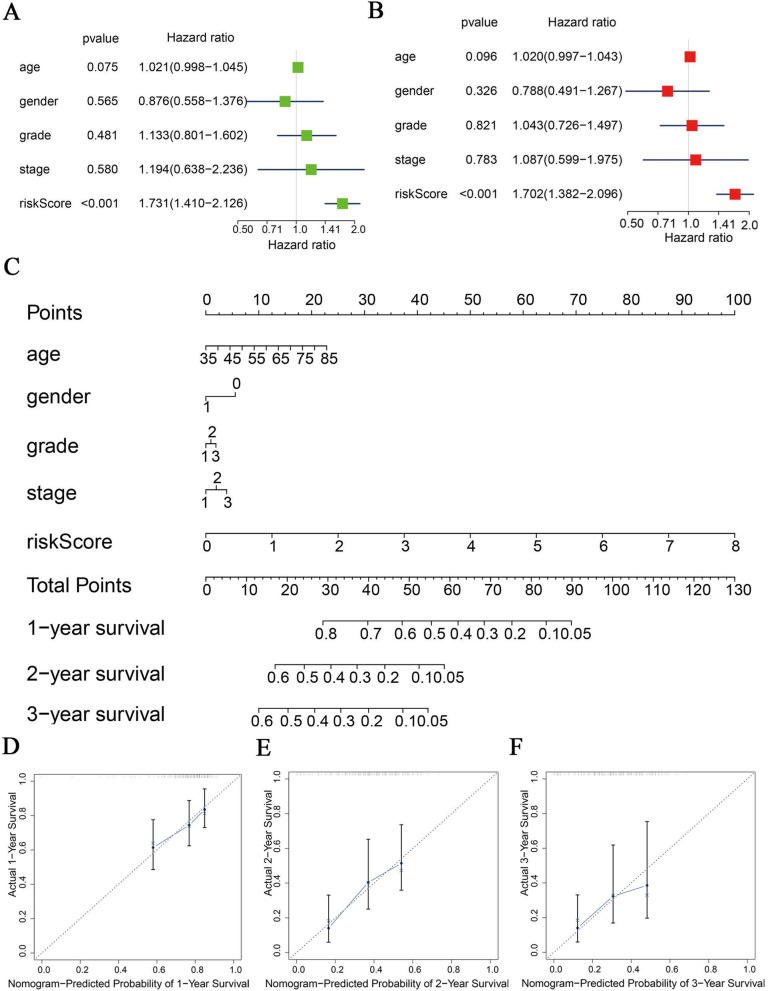
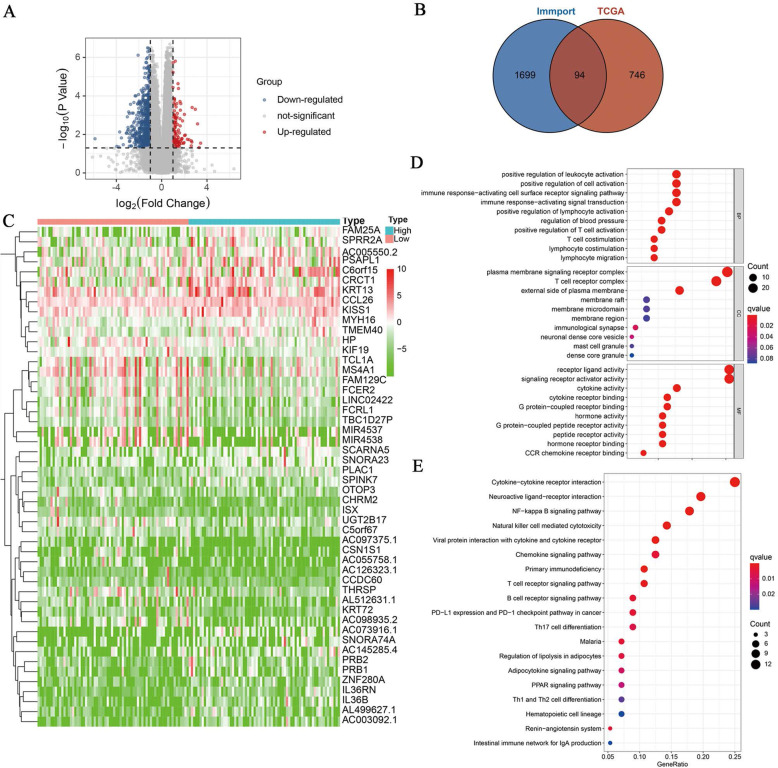
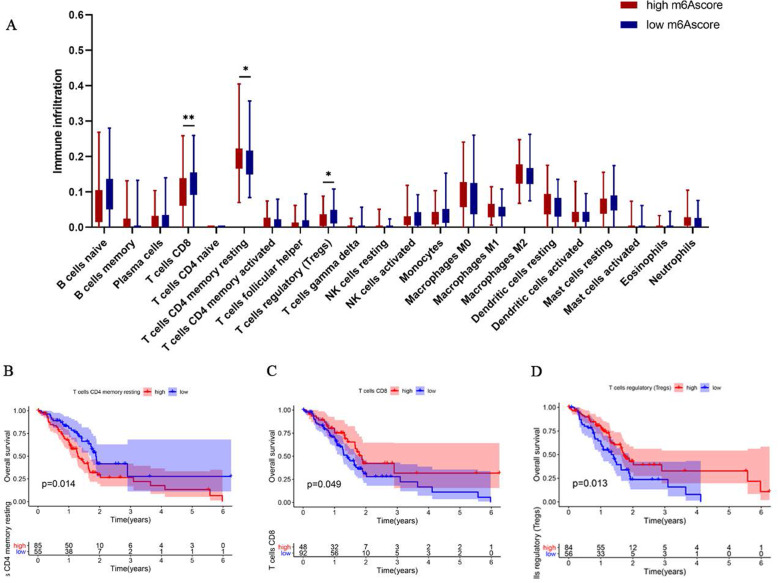
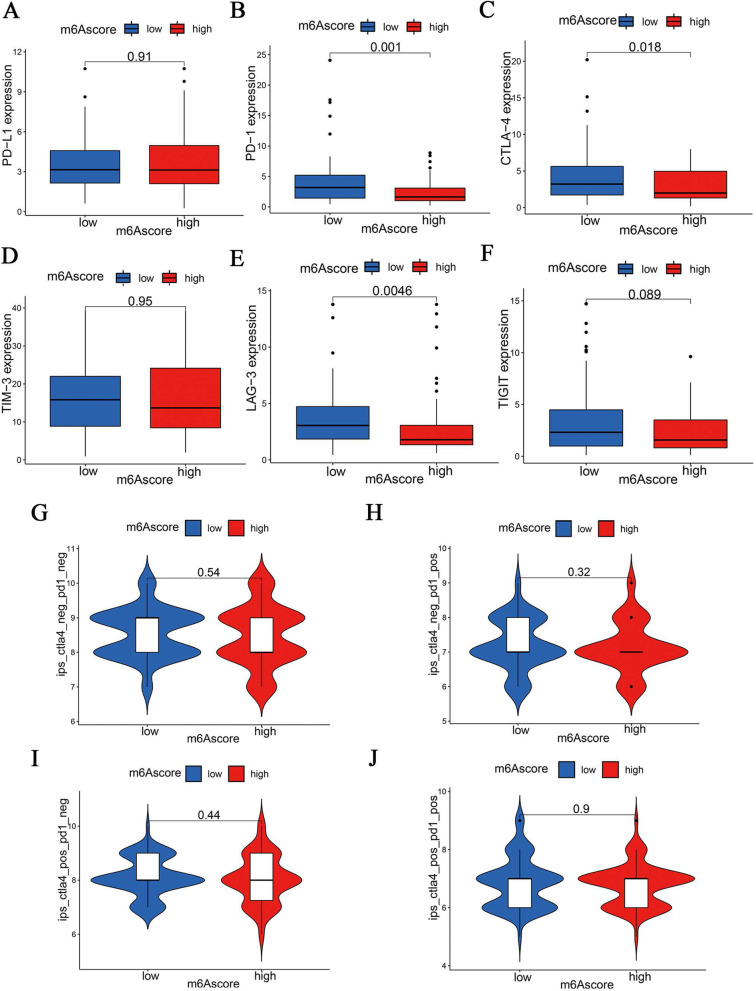
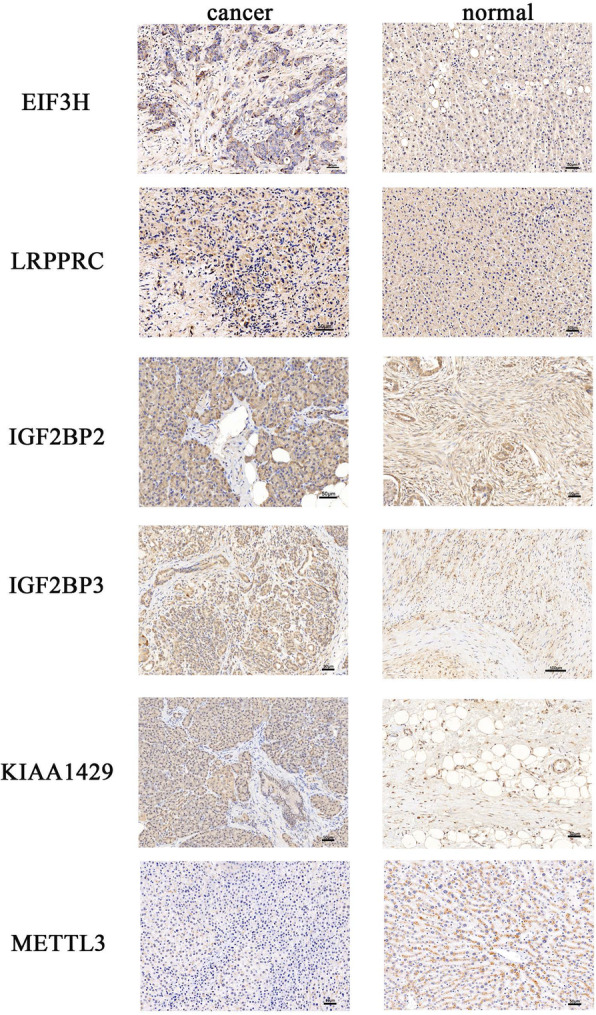
Results: Expression of 28 m6A RNA methylation modulators were upregulated in patients with PAAD except for MTEEL3. An m6Ascore prognosis model was established, including KIAA1429, IGF2BP2, IGF2BP3, METTL3, EIF3H and LRPPRC was used to predict the prognosis of patients with PAAD, the high risk score was an independent prognostic indicator for pancreatic adenocarcinoma, and a high risk score presented a lower overall survival. In addition, m6Ascore was related with the immune cell infiltration of PAAD. Patients with a high m6Ascore had lower infiltration of Tregs and CD8+T cells but a higher resting CD4+ T infiltration. Patients with a low m6Ascore displayed a low abundance of PD-1, CTLA-4 and TIGIT, however, the IPS showed no difference between the two groups. The m6Ascore applied in three immunotherapy cohort (GSE78220, TCGA-SKCM, and IMvigor210) did not exhibit a good prediction for estimating the patients' response to immunotherapy, so it may need more researches to figure out whether the m6A modulator prognosis model would benefit the prediction of pancreatic patients' response to immunotherapy.
Conclusion: Modulators involved in m6A RNA methylation were associated with the development of pancreatic cancer. An m6Ascore based on the expression of IGF2BP2, IGF2BP3, KIAA1429, METTL3, EIF3H and LRPPRC is proposed as an indicator of TME status and is instrumental in predicting the prognosis of pancreatic cancer patients.
Keywords: Immune cell infiltration; Immunotherapy; Pancreatic adenocarcinoma; Prognostic; m6A RNA methylation modulators; m6Ascore.
© 2021. The Author(s).
Conflict of interest statement
The authors report no conflicts of interest in this work. None of the authors have any personal or financial involvement with organizations that have financial interest in the content of this manuscript.
Figures
Similar articles
-
Comprehensive Analysis of m6A RNA Methylation Regulators and the Immune Microenvironment to Aid Immunotherapy in Pancreatic Cancer.Front Immunol. 2021 Nov 5;12:769425. doi: 10.3389/fimmu.2021.769425. eCollection 2021. Front Immunol. 2021. PMID: 34804059 Free PMC article.
-
Comprehensive Analysis of PD-L1 Expression, Immune Infiltrates, and m6A RNA Methylation Regulators in Esophageal Squamous Cell Carcinoma.Front Immunol. 2021 May 12;12:669750. doi: 10.3389/fimmu.2021.669750. eCollection 2021. Front Immunol. 2021. PMID: 34054840 Free PMC article.
-
CD8 + T-Cell-Related Genes: Deciphering Their Role in the Pancreatic Adenocarcinoma TME and Their Effect on Prognosis.Dig Dis Sci. 2025 Jan;70(1):262-284. doi: 10.1007/s10620-024-08715-z. Epub 2024 Nov 27. Dig Dis Sci. 2025. PMID: 39604668
-
Identify potential prognostic indicators and tumor-infiltrating immune cells in pancreatic adenocarcinoma.Biosci Rep. 2022 Feb 25;42(2):BSR20212523. doi: 10.1042/BSR20212523. Biosci Rep. 2022. PMID: 35083488 Free PMC article. Review.
-
The Mechanism and Latest Progress of m6A Methylation in the Progression of Pancreatic Cancer.Int J Biol Sci. 2025 Jan 13;21(3):1187-1201. doi: 10.7150/ijbs.104407. eCollection 2025. Int J Biol Sci. 2025. PMID: 39897038 Free PMC article. Review.
Cited by
-
RNA modifications in cancer immune therapy: regulators of immune cells and immune checkpoints.Front Immunol. 2024 Sep 20;15:1463847. doi: 10.3389/fimmu.2024.1463847. eCollection 2024. Front Immunol. 2024. PMID: 39372415 Free PMC article. Review.
-
Integrated Analyses of m6A Regulator-Mediated Methylation Modification Patterns and Tumor Microenvironment Infiltration Characterization in Pan-Cancer.Int J Mol Sci. 2022 Sep 23;23(19):11182. doi: 10.3390/ijms231911182. Int J Mol Sci. 2022. PMID: 36232485 Free PMC article.
-
m6A methylation modification and immune cell infiltration: implications for targeting the catalytic subunit m6A-METTL complex in gastrointestinal cancer immunotherapy.Front Immunol. 2023 Dec 15;14:1326031. doi: 10.3389/fimmu.2023.1326031. eCollection 2023. Front Immunol. 2023. PMID: 38187373 Free PMC article. Review.
-
Methyltransferase-like 3 upregulation is involved in the chemoresistance of non-small cell lung cancer.Ann Transl Med. 2022 Feb;10(3):139. doi: 10.21037/atm-21-6608. Ann Transl Med. 2022. PMID: 35284536 Free PMC article.
-
Novel Insights into The Roles of N6-methyladenosine (m6A) Modification and Autophagy in Human Diseases.Int J Biol Sci. 2023 Jan 1;19(2):705-720. doi: 10.7150/ijbs.75466. eCollection 2023. Int J Biol Sci. 2023. PMID: 36632456 Free PMC article. Review.
References
-
- Bray F, Ferlay J, Soerjomataram I, et al. Global cancer statistics 2018: GLOBOCAN estimates of incidence and mortality worldwide for 36 cancers in 185 countries. CA Cancer J Clin. 2018;68(6):394–24. 10.3322/caac.21492. - PubMed
MeSH terms
Substances
LinkOut - more resources
Full Text Sources
Medical
Research Materials
