. 2021 Sep 16;184(19):4969-4980.e15.
doi: 10.1016/j.cell.2021.07.025. Epub 2021 Jul 23.

Memory B cell repertoire for recognition of evolving SARS-CoV-2 spike

Affiliations

Memory B cell repertoire for recognition of evolving SARS-CoV-2 spike

Pei Tong et al. Cell. .

Abstract

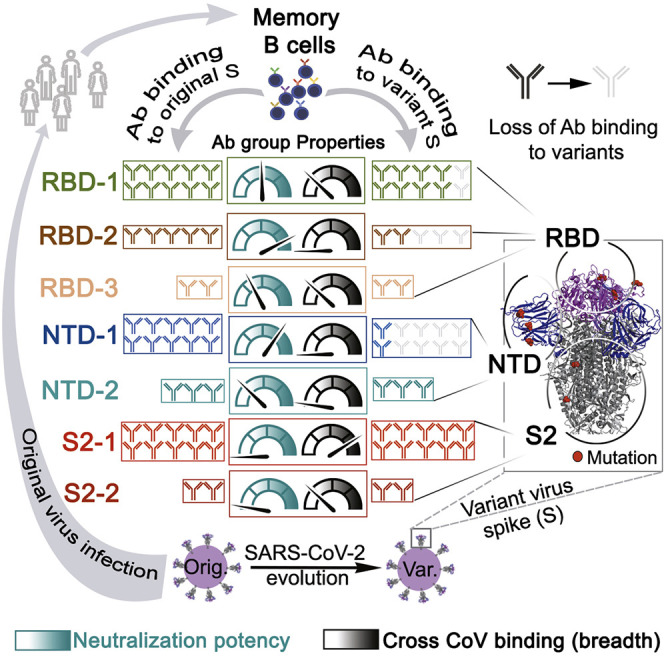
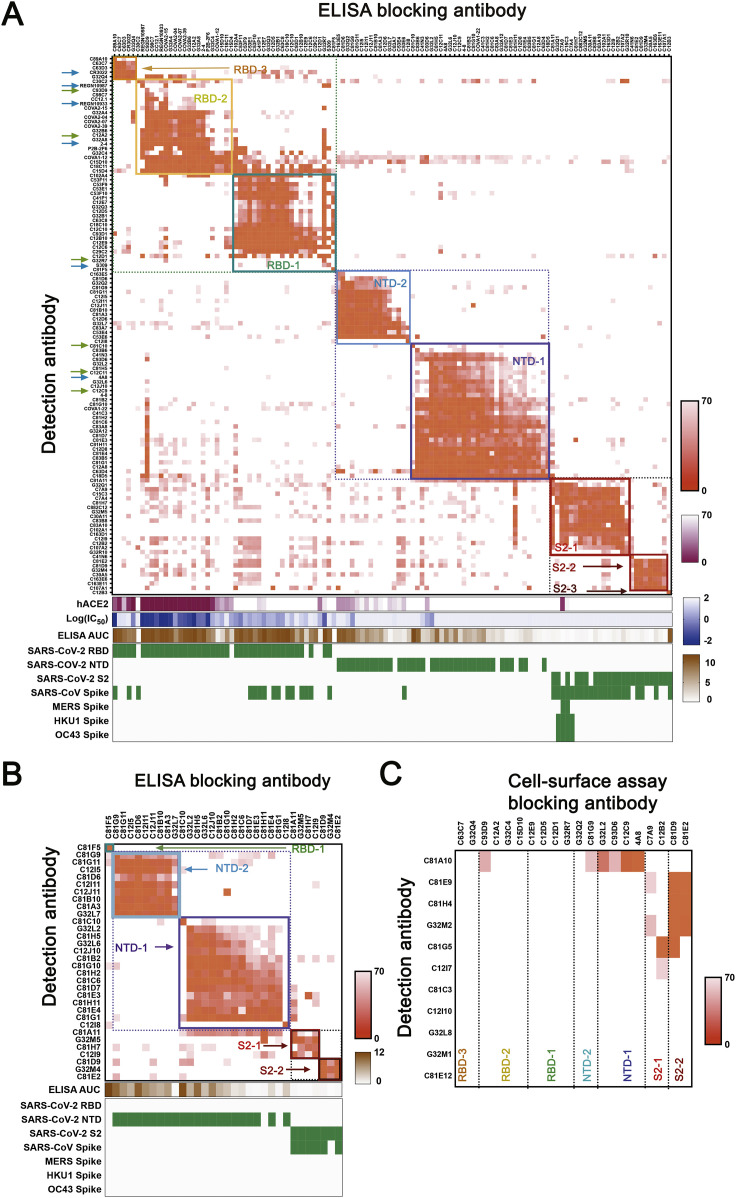
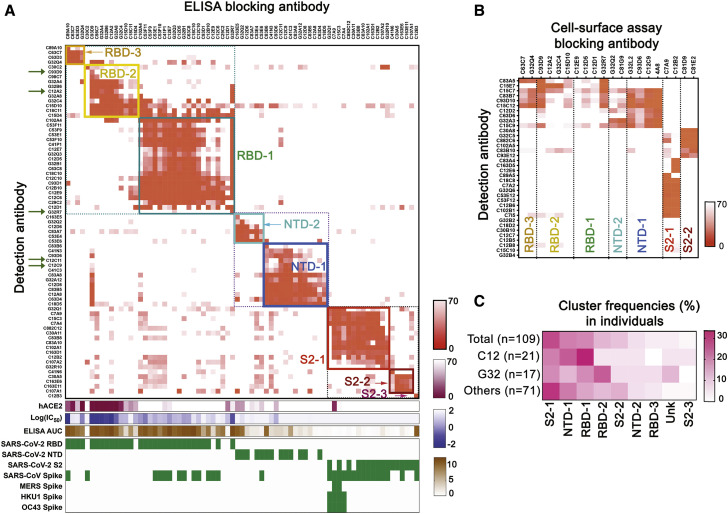
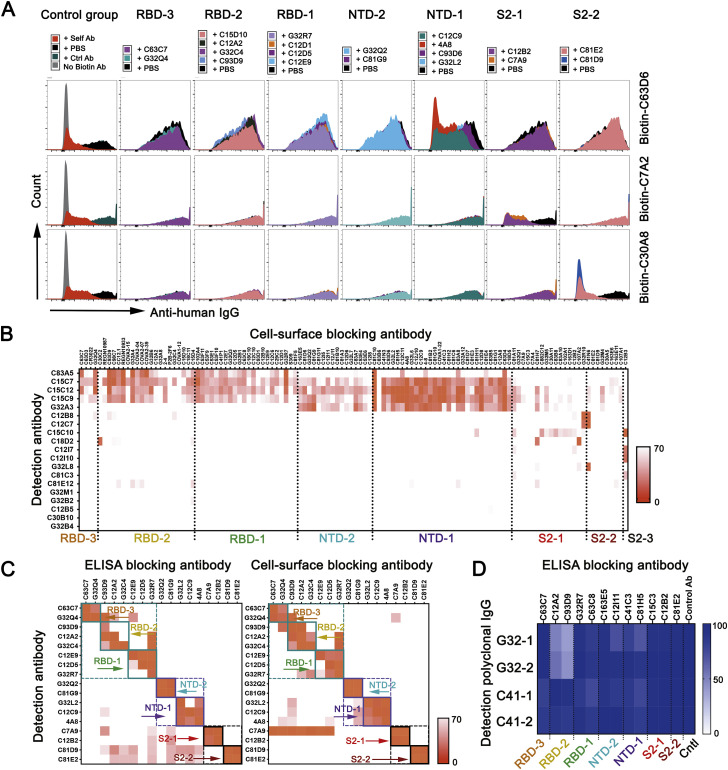
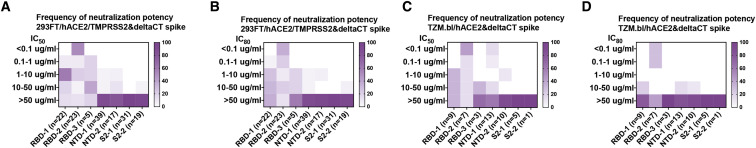
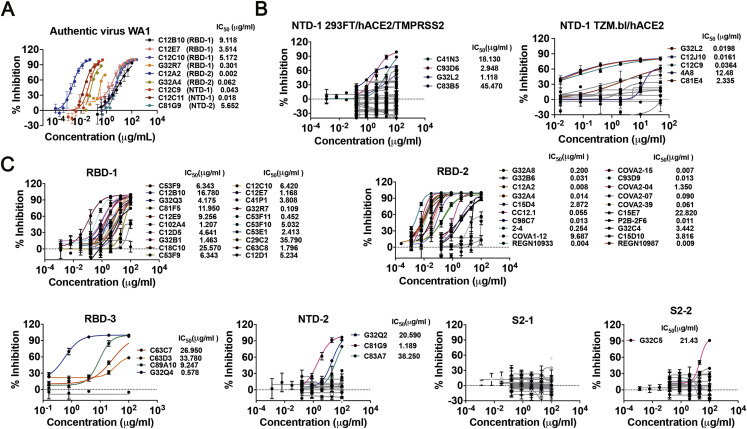
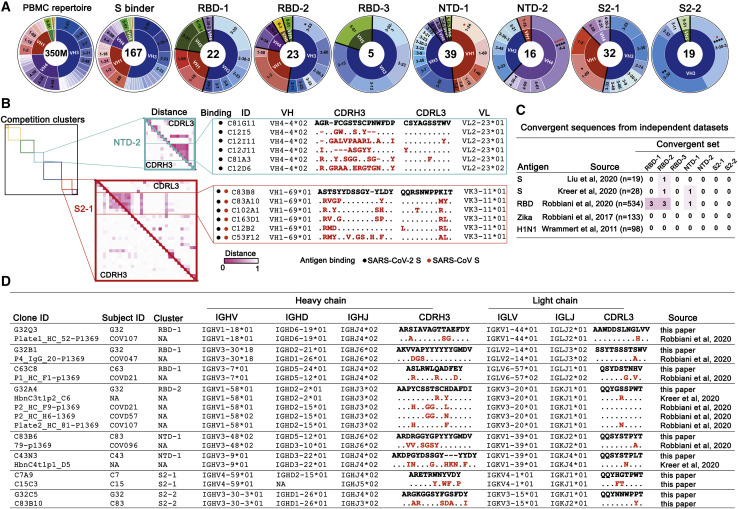
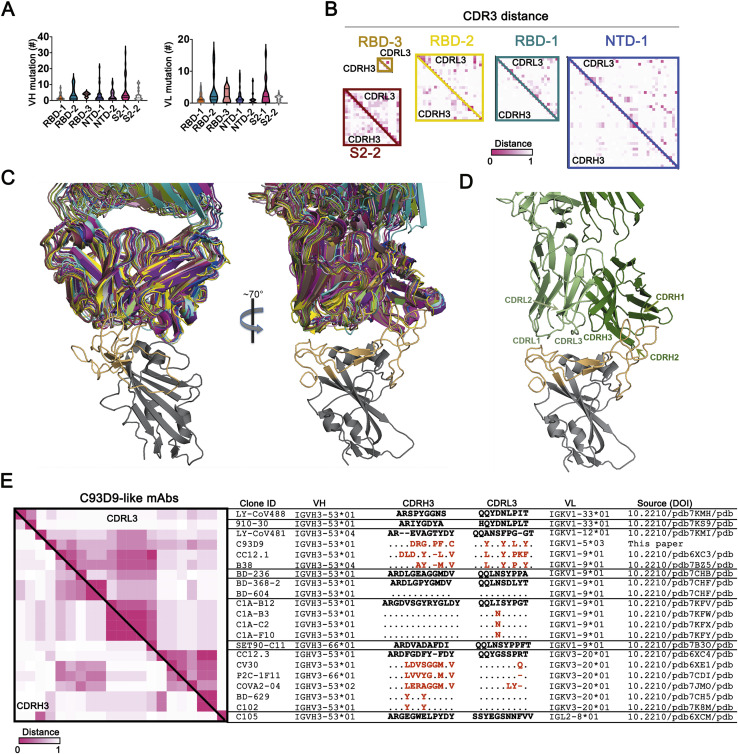
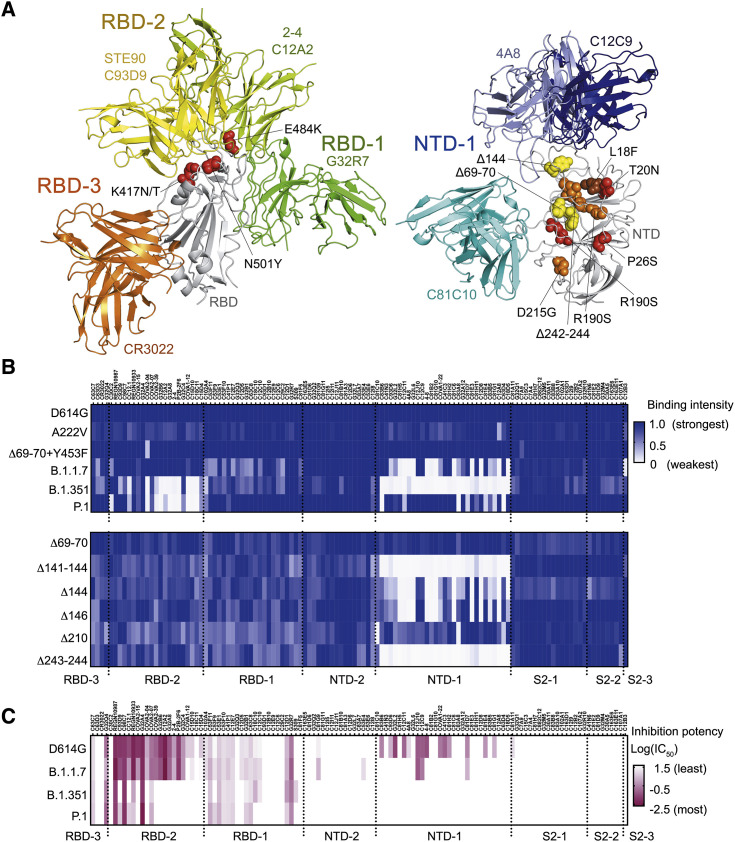
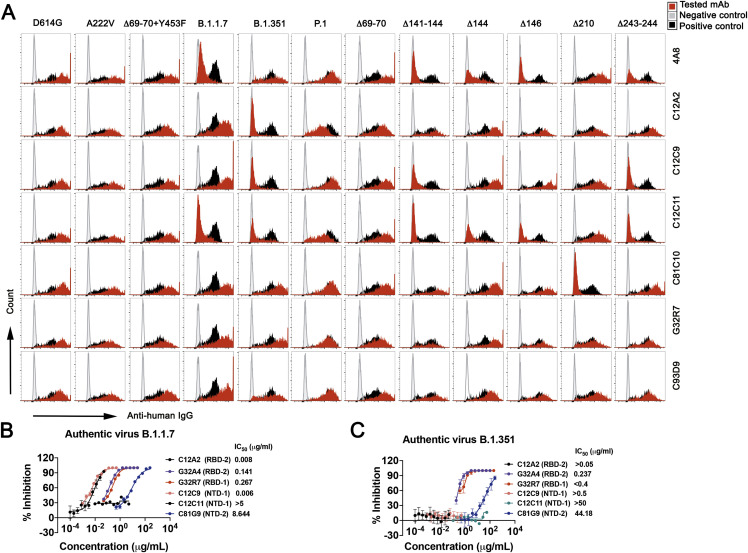
Memory B cell reserves can generate protective antibodies against repeated SARS-CoV-2 infections, but with unknown reach from original infection to antigenically drifted variants. We charted memory B cell receptor-encoded antibodies from 19 COVID-19 convalescent subjects against SARS-CoV-2 spike (S) and found seven major antibody competition groups against epitopes recurrently targeted across individuals. Inclusion of published and newly determined structures of antibody-S complexes identified corresponding epitopic regions. Group assignment correlated with cross-CoV-reactivity breadth, neutralization potency, and convergent antibody signatures. Although emerging SARS-CoV-2 variants of concern escaped binding by many members of the groups associated with the most potent neutralizing activity, some antibodies in each of those groups retained affinity-suggesting that otherwise redundant components of a primary immune response are important for durable protection from evolving pathogens. Our results furnish a global atlas of S-specific memory B cell repertoires and illustrate properties driving viral escape and conferring robustness against emerging variants.

Keywords: B cell; COVID-19; SARS-CoV-2; antibody; breadth; cross-reactivity; memory; neutralization; repertoire; variants.


Conflict of interest statement

Declaration of interests The authors declare no competing interests.

Figures

None
Graphical abstract
Figure 1
Figure 1
SARS-CoV-2 spike-specific mAb binding profiles (A) Cells recovered from two sorting strategies, shown in dot plots as percentages of total CD19+ cells. Left: IgG+CD27+ cells from 18 donors and the subset of those that expressed S-binding BCRs. Right: cells from three donors expressing S-binding BCRs and sorted to recover principally those that did not bind RBD. (B) Summary of all productive mAbs (recombinant human IgG1) screened by ELISA (with recombinant S ectodomain trimer) and cell-surface expression assays (both 293T and yeast cells). Total numbers in the center of each of pie chart; numbers and color codes for the indicated populations shown next to each chart. To the right of the charts for the two sorting strategies are bar graphs showing frequencies of SARS-CoV-2 RBD and NTD binding mAbs for those subjects from whom at least ten paired-chain BCR sequences were recovered. (C) Binding to a panel of S proteins and SARS-CoV-2 subdomains, listed on the left, as determined by both ELISA and by association with S expressed on the surface of 293T cells or with RBD or NTD expressed on the surface of yeast cells, for S+ sorted (left) and S+RBD sorted cells (right). Left panel, 157 clones bound to S and an additional one bound to only RBD but not S. Pink indicates ELISA screens. Blue indicates cell-based screens. Each short section of a row represents an antibody. The rows labeled VH mutation and VL mutation are heatmaps of counts (excluding CDR3) from alignment by IgBLAST, with the scale indicated. (D) Dot plots of VH and VL mutation counts in mAbs that bound RBD, NTD, S2, and a “broad CoV group” that included MERS, HKU1, and OC43. ∗∗∗p < 0.001, ∗∗∗∗p < 0.0001; nonparametric Kruskal-Wallis multiple comparison. Horizontal lines show mean ± SEM. See also Figure S1.
Figure S1
Figure S1
Sorting strategy for SARS-CoV-2-specific memory B cells and characterization of monoclonal antibodies, related to Figure 1 (A) Representative flow cytometry plots showing CD19+, CD27+, SARS-CoV-2 S-binding B cells from a convalescent subject (C12, top row) and a pre-pandemic control (bottom row). PBMCs were pre-enriched with CD19 magnetic beads then gated on live IgDIgM-IgG+CD27+ and finally on S (B) Representative flow cytometry plots showing S-positive, RBD-negative B cells for three convalescent subjects and a pre-pandemic control, sorted as in (A) except for the S gate. (C) Representative flow plot of mAb supernatant bound to SARS-CoV-2 S on HEK293T cells. Cells were gated on DAPIGFP+ population. (D) Representative flow plot of mAb supernatant bound to SARS-CoV-2 RBD on yeast. cMyc tag indicated yeast that expressed RBD. (E) Representative flow plot of mAb supernatant bound to SARS-CoV-2 NTD on yeast. cMyc tag indicated yeast that expressed NTD. See Figure 1C for the screening color scheme. (F) Bar graph of Log10(EC50) of antibodies targeting RBD, NTD and S2 using ELISA and cell-based assay. EC50 (μg/mL), RBD (n = 23), NTD clusters (n = 15) and S2 (n = 15). ∗∗∗p < 0.001, ∗∗∗∗p < 0.0001; Paired nonparametric Wilcoxon test. Data are mean values ± SEM (G) Dot plot of Log10(EC50) of antibodies in the indicated bins by cell-based assay. Antibodies are from subjects G32 and C41, sorted with S. Each dot represents one monoclonal antibody. EC50 (μg/mL), 13-39 days (n = 13), 40-63 days (n = 8). No significance; nonparametric Mann-Whitney test. Data are mean values ± SEM.
Figure S2
Figure S2
Competition mapping including antibodies from S+RBD− sort and antibodies with published structures, related to Figure 2 (A) Cross competition matrix by ELISA-based competition. Including antibodies from cells gated as S+RBD increased representation of NTD and S2 clusters. Color and shading scheme, groups defined by hierarchical clustering, and recombinant protein binding as in Fig 2A. Arrows designate antibodies described in the text, including those reported here (green) and those from published work by others (blue). (B) Cross competition matrix for mAbs from S+RBD sort by ELISA-based competition. (C) Competition in cell-based assay, for antibodies with binding in ELISA format too weak for reliable blocking measurement. See Figure 2B for procedures, heat-map color scheme, etc.
Figure 2
Figure 2
Seven recurrently targeted major epitopic regions (A) Cross competition matrix for 73 S+ mAbs with affinity sufficient for detection by ELISA. Blocking mAbs (columns) added at 100 μg/mL; detection antibodies (rows) at 1 μg/mL. Intensity of color shows strength of blocking, from 0 signal (complete blocking) to 70% full signal (top gradient at right of panel: orange). Hierarchical clustering of mAbs by cross competition into seven groups (plus a singleton labeled S2-3), enclosed in square boxes, with designations shown and in colors from dark blue (NTD-1) to dark red (S2-3). Green arrows on the left designate mAbs newly reported here. The lower parts of the panel show competition of blocking mAbs with soluble, human ACE2 (second gradient at right: dark red); log10 (IC50) (IC50 unit μg/mL) in pseudovirus (614D S) neutralization assay (third gradient at right: violet); area under the curve for ELISA binding (ELISA AUC: brown); and binding (ELISA) to recombinant domains and heterologous S (green). (B) Competition in cell-based assay for 36 mAbs with binding in ELISA format too weak for reliable blocking measurement (rows). Blocking mAbs (columns) selected from each of the seven clusters in the ELISA assay. Strength of blocking shown as intensity of orange color, as in (A). (C) Distribution of a mAbs from two individual subjects (expressed as percent of sequence pairs recovered from that subject) into the seven principal clusters, plus a non-assigned (unknown) category (unk) and S2-3. Top row shows mAb distribution from all subjects and the bottom row shows the distribution of all other individuals minus C12 and G32. See also Figure S2.
Figure S3
Figure S3
Cell-based competition assay and comparison with ELISA, related to Figure 2 (A) Representative flows plot for competition, by 20 blocking antibodies representing each of the seven principal clusters (from ELISA: Figure S2A), for binding cell-surface expressed S protein by 3 biotinylated antibodies. A non-COVID-19 related antibody and a self-blocking antibody were used as negative and positive controls. (B) Heatmap of 19 mAbs with hierarchical clustering from cell-based competition assay with 118 blocking antibodies. See Figure 2B for procedures, heat-map color scheme, etc. (C) Heatmap of 17 mAbs with hierarchical clustering from ELISA-based (left panel) and cell-surface (right panel) cross-competition. See Figure 2B for procedures, heat-map color scheme, etc. (D) Heatmap of polyclonal IgG with hierarchical clustering from ELISA-based competition with 12 blocking antibodies and a non-COVID-19 control antibody. Intensity of color shows binding intensity of detection polyclonal antibodies, from 0 signal (complete blocking) to 100% full signal.
Figure 3
Figure 3
Spatial distribution of the major RBD and NTD epitopic regions Surface regions of the SARS-CoV-2 S trimer contacted by mAbs in four of the seven principal clusters, according to the color scheme shown, with a representative Fab for all except RBD-3. The C81C10 Fab defines an epitope just outside the margin of NTD-1, but it does not compete with any antibodies in RBD-2. The RBD-2 Fv shown is that of C121 (PDB ID: 7K8X: Barnes et al., 2020), which fits most closely, of the many published RBD-2 antibodies, into our low-resolution map for C12A2. Left: views normal to and along threefold axis of the closed, all-RBD-down conformation; right: similar views of the one-RBD-up conformation. C121 (RBD-2) can bind both RBD down and RBD up; G32R7 (RBD-1) binds only the “up” conformation of the RBD. The epitopes of the several published RBD-3 antibodies are partly occluded in both closed and open conformations of the RBD; none are shown here as cartoons. A cartoon of the polypeptide chain of a single subunit (dark red) is shown within the surface contour for an S trimer (gray).
Figure 4
Figure 4
Distribution of pseudovirus neutralization potency in each competition cluster Both IC50 (A and C) and IC80 (B and D) shown for infection in two different cell lines. (A) and (B) pair: 293FT cells expressing hACE2 and TMPRSS2. (C) and (D) pair: TZM.bl cells expressing hACE2. Color gradient indicates frequency of the clones in each cluster that have the neutralization potency shown by the vertical scale. See also Figure S4.
Figure S4
Figure S4
Neutralization profiles for monoclonal antibodies of seven clusters, related to Figure 4 (A) Authentic virus (WA1) neutralization profiles of 9 antibodies. (B) Pseudovirus neutralization profiles in two cell lines for antibodies from NTD-1 cluster. Left panel: neutralization profiles in 293FT cells co-expressing hACE2 and TMPRSS2 as target cells (n = 39). Right panel: neutralization profiles in TZM.bl cells expressing hACE2 as target cells (n = 13). (C) Pseudovirus neutralization profiles in 293FT cells co-expressing hACE2 and TMPRSS2 for antibodies from RBD-1 (n = 22), RBD-2 (n = 23), RBD-3 (n = 5), NTD-2 (n = 16), S2-1 (n = 32) and S2-2 (n = 19) clusters. Data are mean values ± SD for authentic virus assays and pseudovirus assays using 293FT/hACE2/TMPRSS2 cells. Data are mean values ± SEM for assays using TZM.bl/hACE2 cells.
Figure 5
Figure 5
High diversity and some sequence convergence in competition clusters (A) IgH VH gene segments of the 167 mAbs characterized by binding SARS-CoV-2 S in either ELISA or cell-surface expression. Inner ring indicates VH family; the outer ring indicates specific VHs. PBMC repertoire is from 350 million reads of deep sequencing (Briney et al., 2019). S binders include 167 clones in Data S2. p < 0.05, ∗∗p < 0.01, ∗∗∗p < 0.001, ∗∗∗∗p < 0.0001; Bonferroni correction. Red asterisks: comparing to S binders; black asterisks: comparing to a non-selected B cell repertoire from PBMCs. (B) Maps of pairwise distances of CDRH3 (lower left triangle) and CDRL3 (upper right triangle) for the NTD-2 and S2-1 cluster mAbs from (A). Antibodies in both clusters arranged by VH usage. Clones converging on identical VH/VL and closest distance of CDRL3 from the same cluster are shown. Pairwise distances analyzed by MEGA X. Intensity of color shows the distance from 0 (identical) to 1 (no identity). Sequence alignment for the mAbs from the indicated clusters with identical VH and VL and similar CDR3s. Differences in CDR3s from the reference sequence (bold) are in red; dashes indicate missing amino acids; dots represent identical amino acids. (C) Summary of convergent sequences of anti-SARS-CoV-2 S and RBD antibodies from independent datasets. Ig sequences derived from binding to DIII of Zika virus E protein, and HA of influenza virus H1N1 were used as control datasets. Convergent sequences had identical VH and VL and >50% identity in CDRH3 and CDRL3. (D) Representative convergent clones from different individuals and independent datasets from (C). See also Figure S5.
Figure S5
Figure S5
Diversity of antibody sequences and convergent C93D9 class of antibodies, related to Figure 5 (A) V(D)J and VJ mutation levels in each of the 7 principal competition groups. Mutations in VH and VL (excluding CDR3) counted by IgBLAST. (B) Maps of pairwise distances of CDRH3 (lower left triangle) and CDRL3 (upper right triangle) for the RBD-1, RBD-2, RBD-3, NTD-1 and S2-2 cluster antibodies related to Figure 5B. (C) Two views of 20 Fab structures, listed in (E), bound with SARS-CoV-2 RBD. Structures all superposed on the RBD; heavy-and light-chains of each Fab in a distinct color. The figure includes only the RBD from 6YZ5 (not one of the 20), with the RBM in light orange and the rest of the chain in gray. (D) View as in the right-hand panel in (C), but showing only the Fab from 7B3O (the closest in sequence to C93D9), with CDRs labeled. The most intimate contacts with RBM residues are from CDRH1, CDRH2 and CDRL1, many with residues constrained in potential variability by ACE2 interaction. (E) Maps of pairwise distances of CDRH3 (lower left triangle) and CDRL3 (upper right triangle) for the 21 C93D9 class antibodies in (C) and (D). Pairwise distances analyzed by MEGA X. Intensity of color shows the distance, from 0 (identical) to 1 (no identity). The VH and VL genes encoding the antibodies are shown in the indicated groups. Differences in CDR3s from the reference sequences (bold) are in red; dashes indicate missing amino acids; dots represent identical amino acids. IGHV3-66 and IGHV3-53 are very similar VH gene segments, differing by only one encoded amino-acid residue.
Figure 6
Figure 6
Influence of mutations found in variants of concern on binding and neutralization by human mAbs (A) Positions of mutations in amino acid sequences of B.1.1.7, B.1.351 and P.1. Left panel: RBD (gray backbone cartoon) and Fvs representing each of the three RBD clusters (green, yellow, and orange backbone cartoons for RBD-1, -2, and -3, respectively). Red spheres show side chains at positions of RBD mutations N501Y (found in all three variants of concern), E484K, and K417N/T (found in B.1.351 and P.1). Right panel: NTD (gray backbone cartoon) and Fvs representing the NTD-1 cluster (blue backbone cartoon) and the C81C10 non-neutralizing antibody (cyan backbone cartoon). Spheres show side chains at positions of mutations in B.1.1.7 (yellow), B.1.351 (orange), and P.1 (red). One NTD substitution, L18F (brown), is in both B.1.351 and P.1. Although Δ242-244 is a deletion within a β strand, its effect will be to reconfigure the 248–260 loop (orange asterisk), as residues 245–247 will shift into the positions of the deleted residues in the strand. See also Figure S6. (B) Heatmap showing binding of 119 mAbs to Nextstrain cluster 20A.EU1 (A222V), Danish mink variant (Δ69-70 and Y453F), B.1.1.7 (Δ69-70, Δ144, N501Y, A570D, P681H, T716I, S982A, and D1118H), B.1.351 (L18F, D80A, D215G, Δ242-244, K417N, E484K, N501Y, and A701V), and P.1 (L18F, T20N, P26S, D138Y, R190S, K417T, E484K, N501Y, H655Y, T1027I, and D1176F) (top), and NTD deletion variants (bottom). Variants include D614G. Relative binding intensities of the tested mAbs for each variant are shown in shades of blue. (C) Heatmap showing neutralization potency of 119 mAbs to D614G, B.1.1.7, B.1.351, and P.1. Log10 transformed IC50 shown in shades of dark red. IC50, μg/mL. See also Figure S6.
Figure S6
Figure S6
Representative flow plots for mAb binding and neutralization of indicated variants, related to Figure 6 Flow plots for binding of 7 mAbs to Nextstrain cluster 20A.EU1 (A222V), Danish mink variant (Δ69-70 and Y453F), B.1.1.7 (Δ69-70, Δ144, N501Y, A570D, P681H, T716I, S982A, D1118H), B.1.351 (L18F, D80A, D215G, Δ241-243, K417N, E484K, N501Y, A701V), P.1 (L18F, T20N, P26S, D138Y, R190S, K417T, E484K, N501Y, H655Y, T1027I, D1176F) and NTD deletion variants. All variants contain the D614G mutation. Plasmids with variant S co-expressed with pmaxGFP in HEK293T cells. Cells were gated on DAPiGFP+. mAb C81E2 was used as positive control, and PBS, as negative control. (B) Authentic B.1.1.7 virus neutralization profiles for 6 antibodies. (C) Authentic B.1.351 virus neutralization profiles for 6 antibodies. Data are mean values ± SD for authentic virus assays.

Update of

References

    1. Akkaya M., Kwak K., Pierce S.K. B cell memory: building two walls of protection against pathogens. Nat. Rev. Immunol. 2020;20:229–238. - PMC - PubMed
    1. Barnes C.O., Jette C.A., Abernathy M.E., Dam K.A., Esswein S.R., Gristick H.B., Malyutin A.G., Sharaf N.G., Huey-Tubman K.E., Lee Y.E., et al. SARS-CoV-2 neutralizing antibody structures inform therapeutic strategies. Nature. 2020;588:682–687. - PMC - PubMed
    1. Baum A., Ajithdoss D., Copin R., Zhou A., Lanza K., Negron N., Ni M., Wei Y., Mohammadi K., Musser B., et al. REGN-COV2 antibodies prevent and treat SARS-CoV-2 infection in rhesus macaques and hamsters. Science. 2020;370:1110–1115. - PMC - PubMed
    1. Briney B., Inderbitzin A., Joyce C., Burton D.R. Commonality despite exceptional diversity in the baseline human antibody repertoire. Nature. 2019;566:393–397. - PMC - PubMed
    1. Brouwer P.J.M., Caniels T.G., van der Straten K., Snitselaar J.L., Aldon Y., Bangaru S., Torres J.L., Okba N.M.A., Claireaux M., Kerster G., et al. Potent neutralizing antibodies from COVID-19 patients define multiple targets of vulnerability. Science. 2020;369:643–650. - PMC - PubMed