

Area-level and family-level socioeconomic position and body composition trajectories: longitudinal analysis of the UK Millennium Cohort Study
- PMID: 34332672
- PMCID: PMC8342403
- DOI: 10.1016/S2468-2667(21)00134-1
Area-level and family-level socioeconomic position and body composition trajectories: longitudinal analysis of the UK Millennium Cohort Study
Erratum in
-
Correction to Lancet Public Health 2021; 6: e598-607.Lancet Public Health. 2022 Jun;7(6):e495. doi: 10.1016/S2468-2667(22)00114-1. Lancet Public Health. 2022. PMID: 35660210 Free PMC article. No abstract available.
Abstract
Background: Inequalities in the trajectories of body composition in childhood and adolescence have been infrequently studied. Despite the importance of environmental factors in obesity development, little research has looked at area-level socioeconomic position, independent of family socioeconomic position. We aimed to assess how inequalities in body composition develop with age.
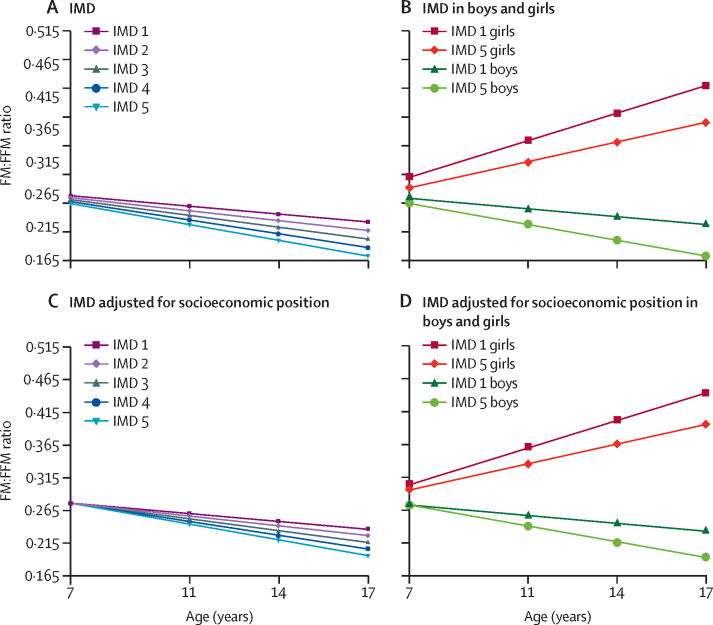
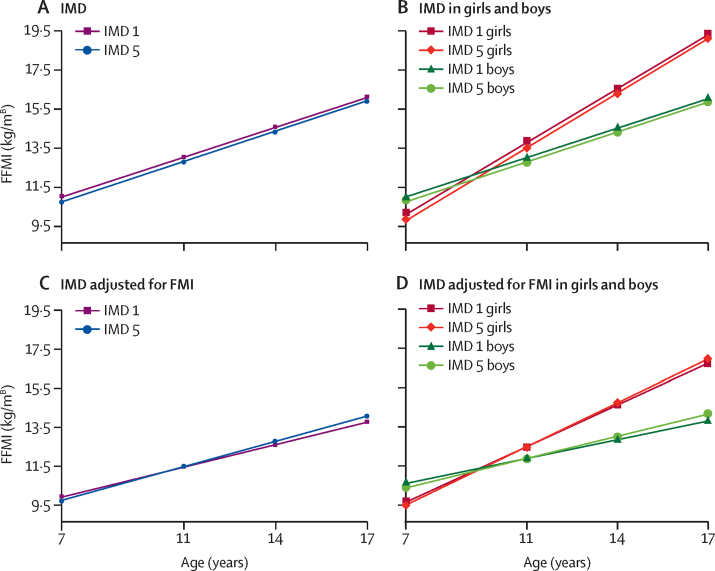
Methods: The Millennium Cohort Study is a longitudinal study of 19 243 families who had a child born between 2000 and 2002 in the UK. Multilevel growth curve models were applied to examine change in fat mass index (FMI), fat free mass index (FFMI; using the Benn index), and fat mass to fat free mass ratio (FM:FFM), measured using Bioelectrical Impedance Analysis, from ages 7 years to 17 years by the Index of Multiple Deprivation (IMD) and household income at baseline.
Findings: Inequalities in FMI and FM:FFM ratio are evident at age 7 years and widen with age. At age 17 years, adolescents in the most disadvantaged IMD group had FMI 0·57 kg/mB (B=Benn parameter; 95% CI 0·43 to 0·70) higher and FM:FFM ratio 0·037 (95% CI 0·026 to 0·047) higher compared with the most advantaged group. Disadvantaged socioeconomic position is associated with higher FFMI but is reversed in adolescence after adjustment for FMI. Inequalities were greater in girls at age 7 years (mean FMI 0·22 kg/mB; 95% CI 0·13 to 0·32) compared with boys of the same age (0·05 kg/mB; -0·04 to 0·15, p=0·3), but widen fastest in boys, especially for FMI, in which there was over an 11 times increase in the inequality from age 7 years of 0·05kg/mB (95% CI -0·04 to 0·15) to 0·62 kg/mB at 17 years (0·42 to 0·82). Inequalities for the IMD were similar to income, and persisted at age 17 years independent of family socioeconomic position.
Interpretation: Childhood and adolescence is an important period to address inequalities in body composition, as they emerge and widen. Policies should consider FFM as well as FM, and inequalities in the environment.
Funding: Medical Research Council, Economic and Social Research Council.
Copyright © 2021 The Author(s). Published by Elsevier Ltd. This is an Open Access article under the CC BY 4.0 license. Published by Elsevier Ltd.. All rights reserved.
Conflict of interest statement
Declaration of interests YK reports grants from Economic and Social Research Council (ESRC) grants from National Institutes of Health and Research, and grants from Medical Research Council, outside of the submitted work; RH reports grants from ESRC, during the study; REL reports grants from ESRC, during the study; CBS declares no competing interests.
Figures

References
-
- McLaren L. Socioeconomic status and obesity. Epidemiol Rev. 2007;29:29–48. - PubMed
-
- El-Sayed AM, Scarborough P, Galea S. Socioeconomic inequalities in childhood obesity in the United Kingdom: a systematic review of the literature. Obes Facts. 2012;5:671–692. - PubMed
-
- O'Dowd A. Fight to tackle unhealthy lifestyles has widened gap in health inequalities. BMJ. 2012;345 - PubMed
Publication types
MeSH terms
Grants and funding
LinkOut - more resources
Full Text Sources
Medical
