

Effect of Non-lockdown Social Distancing and Testing-Contact Tracing During a COVID-19 Outbreak in Daegu, South Korea, February to April 2020: A Modeling Study
- PMID: 34333119
- PMCID: PMC8320402
- DOI: 10.1016/j.ijid.2021.07.058
Effect of Non-lockdown Social Distancing and Testing-Contact Tracing During a COVID-19 Outbreak in Daegu, South Korea, February to April 2020: A Modeling Study
Abstract
Objective: In Spring 2020, South Korea applied non-lockdown social distancing (avoiding mass gathering and non-essential social engagement, without restricting the movement of people who were not patients or contacts), testing-and-isolation (testing), and tracing-and-quarantine the contacts (contact tracing) to successfully control the first large-scale COVID-19 outbreak outside China. However, the relative contributions of these two interventions remain uncertain.
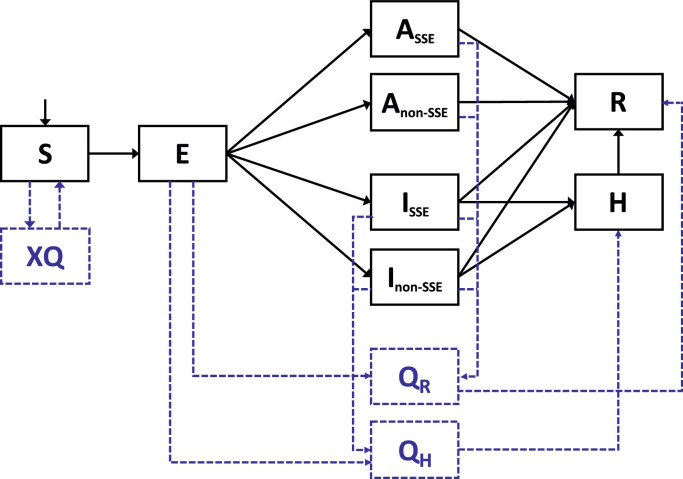
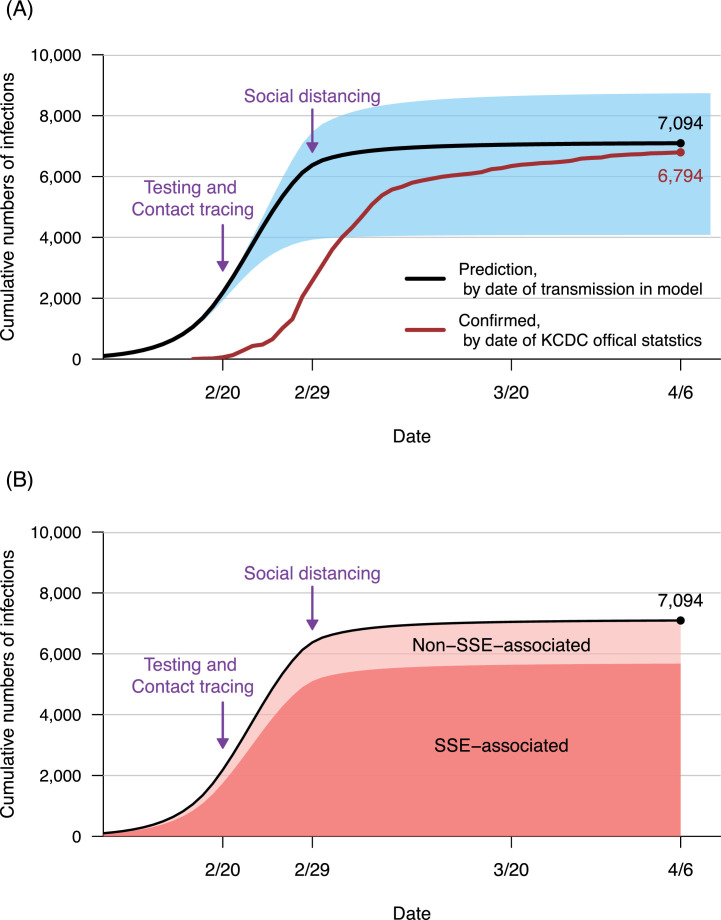
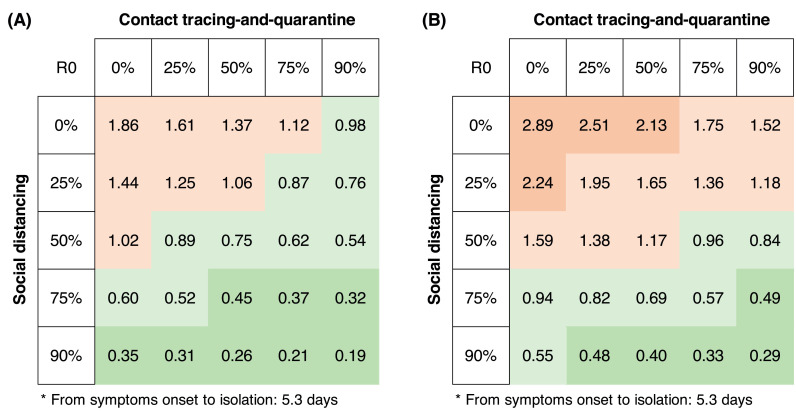
Methods: We constructed an SEIR model of SARS-CoV-2 transmission (disproportionately through superspreading events) and fit the model to outbreak data in Daegu, South Korea, from February to April 2020. We assessed the effect of non-lockdown social distancing (population-wide control measures) and/or testing-contact tracing (individual-specific control measures), alone or combined, in terms of the basic reproductive number (R0) and the trajectory of the epidemic.
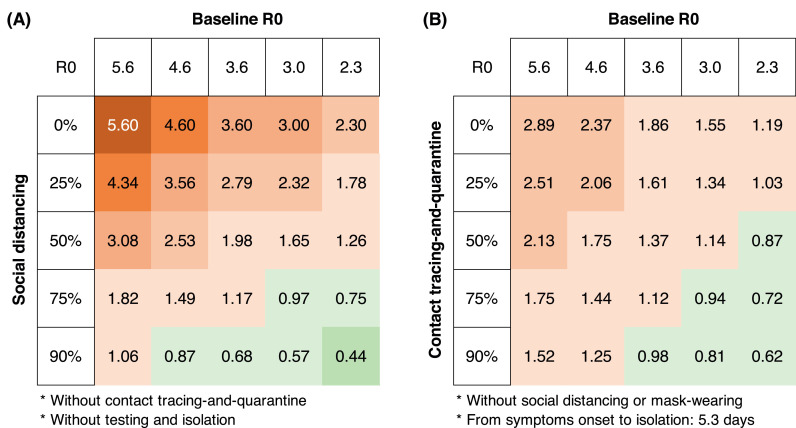
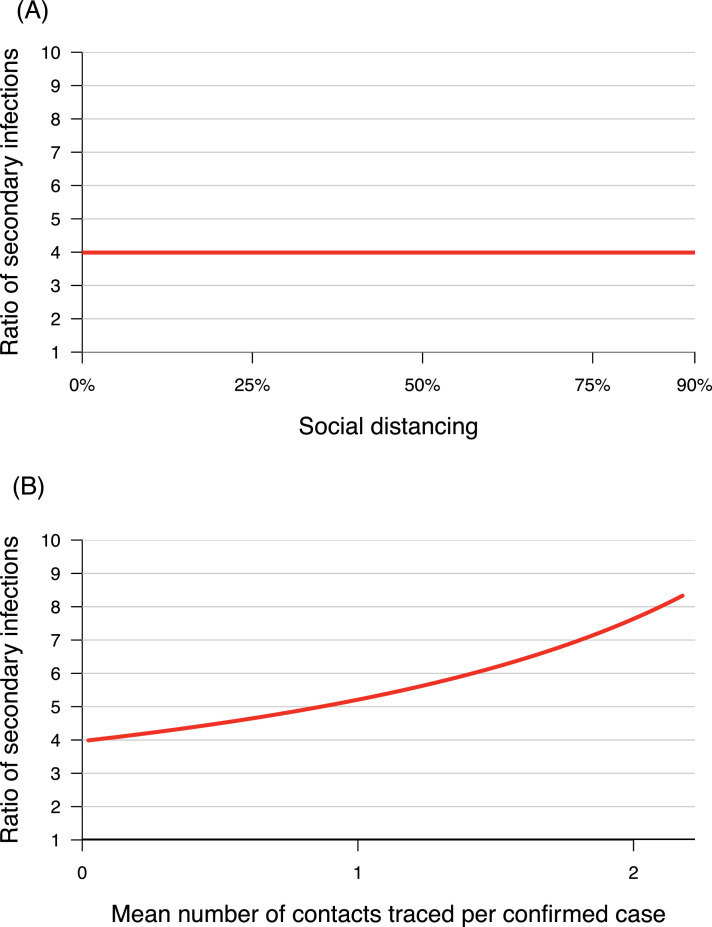
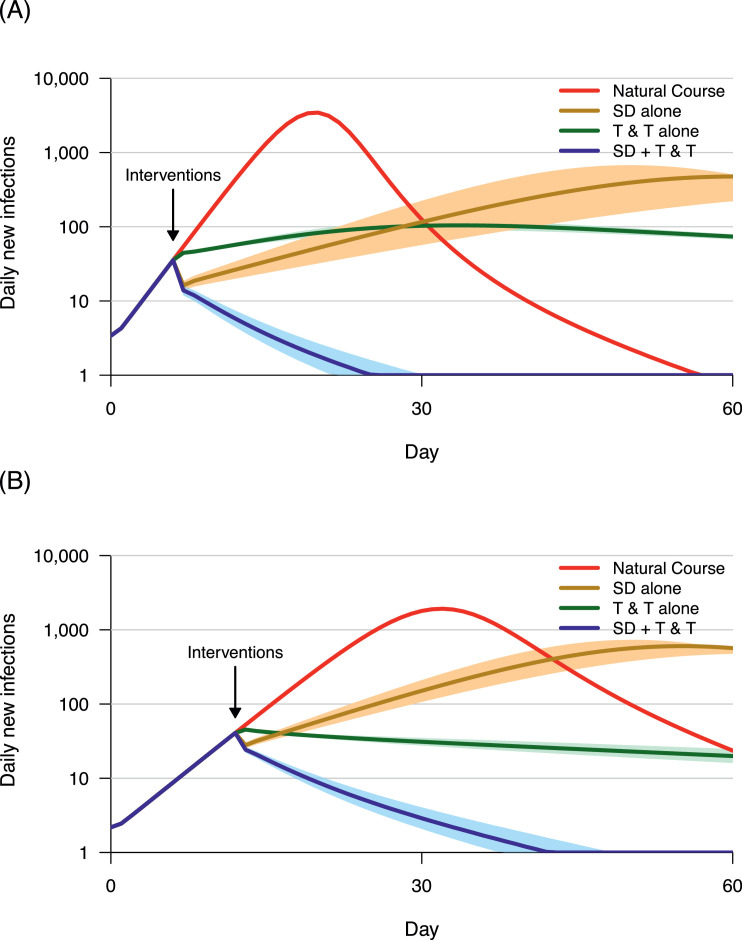
Results: The point estimate for baseline R0 is 3.6 (sensitivity analyses range: 2.3 to 5.6). Combined interventions of non-lockdown social distancing and testing-contact tracing can suppress R0 to less than one and rapidly contain the epidemic, even under the worst scenario with a high baseline R0 of 5.6. In contrast, either intervention alone will fail to suppress R0. Non-lockdown social distancing alone just postpones the peak of the epidemic, while testing-contact tracing alone only flattens the curve but does not contain the outbreak.
Conclusions: To successfully control a large-scale COVID-19 outbreak, both non-lockdown social distancing and testing-contact tracing must be implemented. The two interventions are synergistic.
Copyright © 2021 The Author(s). Published by Elsevier Ltd.. All rights reserved.
Figures
Similar articles
-
Response to COVID-19 in South Korea and implications for lifting stringent interventions.BMC Med. 2020 Oct 9;18(1):321. doi: 10.1186/s12916-020-01791-8. BMC Med. 2020. PMID: 33032601 Free PMC article.
-
The effect of control measures on COVID-19 transmission in South Korea.PLoS One. 2021 Mar 29;16(3):e0249262. doi: 10.1371/journal.pone.0249262. eCollection 2021. PLoS One. 2021. PMID: 33780504 Free PMC article.
-
The impact of social distancing, contact tracing, and case isolation interventions to suppress the COVID-19 epidemic: A modeling study.Epidemics. 2021 Sep;36:100483. doi: 10.1016/j.epidem.2021.100483. Epub 2021 Jul 13. Epidemics. 2021. PMID: 34284227 Free PMC article.
-
Non-Pharmaceutical Interventions against COVID-19 Pandemic: Review of Contact Tracing and Social Distancing Technologies, Protocols, Apps, Security and Open Research Directions.Sensors (Basel). 2021 Dec 30;22(1):280. doi: 10.3390/s22010280. Sensors (Basel). 2021. PMID: 35009822 Free PMC article. Review.
-
[What is the effect of social distancing on the course of COVID-19 epidemic?].Pol Merkur Lekarski. 2021 Feb 24;49(289):71-79. Pol Merkur Lekarski. 2021. PMID: 33713099 Review. Polish.
Cited by
-
Serial Interval and Transmission Dynamics during SARS-CoV-2 Delta Variant Predominance, South Korea.Emerg Infect Dis. 2022 Feb;28(2):407-410. doi: 10.3201/eid2802.211774. Epub 2021 Dec 14. Emerg Infect Dis. 2022. PMID: 34906289 Free PMC article.
-
Incidence and features of maxillofacial fractures at Jordanian tertiary hospital before, during and after the COVID-19 period.Med Oral Patol Oral Cir Bucal. 2023 Sep 1;28(5):e412-e417. doi: 10.4317/medoral.25835. Med Oral Patol Oral Cir Bucal. 2023. PMID: 36641737 Free PMC article.
-
Evaluating the impact of test-trace-isolate for COVID-19 management and alternative strategies.PLoS Comput Biol. 2023 Sep 1;19(9):e1011423. doi: 10.1371/journal.pcbi.1011423. eCollection 2023 Sep. PLoS Comput Biol. 2023. PMID: 37656743 Free PMC article.
-
Impacts of social distancing policy and vaccination during the COVID-19 pandemic in the Republic of Korea.J Econ Dyn Control. 2023 May;150:104642. doi: 10.1016/j.jedc.2023.104642. Epub 2023 Mar 20. J Econ Dyn Control. 2023. PMID: 37006964 Free PMC article.
-
From pandemic to a new normal: Strategies to optimise governmental interventions in Indonesia based on an SVEIQHR-type mathematical model.Infect Dis Model. 2022 Sep;7(3):346-363. doi: 10.1016/j.idm.2022.06.004. Epub 2022 Jun 30. Infect Dis Model. 2022. PMID: 35789595 Free PMC article.
References
-
- Adam DC, Wu P, Wong JY, Lau EHY, Tsang TK, Cauchemez S, et al. Clustering and superspreading potential of SARS-CoV-2 infections in Hong Kong. Nat Med. 2020;26(11):1714–1719. - PubMed
-
- Chang SC. Proportion of asymptomatic SARS-CoV-2 infections among 398 laboratory-confirmed SARS-CoV-2-infected patients in Taiwan [in traditional Chinese]. Available from: https://news.ltn.com.tw/news/life/breakingnews/3137967. Accessed on: 2020-04-18 2021.
MeSH terms
LinkOut - more resources
Full Text Sources
Medical
Miscellaneous
