

Assessing the Spatio-temporal Spread of COVID-19 via Compartmental Models with Diffusion in Italy, USA, and Brazil
- PMID: 34335018
- PMCID: PMC8315263
- DOI: 10.1007/s11831-021-09627-1
Assessing the Spatio-temporal Spread of COVID-19 via Compartmental Models with Diffusion in Italy, USA, and Brazil
Abstract
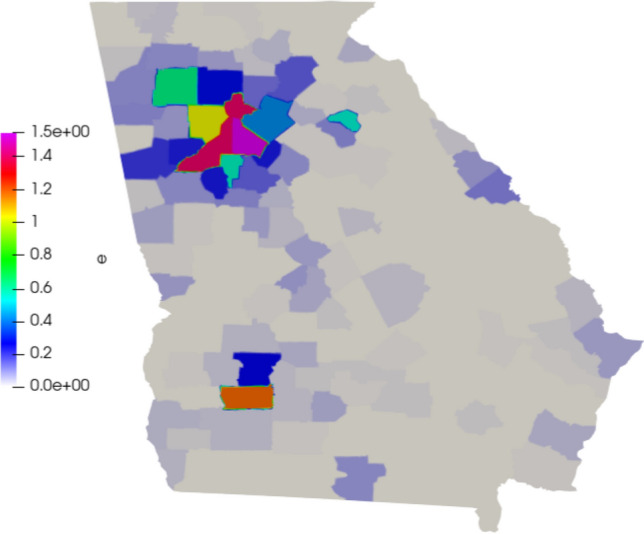
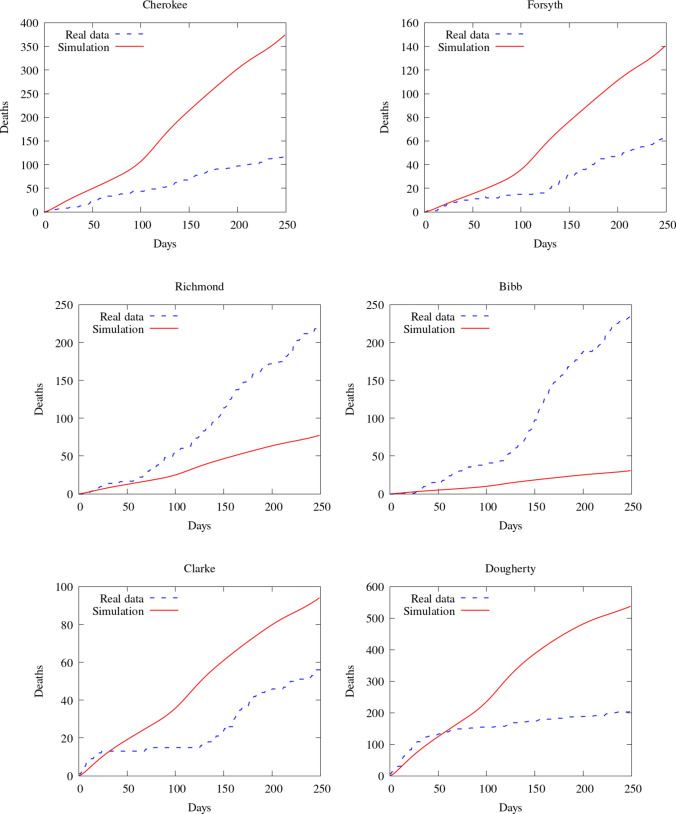
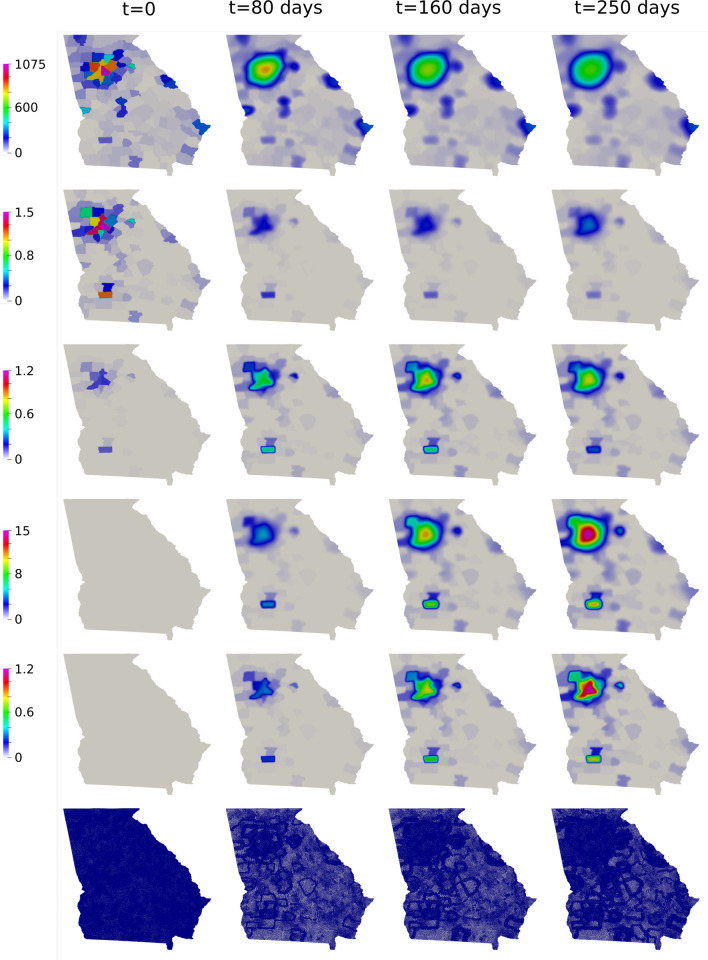
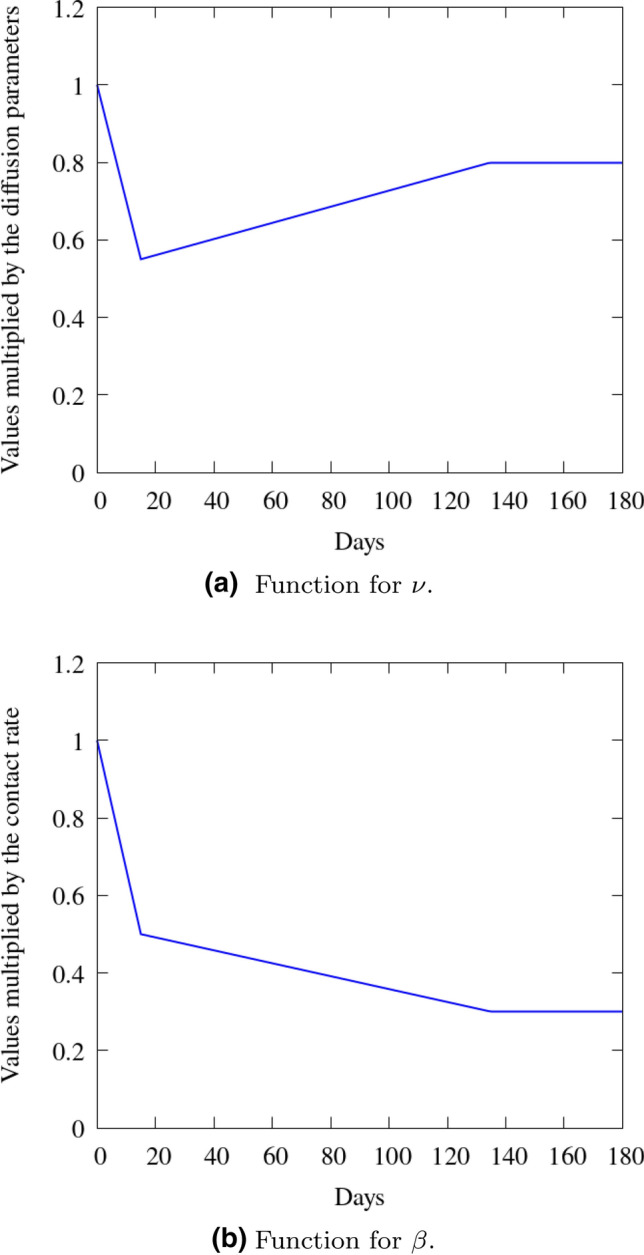
The outbreak of COVID-19 in 2020 has led to a surge in interest in the mathematical modeling of infectious diseases. Such models are usually defined as compartmental models, in which the population under study is divided into compartments based on qualitative characteristics, with different assumptions about the nature and rate of transfer across compartments. Though most commonly formulated as ordinary differential equation models, in which the compartments depend only on time, recent works have also focused on partial differential equation (PDE) models, incorporating the variation of an epidemic in space. Such research on PDE models within a Susceptible, Infected, Exposed, Recovered, and Deceased framework has led to promising results in reproducing COVID-19 contagion dynamics. In this paper, we assess the robustness of this modeling framework by considering different geometries over more extended periods than in other similar studies. We first validate our code by reproducing previously shown results for Lombardy, Italy. We then focus on the U.S. state of Georgia and on the Brazilian state of Rio de Janeiro, one of the most impacted areas in the world. Our results show good agreement with real-world epidemiological data in both time and space for all regions across major areas and across three different continents, suggesting that the modeling approach is both valid and robust.
© The Author(s) 2021.
Conflict of interest statement
Conflict of interestThe authors declare that they have no conflict of interest.
Figures


References
-
- Aràndiga F, Baeza A, Cordero-Carrión I, Donat R, Martí MC, Mulet P, Yáñez DF. A spatial-temporal model for the evolution of the covid-19 pandemic in spain including mobility. Mathematics. 2020;8(10):1677. doi: 10.3390/math8101677. - DOI
-
- Balay S, Abhyankar S, Adams MF, Brown J, Brune P, Buschelman K, Dalcin L, Dener A, Eijkhout V, Gropp WD, Karpeyev D, Kaushik D, Knepley MG, May DA, McInnes LC, Mills RT, Munson T, Rupp K, Sanan P, Smith BF, Zampini S, Zhang H, Zhang H (2019) PETSc Web page. https://www.mcs.anl.gov/petsc
-
- Bellomo N, Bingham R, Chaplain MA, Dosi G, Forni G, Knopoff DA, Lowengrub J, Twarock R, Virgillito ME. A multi-scale model of virus pandemic: heterogeneous interactive entities in a globally connected world. Math Models Methods Appl Sci. 2020;30:1591–1651. doi: 10.1142/S0218202520500323. - DOI - PMC - PubMed
-
- Bertrand F, Pirch E. Least-squares finite element method for a meso-scale model of the spread of COVID-19. Computation. 2021;9(2):18. doi: 10.3390/computation9020018. - DOI
LinkOut - more resources
Full Text Sources