Short Sleep Duration and Its Association with Obesity and Other Metabolic Risk Factors in Kuwaiti Urban Adults
- PMID: 34335063
- PMCID: PMC8318215
- DOI: 10.2147/NSS.S311415
Short Sleep Duration and Its Association with Obesity and Other Metabolic Risk Factors in Kuwaiti Urban Adults
Abstract
Background: Efficient sleep duration and its quality are increasingly recognized as important contributors for maintaining normal body weight. However, lifestyle and social structure within the Arab-gulf region differ compared to those in the western world. This study was specifically conducted in Kuwait's population to investigate the link between sleep quality (SQ) and obesity in the absence of sleep apnea (SA) onset.
Methods: SQ was measured by the Pittsburgh Sleep Quality Index (PQSI) in 984 participants, then verified in 60 individuals including 20 lean (Body mass index/BMI: 18.5-24.9 kg/m2), 20 overweight (BMI: 25-29.9 kg/m2) and 20 obese (BMI: ≥30 kg/m2) through actigraph worn over the right-hip for 7 consecutive days to characterize their sleep-wake cycle, rest-activity, and physical activity. Blood samples were collected for metabolic markers.
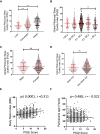
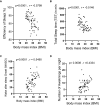
Results: 59.6% of participants reported a PSQI score higher than 5, with 57.6% of the participants reporting less than 6 hours of sleep per day. The data show that both SQ and sleep duration are considered inadequate in comparison to the international SQ standards. We found a significant association between SQ and obesity independent of age and sex. Actigraph data further supported the independent association of sleep duration on BMI within the population (p < 0.001). Additionally, total sleep time (TST) was found to significantly correlate with several other metabolic factors including diastolic blood pressure, elevated resting heart rate (RHR), triglycerides, total cholesterol, homeostatic model assessment for insulin resistance (HOMA-IR), C-peptide, and C-Reactive Protein (CRP) secretion. Further multiple-regression analysis showed a significant independent association between blood pressure (p < 0.03), HOMA-IR (p < 0.04), and C-peptide (p < 0.3) and sleep duration.
Conclusion: These findings suggest that sleep deprivation and disturbance could be indirect factors involved in the development of not only obesity in Kuwait but also other metabolic syndromes such as type 2 diabetes.
Keywords: Kuwait; PSQI; obesity; sleep.
© 2021 Al-Rashed et al.
Conflict of interest statement
The authors declare that there are no conflicts of interest involved.
Figures


Similar articles
-
The effectiveness of web-based programs on the reduction of childhood obesity in school-aged children: A systematic review.JBI Libr Syst Rev. 2012;10(42 Suppl):1-14. doi: 10.11124/jbisrir-2012-248. JBI Libr Syst Rev. 2012. PMID: 27820152
-
Association Between Sleep Duration, Quality and Body Mass Index in the Korean Population.J Clin Sleep Med. 2018 Aug 15;14(8):1353-1360. doi: 10.5664/jcsm.7272. J Clin Sleep Med. 2018. PMID: 30092896 Free PMC article.
-
Metabolic alterations in adolescents with obstructive sleep apnea.Int J Pediatr Otorhinolaryngol. 2015 Dec;79(12):2368-73. doi: 10.1016/j.ijporl.2015.10.046. Epub 2015 Nov 3. Int J Pediatr Otorhinolaryngol. 2015. PMID: 26581829
-
Sleep efficiency as a determinant of insulin sensitivity in overweight and obese adolescents.Diabetes Obes Metab. 2015 Sep;17 Suppl 1:90-8. doi: 10.1111/dom.12515. Diabetes Obes Metab. 2015. PMID: 26332973 Review.
-
Offspring body size and metabolic profile - effects of lifestyle intervention in obese pregnant women.Dan Med J. 2014 Jul;61(7):B4893. Dan Med J. 2014. PMID: 25123127 Review.
Cited by
-
Non-Right Handedness is Associated with More Time Awake After Sleep Onset and Higher Daytime Sleepiness Than Right Handedness: Objective (Actigraphic) and Subjective Data from a Large Community Sample.Nat Sci Sleep. 2022 May 5;14:877-890. doi: 10.2147/NSS.S358352. eCollection 2022. Nat Sci Sleep. 2022. PMID: 35547181 Free PMC article.
-
Excessive body weight and its contributing factors in visually impaired patients in northwest Ethiopia, 2024.Front Endocrinol (Lausanne). 2025 Mar 20;16:1514308. doi: 10.3389/fendo.2025.1514308. eCollection 2025. Front Endocrinol (Lausanne). 2025. PMID: 40182627 Free PMC article.
-
Dietary Habits and Determinants of Overnutrition Among Secondary and Preparatory School Adolescents: A Multi-Center Unmatched Case-Control Study.Am J Lifestyle Med. 2024 Aug 24:15598276241274202. doi: 10.1177/15598276241274202. Online ahead of print. Am J Lifestyle Med. 2024. PMID: 39554961 Free PMC article.
-
Poor sleep and the metabolic derangements associated with obesity in adult males.J Family Med Prim Care. 2022 May;11(5):2026-2031. doi: 10.4103/jfmpc.jfmpc_1787_21. Epub 2022 May 14. J Family Med Prim Care. 2022. PMID: 35800495 Free PMC article.
-
Impact of socioeconomic status on obesity in older adults: the suppressive effect of social support and sleep quality.BMC Geriatr. 2025 Jul 2;25(1):440. doi: 10.1186/s12877-025-06089-z. BMC Geriatr. 2025. PMID: 40604489 Free PMC article.
References
-
- Blüher M. Obesity: global epidemiology and pathogenesis. Nat Rev Endocrinol. 2019;15(5):288–298. - PubMed
-
- Seidell JC, Halberstadt J. The global burden of obesity and the challenges of prevention. Ann Nutr Metab. 2015;66(Suppl 2):7–12. - PubMed
-
- Adams KF, Schatzkin A, Harris TB, et al. Overweight, obesity, and mortality in a large prospective cohort of persons 50 to 71 years old. N Engl J Med. 2006;355(8):763–778. - PubMed
LinkOut - more resources
Full Text Sources
Research Materials
Miscellaneous

